Earth Planets Space,51, 1035–1046, 1999
2-D georesistivity structure in the central part of the northeastern Japan arc
Yukio Fujinawa1, Noriaki Kawakami2, Jun Inoue2, Theodore H. Asch2, Shinji Takasugi3, and Yoshimori Honkura4
1National Research Institute for Earth Science and Disaster Prevention, Tennohdai 3-1, Tsukuba-shi, Ibaraki 305-0006, Japan 2Geothermal Energy Research and Development Co., Ltd., 11-7, Kabuto-cho, Nihonbashi, Chuo-ku, Tokyo 103-0026, Japan
3Geothermal Engineering Co., Ltd., 804, Koami-cho, Nihonbashi, Chuo-ku, Tokyo 103-0016, Japan 4Tokyo Institute of Technology, Ookayama 2-12-1, Meguro-ku, Tokyo 152-8551, Japan
(Received November 4, 1998; Revised September 8, 1999; Accepted September 10, 1999)
Wide-band (0.002∼20,000 Hz) magnetotelluric measurements (MT) observations have been conducted along three traverses in the central Tohoku district of the northeastern Japan arc at 86 observation sites since 1990 in order to image the electrical resistivity structure. We used the impedance tensors fully corrected for the three-dimensional galvanic distortion effects including static shift effects in order to refine previous 2-D models (discussed in Fujinawa et al., 1997). The subsurface 3-D effects are found to be generally small with the result of a slight difference between the present model and the previously reported one.
The modeling results indicate that the crust is homogeneous without an enhanced conductivity zone in the lower crust, in general agreement with results in the northern part of the Tohoku district. The refined resistivity profiles delineate more clearly two near-surface conductive anomalies located in the fracture zone between the Dewa Hill and the Central Basin Range, and in the zone between the Kitakami and Abukuma River regions. Conductors in the crust west of the Sekiryo Mountain Range generally correlate well with mapped faults or pre-Tertiary tectonic lines. Several buried faults are also suggested from the conductivity data. The electrical resistivity distribution and known active faults are integrated to better understand the seismo-tectonics and geologic regime associated with the subduction processes in the Japan arc region.
1.
Introduction
Knowledge of the georesistivity distribution may be help-ful for understanding tectonic processes including associated seismicity and regional metamorphic activity. Combined use of georesistivity data with other geophysical data such as gravity, geomagnetism, and deformation parameters is es-sential to reveal the geological regime in the crust and upper mantle. The Tohoku area with both active volcanic and seis-mic activity is located in northeastern Japan arc where the Pacific plate subducts beneath the European plate. The struc-ture of the crust in the region has been investigated using seis-mic and electromagnetic approaches since 1990 (Yokokura et al., 1992; Fujinawaet al., 1997) to construct a geodynamic model of the island arc. The present study is concerned with the electromagnetic measurements. The geological and tec-tonic setting in this region can be seen in Fujinawaet al. (1997) and Ogawa (1992), and a historical background of MT surveying in northeast Japan is discussed in previous reports (Fujinawaet al., 1997).
It was revealed that there are prominent conductors around the Central Basins and the east of the Central Mountain Ranges in the central part of the Tohoku district. The 2-D models presented there did not, however, reflect correc-tions for 3-D subsurface heterogeneity effects. These were shown to be rather small but could not be totally neglected
Copy right cThe Society of Geomagnetism and Earth, Planetary and Space Sciences (SGEPSS); The Seismological Society of Japan; The Volcanological Society of Japan; The Geodetic Society of Japan; The Japanese Society for Planetary Sciences.
(Kawakami et al., 1997) using the Groom-Bailey Decom-position (GBD) method (Groom and Bailey, 1989, 1991; Groomet al., 1993).
In this report we present 2-D models using the impedance tensors fully corrected for the galvanic distortion effects at each site determined by the GBD procedure taking into ac-count the gain factor. The TEM (Transient ElectroMagnetic) method (Sternberg et al., 1988) is adopted to infer the site gain factor, which can not be obtained directly by the GBD technique. We limit our investigation to 2-D modeling in this report; 3-D modeling is not treated but will be reported in future.
In northeastern Japan there is an extensive seismic net-work which has been developed by Tohoku University (e.g., Hasegawa et al., 1991). This network provides detailed knowledge of regional seismicity including the depths of the Conrad and Moho Discontinuities (Horiuchiet al., 1982a,b; Zhaoet al., 1992a). The structure of the subducted Pacific Plate (Umino and Hasegawa, 1975) and the seismic velocity structure (Hasemiet al., 1984; Obaraet al., 1986; Zhaoet al., 1992b) could also be delineated. These seismic structures could be more clearly interpreted if the regional ity structure can be used, especially because the georesistiv-ity is known to be sensitive to interstitial pore water and to partial melting of rock, which are important factors in the earthquake occurrence. The conductivity of the lower crust is of particular interest because the seismicity in the region is almost confined to the upper crust.
Y. FUJINAWAet al.: 2-D GEORESISTIVITY STRUCTURE 1037
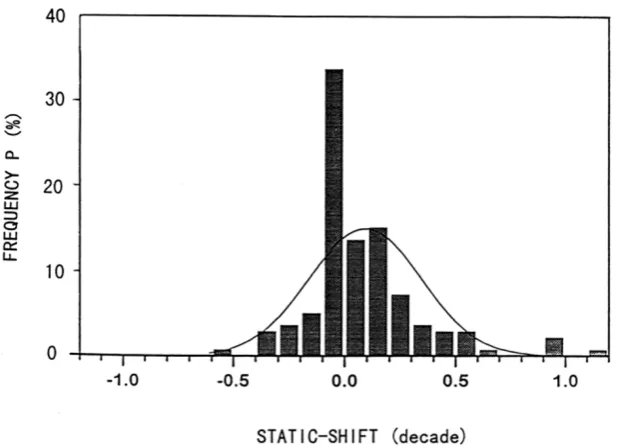
Fig. 2. Histogram of the static-shifts estimated by the TEM observations at all the MT points except four sites where TEM measurements could not be successfully conducted or the merging of the MT and TEM data was not successful.
2.
Observation and Data
The survey design and measurement procedures are de-scribed in Fujinawaet al.(1997). The previous model used broadband magnetotelluric data acquired at 78 observation sites in the central part of the northeastern Japan arc along over three traverses (Lines A, B, and C from north to south) (Fig. 1). The magnetotelluric observations were conducted at 37, 19, and 22 sites each on Lines A, B, and C, respec-tively. A total of eight observation sites were added after the previous report in order to investigate in more detail pos-sible conductive bodies indicated previously and to check the plausibility of localized conductive anomalies which ap-peared only at some isolated sites on the profiles. The stan-dard remote reference technique of Gambleet al.(1979) was adopted in order to improve the quality of the acquired MT data. Data quality is generally good in the mountaneous area, but not in urban areas along the eastern heavily populated plain area. Several steps to improve data quality were taken besides the remote reference technique, such as smoothing of the impedance tensor in the frequency domain through the 1-D Bostic model as in previous report. The smoothed impedance data are sampled at chosen frequencies on the basis of the 1-D model.
In the tensor distortion analysis the site gain factor related to the static-shift caused by charge accumulation at bound-aries can not be calculated during the GBD procedure, and so needs to be inferred by some other means. In this study,
a time-domain em measurement method (Sternberg et al.,
1988) was applied to handle MT static-shifts (Jiracek, 1990), utilizing a TEM-FAST ProSystem (AEMR Co., Ltd.). A co-incident in-loop TEM measurement was made using a rect-angular antenna configuration with total length 200–300 m. A longer loop was used when the S/N ratio was too low at sites with high resistivities to provide sufficiently small error bars for the longest time intervals of data acquisition.
The apparent resistivity was calculated through the
late-time asymptotic response (Spies and Eggers, 1986). One-dimensional analysis of the TEM data was used to obtain layered models of the shallow depths. This provides an in-dependent estimation of the apparent resistivity and phase at the higher MT measurement frequency bands. A frequency distribution of the TEM apparent resistivities and phases were merged with the MT measurements for both the orthogonal TE and TM modes. Considerable scatter of data of the MT apparent resistivity and phase led us to adopt frequency do-main averaging to get plausible static-shifts. At two of the MT sites, the TEM and MT phase curves do not match well with the result of failure to estimate the static shifts by this method.
Calculated static shifts are shown in Fig. 2 for the TE and TM modes. The amount of shifts turned out to be less than 0.2 decade for 70% of the data. The simple mean of the absolute value of the shift S¯ = 0.084 decade and the standard deviationσ =0.24 decade. Range of the estimated static shifts is generally in accord with that reported by Meju (1996) at more than a hundred sites in spite of the variety of geologic regime at observation area. It is therefore suggested that the previous 2-D MT resistivity model (Fujinawaet al.,
1997) is not very different from the “real” image. Some
sites, however, exhibit large shifts of a decade or more, and indicate that the static shift corrections should be used in the modeling.
3.
Subsurface Distortions
It has been demonstrated that the electrical resistivity structure in the survey region is nearly two-dimensional (Fujinawaet al., 1997; Kawakamiet al., 1997). Moreover, the effect of subsurface 3-D heterogeneities have been quan-titatively estimated by means of the Groom-Bailey tensor decomposition method, or GBD (Groom and Bailey, 1989,
1991; Groom et al., 1993). This practical technique
the observed impedance tensor Zob. The GBD
decomposi-tion procedure provides values for regional strike direcdecomposi-tion
φ, thrustt, and shearebut not site gaing. The site gain was determined by using the result of the TEM.
The decomposition analysis was applied to the whole data including new data acquired at sites designated as the 900 series (9** in Fig. 1). The GBD method indicated that the 3-D heterogeneity effect at major sites could be reasonably described as the 3-D galvanic distortion over the 2-D induc-tive structure. The estimated regional strike direction was distributed around north-northwest to south-southwest with considerable deviation at several sites. And the strike corre-lates well with that of the geological units and the axis of the island arc, though a little bit inclined toward west (Kawakami
et al., 1997). At several sites the GBD result shows that the 3-D effects are not consistent with the assumed 3-D galvanic distortions with a considerable 3-D structure at depth having large skew angles (Kawakamiet al., 1998). Those sites reveal that the GBD-indicated structural trend of the Neogene units being nearly parallel to the trench axis are different from the trend of the pre-Tertiary basement rock units (Kimuraet al., 1991). Results of 2-D modeling should be treated carefully in the interpretation beneath those sites at depth of the lower crust and upper mantle. Those 3-D induction features can only be treated using the 3-D modeling result, which belongs to a theme of a future report.
4.
2-D Modeling
Considering the considerable scatter in the strike direction ensemble in the GBD analysis, we assume, for simplicity, that the regional strike in the 2-D modeling is N-S, as in the
previous report by Fujinawaet al.(1997). The 2-D MT
in-version algorithm, GRRI (Leeet al., 1995; Yamaneet al., 1996), was applied to this data as in the previous analysis. The algorithm is an extension of the RRI algorithm, devel-oped by Smith and Booker (1991). Possible effects of the Pacific Ocean and the Japan Sea are considered by assuming surface zones 50 m deep with resistivities of 0.2 ohm.m (salt water) out from the coast and adjacent to the regional
pro-files. All of the free inversion parameters are the same as in the previous study except those of the modeling mesh.
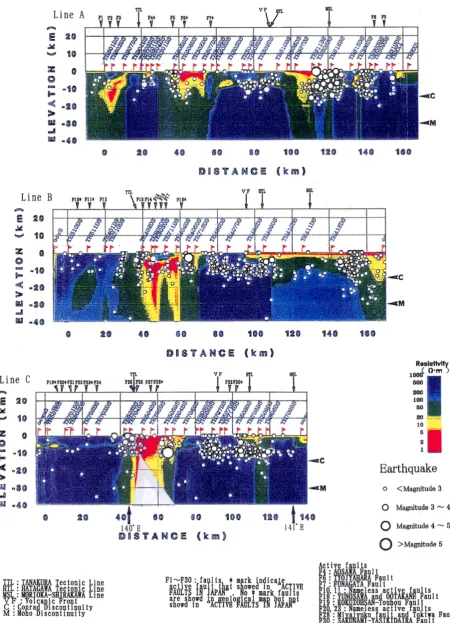
The final 2-D models along the three traverses are pre-sented in Fig. 3. The earthquake hypocenters through the seismic network of Tohoku University are overlain. Here the TM-mode models are only displayed though we obtained the 2-D models for the TM, TE, and joint modes. The TM mode inversions resulted in 2-D models thatfit the observed data at almost all sites along the three traverses over the specified frequency range (Fig. 4(a)). Figure 4(b) shows the apparent resistivity and phase data corresponding to observed raw data at the transect B. Here error bars denoting 50% confidence limit at the whole sites on line B can be seen in Fig. 4(b) (symbol ]).
The convergence in inversion is judged rather subjectively based on thefit of the model data to the observed data as well as on overall smoothness of the model. The observed data and the calculated values along the three lines are shown in Fig. 4(a). Generally, there is a goodfit by the models to the data though there are several sites with a large degree of misfit over certain frequency bands, and increased misfit in
comparison with the previous model (Fujinawaet al., 1997) at several sites.
Inverting the TE mode, however, resulted in a quite differ-ent model compared with the TM model, though thefit of the model to the data is satisfactory at most of sites. We could not succeed in getting a model consistent with that obtained for the TM mode, in spite of many trials with different mesh design, deletion of neighboring sites with large differences (contrasts) in apparent resistivity, or even supplementing the data set with additional synthetic sites near the problematic locations. Therefore, the TE modeling is set aside in this paper as a subject for future investigation.
The following is a comparison of the 2-D models from the present study using Z2Dand those from Fujinawaet al.
(1997) constructed using the “uncorrected”data Zob. We
now have more reasonable 2-D models of the region in the sense that the impedance tensors are of a 2-D structure. New models are found to be very similar with old ones in spite of usage of corrected impedance data and a larger dataset with addition of eight new sites. Two prominent conductive bod-ies, CB around the Central Basin (around Sites 605–203), and KK, east of the Central Mountain Range around the Ki-takami River (around the sites 306–612), appear to be nearly the same as in the previous model. It is possibly because ef-fects of the static-shifts are not meaningfully large under the condition of the smoothness constraint adopted, and because the impedance tensors at additional sites are not so much dif-ferent from those at neighbouring sites used in the previous model.
Along Line A Fujinawaet al.(1997) presented an
local-ized conductive anomaly in the Central Mountain Ranges (Sekiryou: SE) under Site 204, which has little similarity with sorrounding sites. The anomaly was suggested not to be a numerical modeling artifact, but a local heterogeneity re-lated to geothermal activity at a nearby Quaternary volcano. In order to test this hypothesis, supplemental MT data were acquired at Site 902 which is just east of Site 204 (Fig. 1). The apparent resistivity profile at Site 902 turned out to be very similar to those at Sites 304 and 609 which do not have the prominent conductive anomaly. Thus the data at Site 204 was discarded in the present 2-D modeling investigation.
Another conductive anomaly (PC) located near the Pacific coast, around Sites 308 and 309, was discussed in some detail in Fujinawaet al.(1997). In order to resolve the problem additional data were acquired at Site 903 near the conductive anomaly PC. The resulting model does not indicate a strong conductor in this region though there appears to be a small conductive body. We can conclude that the PC anomaly is not real, but induced by possible 3-D effects and by inclusion of data from Site 308 of fair quality. Weakly conductive bodies extending from the middle crust down to Moho depths under Sites 611 and 612 near KK, however, are probably not real
because the models obtained by using afiner mesh in the
upper crust did not include these conductors. They may possibly be caused by inappropriate mesh design.
The presence of the apparent conductor (JP) located near
the Japan Sea under Site 602 (Fujinawa et al., 1997) was
Y. FUJINAWAet al.: 2-D GEORESISTIVITY STRUCTURE 1039
Fig. 4(a). Calculated model response (. . .), and observed data of the TM mode ( ] ) used in the 2-D inversions at the three transects (A, B, C). The“observed”
Y. FUJINAWAet al.: 2-D GEORESISTIVITY STRUCTURE 1041
same as that of its easterly neighbor, Site 603, and that Site 907 is in a transition zone between the neighboring regions. Experiments in the course of searching reasonable models through the inversion suggested that the vertical striping is caused by either severe 3-D heterogeneities or by
inappro-priate mesh design. Using a finer modelling mesh in the
near-surface resulted in a conductor that is less than about 1 km in thickness compared with the case shown in Fig. 3 extending downward several kilometers in depth. Therefore, we can assume that there is a conductive body in the upper crust and possibly another conductive body near the Conrad Discontinuity under Site 602.
In Line B only Site (908) was added on this line between Sites 402 and 403, near the conductive body CB. The present model for Line B, presented in Fig. 3, is almost the same as that in Fujinawa et al.(1997). This is possibly due to a small 3-D heterogeneity effect around this area. There are two prominent conductors in this region: a thin, wide subsurface conductor east of the Central Mountain Range between Sites 408 and 412, and a very prominent conductor west of the Central Mountain Range between Sites 402 and 404. The latter was erroneously described in Fujinawa et al. (1997) as under the Yamagata basin. This conductor (CB) probably corresponds to an extensive fracture zone west of the Yamagata Basin, as presented in Figs. l and 3.
The upper part of the Yamagata basin is characterised by a thin conductor with a thickness less than 1 km (see Fig. 3). A very shallow conductor can be seen under Site 712, both in the present model and in the previous study. The vertical striping of the western conductive anomaly CB appearing in the model may be a numerical artifact. We can not, how-ever, deny the possibility of a vertical extension of the con-ductive signature corresponding to major faults extending deeper than the Conrad discontinuity. We note the similarity with the deep penetration of a fracture zone found in western Quebec (Calvertet al., 1995; Tournerie and Chouteau, 1998) though caution is needed in making this comparison because of the different tectonic regimes in the two regions.
A resistive region in the upper crust west of the conduc-tive fracture zone is thought to correspond to plutonic rocks around Mt. Asahi. It is to be noted that the lower crust in this region is relatively more resistive in comparison with the upper crust.
In Line C three sites were added to this line in order to develop a clearer image of the two conductive bodies pre-viously indicated. The model presented for Line C (Fig. 3) indicate a thin conductive body east of the Central Moun-tain Range and a very prominent conductor extending down into the fracture zone. The conductor is much smaller in the eastern half of the Central Basin. The conductor CB is considered to be corresponding to the fracture or fault zones in the region between Sites 704 and 706.
The vertical striping under the conductor east of the pre-Tertiary Hatagawa tectonic line (HTL) seen in the previous model has almost disappeared in the present model. This may be due to the distortion corrections made to the data and because of the addition of supplementary data from Site 906. In this model the conductive sediment corresponding to the Yamagata basin is very shallow compared with that of the fracture zone.
5.
Discussion
5.1 Conductive Lower Crust (CLC)
The lower continental crust is generally characterized by an enhanced conductivity, though there may be a consider-able degree of variability (Haak and Hutton, 1986; Jones, 1992; Simpson, 1998). This conductive feature is often used to explain an aseismic lower crust, and thefluid-rich seismi-cally weak layer of the CLC that has been incorporated into several geodynamic models (Schmeling and Marquart, 1990; Kaufman and Royden, 1994). The lower crust in the survey area is also seismically inactive (Hasegawaet al., 1991) in-dicating the lower crust is ductile. It is interesting how the situation is viewed through the condutivity distribution.
In Line A conductors are assumed to be limited to the upper crust if consideration is given to the trend of downward vertical striping in the models. The resistivity does not seem to decrease downward from the upper crust to the lower crust, but rather increases with depth down into the mantle to depths of at least 100 km. The crustal resistivity structure along Line A is similar to that along Line B.
Except for some conductive bodies indicated by vertical striping (Fig. 3), the 1-D models also suggest an almost ho-mogeneous resistivity distribution in the whole crust and upper mantle including the Dewa Hill (characterized by a pluton) and the Central Mountain Range. The resistivity dis-tribution actually increases with depth under the subsurface conductor KK.
In Line C the profile is generally resistive with resistivities of several hundreds ohm.m except for the two conductive bodies CB and KK. The present model indicates resistivities near 1,000 ohm.m at the Dewa Hill, west of CB, under the Central Mountain Range, and under the conductive body near the Pacific Coast. The resistivities on both sides of CB appear to be smaller at depth in comparison with the upper part. This may be, however, due to defects in the model as can be seen from thefit of the apparent resistivity curves.
The lower crust in the region can be probably summarized to be uniform over the whole crust or the lower crust may even be more resistive in the central part of the northeastern Japan arc as in the northern and southern parts (Ogawa, 1992;
Ogawa et al., 1992). By compiling previous conductivity
data, Honkura (1988) indicated that the lower crust in the northeastern Japan arc may not be regionally uniform. Our models show that the resistivity in the lower crust is in the range of several hundreds to a thousand ohm.m. This value is classified as “normal”for the lower crust by Haak and Hutton (1986).
The enhanced conductivity reported in the various tec-tonic situations is explained by the presence of saline fl u-ids, black shales and/or graphite, and partial melting (Jones, 1992; Simpson, 1998). The partial melt hypothesis (Chenet al., 1996), however, could not be applicable because there are hardly found any sesimic S-wave reflectors, which sug-gests existence offluid phase substance in the survey area (Hasegawaet al., 1998). Salinefluid is probably enhanc-ing the conductivity given the premise of an interconnected network. Thefluid could be trapped below the impermeable layer at the Conrad Discontinuity (Jones, 1987) resulting in a ductile lower crust without appreciable seismic activity.
up-Y. FUJINAWAet al.: 2-D GEORESISTIVITY STRUCTURE 1043
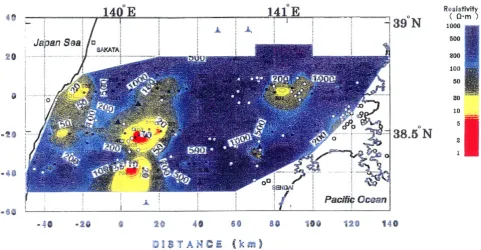
Fig. 5. Horizontal resistivity distribution at a depth of 7.5 km, within the upper crust, and is overlain by earthquake hypocenters as determined by Tohoku University’s dense seismic network and noted historical earthquakes. Solid curves attached with number F* indicate active faults (Active Fault Research Group, 1991). The solid curve with the mark F indicates active faults or lineaments (Geological Survey of Japan, 1995).
per crust in the present survey area? One very simple expla-nation could be built on the basis of the trapped water model of Jones (1987) and Hyndman (1988). The salinefluids are assumed to be insufficiently sealed in the midcrust in the case of the island arc. Yokokuraet al.(1998) provided evidence of a breakdown of the sealing in the backarc region on the basis of seismically transparent Conrad and Moho Discontinuities in those regions.
5.2 Seismicity
Figure 3 illustrates the resistivity model overlain with a vertical cross section of focal positions of earthquake hypo-centers within an east-west strip centered on each traverse and over a 20 km width. The data are from the seismic database of the Tohoku University (e.g., Hasegawaet al., 1991). In Fig. 5 are shown hypocenters of earthquakes in the upper crust with focal depths from 0 to 15 km located near the MT observation sites and with the resistivity dis-tribution of a portion of the upper crust (at a depth of 7.5 km). Historical earthquakes are indicated by star symbols (夽). Here, the horizontal resistivity distribution has been obtained through the spline interpolation of the three profiles by assuming a quasi-2-D structure. Consequently, the cor-relation between conductivity anomalies and tectonic units should be discussed to the extent of a spatial scale of the order of the distance between neighbouring sites. In Figs. 3 and 5 the pre-Tertiary tectonic lines, Tanakura (TTL), Hatagawa,
(HTL), and Morioka-Shirakawa (MSL) are included with the Quaternary Volcanic Front (VF) (see Fujinawaet al., 1997 and references therein for more detail).
Fig. 6. Hypocentral distribution of earthquakes in the lower crust between depths 15 to 30 km plotted on the modeled resistivity distribution at a depth of 22.5 km, clearly within the lower crust.
There are several isolated spots of high seismicity. We can see two moderate earthquakes occurred along the east-ern edge of the conductor corresponding to Central Basin, around Site 405 on Line B and, on Line C, near Site 904 (Fig. 5). These epicenters seem to be aligned along a line that connects the active fault F7* (Funagata Fault; Active Fault Research Group, 1991), passes west of Site 203 in the north and continues along the northern tip of another geo-logical lineament located far south of Site 706 (see Fig. 1; Geological Survey of Japan, 1995). Along this line are re-gions with very high resistivity contrasts with a conductive western block and a resistive eastern block. This line proba-bly corresponds to a boundary separating the resistive Central Mountain Range from the conductive Central Basin Range. AV p velocity anomaly (Zhaoet al., 1992b) also supports the hypothesis. The line has not been identified before on the active fault map (Active Fault Research Group, 1991) and on geological maps (Geological Survey of Japan, 1995).
Several kilometers northwest of Site 710 there is a region with concentrated seismicity, and a moderate earthquake of magnitude 5.8(夽1)occurred in 1706 nearby (Fig. 5) indi-cating an active fault. No anomalous conductivity, however, was found in our work. Moreover, there are no traces of ac-tive faults or geological lineaments reported. The region is difficult to approach for MT measurements, and there are no means to investigate the curious seismicity occurring there except an air-borne approach.
The region around Site 612 on traverse A, about 20 km south of Site 206 is very active seismically. Moderate earth-quakes of magnitude M 7.0 and M 6.9 have occurred in 1900 and 1962, respectively. The region can now be characterized as the eastern edge of the KK conductor (Fig. 3) and is on the Shirakawa-Morioka Line (Figs. 3 and 5). In short the relation between the seismicity (including micro-earthquake activity)
and electrical conductivity turned out not to be clean-cut, sug-gesting that other parameters are involved in the earthquake occurrence process, depending on the tectonic situation.
It is now generally envisioned that the lower crust is duc-tile, with good correlation between the depths to the conduc-tive lower crust and the upper crust seismic limits, as well as the brittle-ductile transition temperature (Adam, 1978; Meissner and Strehlau, 1982; Hyndman and Shearer, 1989; Stanley, 1989; Simpson, 1998). The Curie point depths in the observation zone estimated from the geomagnetic
sur-vey data (Okubo et al., 1985) are 10 ±2 km in the
sur-vey area indicating that the lower crust is in ductile condi-tion. The brittle-ductile transition depth variation revealed recently by comparison of the distribution of precisely re-located micro-earthquakes with the temperature distribution calculated from the P wave velocity in the Central Moun-tain Range is shown to be in good agreement (Hasegawa et al., 1998). The resistivity is expected to provide information useful for a better estimation of temperature than has been based on the seismic velocity data (Satoet al., 1989).
Earthquakes surrounding the Miyagi-ken-hokubu earth-quake in 1962 (夽5 in Fig. 5) in the past and recent tremors in 1981 indicate a higher conductivity in this region in compar-ison with the surrounding sites. This situates on the bound-ary between the Tertibound-ary sedimentbound-ary rock east of the Central Mountain Range and Tertiary volcanic rocks (Fig. 1). This is roughly parallel to the Sakunami-Yoshokidaira fault (F*3). It is suggested that this line is also a buried fault. The cross-ing point of this line with Line B is represented as a thin conductive region (Fig. 3).
anoma-Y. FUJINAWAet al.: 2-D GEORESISTIVITY STRUCTURE 1045
lously higher seismicity characterized by the low-frequency earthquakes can also be observed near the geothermal area around Sites 204 and 305. These sites are near the
Qua-ternary volcanoes Komagatake and Onikobe. Hasegawaet
al.(1998) indicates that these low-frequency earthquakes are related to magma activity.
6.
Conclusions
Wide-band MT observations have been conducted at 86 sites along three transects in the central part of the north-eastern Japan arc. The magnetotelluric impedance tensors were corrected for possible 3-D distortion effects including static-shifts by using TEM data. 2-D models were obtained using the GRRI inversion algorithm to refine the previously reported one. These profiles show that:
1) The 2-D resistivity models at three transects are grossly similar justifying 2-D assumptions in this region.
2) The upper crust is thought to be wet.
3) In the major fracture zones at the west and east side of the Central Basin, there is a good correlation between resistivity contrasts, faults or geological lineaments and seismicity.
4) The Central Mountain Range and Dewa Hill are char-acterized both by resistive bodies suggesting the stress gradient in the direction of subduction.
5) Active seismicity around the boundaries of the Central Basin and the Central Mountain Range may be due to a buried fault.
6) Many of the faults associated with scarce seismicity are characterized by higher resistivities.
Acknowledgments. The authors express their sincere thanks to Drs. Hiroshi Takahashi, Shigetsugu Uyehara, Gensuke Endo (late), and Prof. Sachio Nabetani for their constant encouragement. Thanks are also expressed to Profs. Nobuaki Niizuma, and Yoshi-hiro Suzuki for valuable discussions and suggestions, and to the many organizations and institutes that helped us to conduct exper-iments. We thank greatly Prof. John Weaver, Dr. Fiona Simpson and one anonymous reviewer for numerous valuable comments and helpful suggestions on the original and the revised manuscript. The preparation of the manuscript was helped by Ms. Yumiko Yamauchi and Mr. Wu Yuesheng. The Science and Technology Agency Japan funded the study for the Promotion of Surveys and Research on Earth Science and Technology and Ocean Development.
References
Active Fault Research Group (rev. ed.),Active Faults in Japan, 437 pp., University of Tokyo Press, Tokyo, 1991.
Adam, A., Geothermal effects in the formation of electrically conducting zones and temperature distribution in the earth,Phys. Earth Planet. Inter., 17, 21–28, 1978.
Calvert, A., E. W. Sawyer, W. J. Davis, and J. N. Ludden, Archean subduc-tion inferred from seismic images of a mantle structure in the Superior Province,Nature,375, 670–674, 1995.
Chen, L., J. R. Booker, A. G. Jones, N. Wu., M. J. Unsworth, W. We, and H. Tan, Electrically conductive crust in Southern Tibet from INDEPTH magnetotelluric surveying,Science,274, 1694–1696, 1996.
Fujinawa, Y., N. Kawakami, T. H. Asch, M., Uyeshima, and Y. Honkura, Studies of the Georesistivity structure in the central part of the northeast-ern Japan Arc,J. Geomag. Geoelectr.,49, 1601–1617, 1997.
Gamble, T. D., W. M. Goubau, and J. Clarke, Magnetotellurics with a remote reference,Geophysics,44, 53–68, 1979.
Geological Survey of Japan (ed.),Geological Map of Japan 1:1,000,000, 3rd Edition, CD-ROM Version, Digital Geoscience Map G-1, Geological Survey of Japan, 1995.
Groom, R. W. and R. C. Bailey, Decomposition of magnetotelluric im-pedance tensors in the presence of local three-dimensional galvanic dis-tortions,J. Geophys. Res.,94, 1913–1925, 1989.
Groom, R. W. and R. C. Bailey, Analytical investigations of the effects of near-surface three-dimensional galvanic scatters on MT tensor decompo-sition,Geophysics,56, 496–518, 1991.
Groom, R. W., R. D. Kurtz, A. G. Jones, and D. E. Boerner, A quantitative methodology to extract regional magnetotelluric impedances and deter-mine the dimension of the conductivity structure,Geophys. J. Int.,115, 1095–1118, 1993.
Haak, V. and V. R. S. Hutton, Electrical resistivity in continental lower crust, inThe Nature of the Lower Continental Crust, edited by J. B. Dawson, D. A. Carswell, J. Hall, and K. H. Wedepohl, Geol. Soc. London, Spe. Publ.,24, pp. 35–49, 1986.
Hasegawa, A., D. Zhao, S. Hori, A. Yamamoto, and S. Horiuchi, Deep structure of the northeastern Japan arc and its relationship to seismic and volcanic activity,Nature,352, 682–689, 1991.
Hasegawa, A., A. Yamamoto, N. Umino, and S. Miura, Seismic activity and deformation process of the overriding plate in the northeastern Japan subduction zone, 1999 (to be submitted).
Hasemi, A., H. Ishii, and A. Takagi, Fine structure beneath the Tohoku Dis-trict, Northeastern Japan arc, as derived by an inversion of P-wave arrival times from local earthquakes,Tectonophysics,101, 245–265, 1984. Honkura, Y., Electrical conductivity structure in the upper mantle and its
implications for the origin of magma,Kazan,2(33), 203–212, 1988 (in Japanese).
Horiuchi, S., H. Ishii, and A. Takagi, Two-dimensional depth structure of the crust beneath the Tohoku District, the northeastern Japan arc, I, Method and Conrad discontinuity,J. Phys. Earth,30, 47–69, 1982a.
Horiuchi, S., A. Yamamoto, S. Ueki, K. Tachibana, T. Kono, and A. Takagi, Two-dimensional depth structure of the crust beneath the Tohoku District, the northeastern Japan arc, 2, Moho discontinuity and P-wave velocity, J. Phys. Earth,30, 71–86, 1982b.
Hyndman, R. D., Dipping seismic reflectors, electrically conductive zones, and trapped water in the crust over a subducting plate,J. Geophys. Res., 93, 13,391–13,405, 1988.
Hyndman, R. D. and P. M. Shearer, Water in the lower continental crust: modelling magnetotelluric and seismic reflection results,Geophys. J. Int., 98, 343–365, 1989.
Jiracek, G. R., Near-surface and topographic distortions in electromagnetic induction,Surv. Geophys.,11, 163–203, 1990.
Jones, A. G., MT and reflection; and essential combination,Geophys. J. R. Astr. Soc.,89, 7–18, 1987.
Jones, A. G., Electrical conductivity of the continental lower crust, in Con-tinental Lower Crust, edited by D. M. Fountain, R. J. Arculus, and R. W. Kay, Elsevier, New York, 1992.
Kaufman, P. S. and L. H. Royden, Lower crustalflow in an extensional set-ting: Constraints from the Halloran Hills region, eastern Mojave Desert, California,J. Geophys. Res.,99, 15,723–15,739, 1994.
Kawakami, N., Y. Fujinawa, T. H. Asch, and S. Takasugi, Local three di-mensional galvanic distortions in the central part of northeastern Japan, J. Geomag. Geoelectr.,49, 1387–1400, 1997.
Kawakami N., Y. Fujinawa, J. Inoue, and T. H. Asch, Local Galvanic Dis-tortions in the Central Part of North-eastern Japan (Part 2),Earth Planets Space, 1998 (to be submitted).
Kimura, T., I. Hayami, and S. Yoshida,Geology of Japan, University of Tokyo Press, 1991.
Lee, K. H., K. Yamane, and S. Takasugi, A new 2-D inversion scheme for magnetotelluric data using a modified RRI method, inProceedings of the World Geothermal Congress, Vol. 2, pp. 915–920, 1995.
Meju, M. A., Joint inversion of TEM and distorted MT soundings, Some effective practical considerations,Geophysics,61(1), 56–65, 1996. Meissner, R. and J. Strehlau, Limits of stresses in continental crusts and
their relation to the depth frequency distribution of shallow earthquakes, Tectonics,1, 73–89, 1982.
Obara, K., A. Hasegawa, and A. Takagi, Three-dimensional P and S wave velocity structure beneath the northeastern Japan arc,J. Seismol. Soc. Japan.,39, 201–215, 1986.
Ogawa, Y., Deep crustal resistivity structure revealed by sideband magneto-tellurics-Tohoku and Hokkaido region, Ph.D. Thesis, University of Tokyo, 320 pp., 1992.
Ogawa, Y., Y. Mitsuhata, and S. Tokokura, Results of wide band magnetotel-luric transect across the northern Tohoku district-Akita-Iwaizumi-profile, inProc. 1992, Conductivity Anomaly Symposium, pp. 124–132, 1992. Okubo, Y., H. Tsu, and K. Ogawa, Curie point depths of Japan, in
Geother-mal Resources Council Transactions, 9-part II, pp. 35–39, 1985. Sato, H., I. S. Sacks, and T. Murase, The use of laboratory velocity data
for estimating temperature and partial melt fraction in the low velocity zone: comparison with heatflow and electrical conductivity studies,J. Geophys. Res.,94, 5689–5704, 1989.
Schmeling, H. and G. Marquart, A mechanism for crustal thinning without lateral extension,Geophys. Res. Lett.,17, 2417–2420, 1990.
Simpson, F., Stress and seismicity in the lower-continental rust: a challenge to simple ductility and implication for electrical conductivity mecha-nisms, inThe 14th Workshop on Electromagnetic Induction in the Earth (Abstract), pp. 215–228, 1998.
Smith, J. T. and J. R. Booker, Rapid inversion of two and three dimensional magnetotelluric data,J. Geophys. Res.,96, 3905–3922, 1991.
Spies, B. R. and D. E., Eggers, The use and misuse of apparent resistivity in electromagnetic methods,Geophysics,51(7), 1462–1471, 1986. Stanley, W. D., Comparison of geoelectrical/tectonic models for suture zones
in the western U.S.A. and eastern Europe: are black shales a possible source of high conductivities?,Phys. Earth Planet. Inter.,53, 228–238,
1989.
Sternberg, B. K., J. C. Washburne, and L. Pellerin, Correction for the static shift in magnetotelluric using transient electromagnetic soundings, Geo-physics,53, 1459–1468, 1988.
Tournerie, B. and M. Chouteau, Deep conductivity structure in Abitibi, Canada, using long dipole magnetotelluric measurements,Geophys. Res. Lett.,25, 2327–2320, 1998.
Umino. N. and A. Hasegawa, On the two-layered structure of a deep seismic plane in the northeastern Japan arc,J. Seismol. Soc. Japan.,28, 125–139, 1975.
Yamane, K., S. Takasugi, and K. H. Lee, A new magnetotelluric inversion scheme using generalized RRI method and case studies,Geophysics,35, 209–213, 1996.
Yokokura, T., T. Miyazaki, Y. Watanabe, and T. Urabe, A preliminary exper-iment towards deep seismic profiling GSJ90-1 Hidaka, Hokkaido,Zisin, 2(45), 145–156, 1992.
Yokokura, T., T. Miyazaki, N. Kano, and K. Yamaguchi, Lower crustal and sub-crustal reflectors beneath the southern Kit akami area, in1998 Japan Earth and Planetary Science Joint Meeting(Abstract), p. 363, 1998. Zhao, D., S. Horiuchi, and A. Hasegawa, Seismic velocity structure of the
crust beneath the Japan islands,Tectonophysics,212, 289–301, 1992a. Zhao, D., A. Hasegawa, and S. Horiuchi, Tomographic imaging of P and
W wave velocity structure beneath Northeastern Japan,J. Geophys. Res., 97, 19,909–19,928, 1992b.

![Fig. 4(a). Calculated model response (. . .), and observed data of the TM mode ( ] ) used in the 2-D inversions at the three transects (A, B, C)](https://thumb-us.123doks.com/thumbv2/123dok_us/887430.1106676/6.595.60.547.79.730/fig-calculated-model-response-observed-data-inversions-transects.webp)