P R O C E E D I N G S
Open Access
Analysis of baseline, average, and longitudinally
measured blood pressure data using linear mixed
models
Ahmed Hossain, Joseph Beyene
*From
Genetic Analysis Workshop 18
Stevenson, WA, USA. 13-17 October 2012
Abstract
This article compares baseline, average, and longitudinal data analysis methods for identifying genetic variants in genome-wide association study using the Genetic Analysis Workshop 18 data. We apply methods that include (a) linear mixed models with baseline measures, (b) random intercept linear mixed models with mean measures outcome, and (c) random intercept linear mixed models with longitudinal measurements. In the linear mixed models, covariates are included as fixed effects, whereas relatedness among individuals is incorporated as the variance-covariance structure of the random effect for the individuals. The overall strategy of applying linear mixed models decorrelate the data is based on Aulchenkoet al.’s GRAMMAR. By analyzing systolic and diastolic blood pressure, which are used separately as outcomes, we compare the 3 methods in identifying a known genetic variant that is associated with blood pressure from chromosome 3 and simulated phenotype data. We also analyze the real phenotype data to illustrate the methods. We conclude that the linear mixed model with longitudinal measurements of diastolic blood pressure is the most accurate at identifying the known single-nucleotide polymorphism among the methods, but linear mixed models with baseline measures perform best with systolic blood pressure as the outcome.
Background
Hypertension is a major morbidity and mortality risk fac-tor for stroke, myocardial infarction, heart failure, and end-stage renal disease [1]. It is a multifactorial disorder resulting from inheritance of several susceptibility genes, as well as multiple environmental determinants, includ-ing weight control, dietary intake, physical activity, and alcohol consumption [2]. To date, several variants have been identified by genome-wide association studies (GWAS) as being associated with blood pressure and hypertension [1,3,4]. Various statistical, data mining, and machine learning strategies have shown some promise for identifying genetic variants, but are not scalable to large-scale GWAS [5,6]. Linear mixed models (LMMs) are widely used in controlling for phenotypes and relat-edness within GWAS [7]. In the application of LMMs for
GWAS data the covariates are included as fixed effects, whereas kinship among individuals is incorporated as a variance-covariance structure of the random effect for the individuals. We followed Aulchenkoet al’s[8] resi-dual approach, which is based on a 2-step strategy in the application of the LMM. The first step optimizes a reduced LMM with the genetic marker effect excluded. In the second step, the residual from the reduced LMM is fitted as the dependent variable to test each marker in a linear model.
We give an overview of 3 LMMs for the analysis of Genetic Analysis Workshop 18 (GAW18) data, paying attention to the power of selecting an associated single-nucleotide polymorphism (SNP) from chromosome 3 and simulated phenotype data. In particular, we apply 3 types of LMMs for statistical analysis of baseline measurements, mean measurements, and longitudinal data. We compare the LMMs through simulations and illustrate them using the real phenotype data.
* Correspondence: [email protected]
Department of Clinical Epidemiology and Biostatistics, McMaster University, 1280 Main Street West, Hamilton, Ontario L8S4K1, Canada
Methods
Data and quality control
We use 3 models to analyze the GWAS data set from chromosome 3 of the GAW18: a Diabetes-GENES Pro-ject, which consists of whole genome sequence data in a pedigree-based sample, longitudinal phenotype data for hypertension and related traits, and selected covariates. In this GWAS data, 65,519 SNPs have been genotyped for chromosome 3. In the simulated phenotype data, 849 subjects were measured at 3 time points for age, medication use, smoking status, and blood pressure. As is standard practice, SNPs with minor allele frequency (MAF) <1% were excluded from data analysis. We also filtered out SNPs with low call rates (<90%) and devia-tion from Hardy-Weinberg equilibrium (pvalue≤1e−6). The quality controls were implemented using the R package SNPassoc [9]. In addition, we excluded 4 indivi-duals because more than half of their SNP values were missing. After filtering, a total of 27,313 SNPs and 845 samples met our quality-control criteria and were used for analysis. The family relationships among these indi-viduals were copied from the pedigree on the real data.
Statistical analysis to evaluate the effect of SNPs
We consider 3 LMMs to evaluate the effect of SNPs on systolic blood pressure (SBP) and diastolic blood pres-sure (DBP) separately.
Model 1: GRAMMAR approach for baseline measures analysis
Aulchenko et al. [8] proposed a genome-wide rapid association using mixed model and regression (GRAM-MAR) to assess significance of the effect of a poly-morphism. The method first obtains residuals adjusted for family effects and then analyzes the association between these residuals and genetic polymorphisms using least-squares methods. The model is expressed as follows:
Initial model. The initial model isyij=β0+
k
βkxijk+G+eij,
whereyijis the value of phenotype corresponding to the
jthindividual in the ithpedigree,xijkis the value of the
kthcovariate or fixed effect,βkis an estimate of thekth
fixed effect or covariate, and eijis the vector of residual effects. Gis the random polygenic effect that follows a multivariate normal distribution with mean 0 and var-ianceσ2G,whereis the relationship matrix (kinship
matrix) andσ2Gthe additive genetic variance as a result
of polygenes. The vector of estimated residuals is given
byy∗=y−(βˆ0+
k
ˆ
βkxijk+Gˆ) =eˆ.
SNP model. The residuals are used as the dependent trait in a simple linear regression for each SNP, ˆ
e=α∗+γ1SNP1+ε, whereγ1is the coefficient of thelth
SNP from the model 1 scenario. The method adjusts for familial relationship and is computationally fast, but the model only considers the time 1 information from the GAW18 data. The first stage model is implemented using the polygenic() function of the R package GenA-BEL, and the kinship matrix is estimated using the R package kinship2. Next, the lm() function is used for fit-ting the linear model with residuals obtained from the first-stage model.
Model 2: Two-stage LMM for mean measured outcome analysis
We considered the measurement of the mean across the 3 time points as the outcome and followed the 2-stage approach. The model formula for the first stage is ¯
yij=β0+
k
βkxijk+G+eij, where y¯ijdenotes the mean
phenotype across the time points for the jthindividual in the ith pedigree. βis the coefficient for unknown fixed effects representing nongenetic effects (mean age across time points, sex, smoking status at time 1, and medication use at time 1), and Gis the random poly-genic effect that follows a multivariate normal distribu-tion with mean 0 and variance 2KσG2,where Kis the kinship matrix with elementskij(j= 1, 2,. . .,ni) calcu-lated from pedigrees, andσG2is an unknown genetic var-iance; e is a vector of random residual effects that are normally distributed with zero mean and variance-cov-ariance R=Iσe2,where I is the identity matrix andσe2is the unknown residual variance.
In the second stage we consider the residuals as the outcome and fit the linear model, ˆe=β∗+γ2SNP1+ε,
where γ2 is the coefficient of the lth SNP from the
model 2 scenario. We implemented the model using the R package kinship (R 2.10.1). The lmekin() function is used to obtain the residuals from the first-stage model.
Model 3: Two-stage LMM for longitudinal analysis We also evaluate a 2-stage LMM that takes longitudinal measurements into account. We consider 2 models, without and with time effects, in the application of the longitudinal analysis. In the first stage, we fit a random intercept LMM as follows:
(A)yijt=β0+
k
βkxijtk+G+eijt(1)
Next, we extend the first-stage model allowing time points:
(B)yijt=β0+
k
βkxijtk+vzt+G+eijt(2)
whereyijtdenotes the phenotype (SBP or DBP) for the
the random polygenic effect as in model 2;eis a vector of random residual effects that are normally distributed with zero mean and covarianceR0=Iσe20, andσ
2
e0is the unknown residual variance. Then we consider the mean of the residuals across the time points as the outcome and fit the model e¯=β∗∗+γ3SNPl+εwhere e¯ is the
vector of mean residuals across the time points andγ3is
the coefficient of thelth SNP from the model 3 scenario. We applied the model using the R packages pedi-greemm and kinship.
Results
Simulated data analysis
We investigated the performance of the 3 LMMs for selecting a known associated SNP from simulation stu-dies. The 3 models are employed after adjusting for cov-ariates and pedigree information, and the pvalues for each SNP are used to rank the SNPs.
The simulated phenotype data in GAW18 has 10 known SNPs from chromosome 3 that are associated
with blood pressure. Among these SNPs, 2 have MAF >0.05. These 2 variants are rs6442089 (gene symbol:
MAP4, position: 47956424, and MAF: 0.367) and
rs1131356 (gene symbol:FLNB, position: 58109162, and MAF: 0.488). We investigated the 3 LMMs in terms of selection performances of rs6442089. We selected rs6442089 because it is a well-known SNP from the geneMAP4that affects blood pressure.
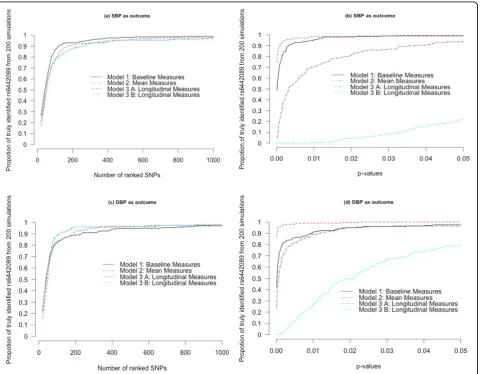
We denote a SNP to be significant either if itspvalue is smaller than a cutoff value or if it belongs to a target number of ranked SNPs. For example, if our target num-ber of selected SNPs is 200, then a SNP will be called truly identified from a simulated phenotype data if its rank belongs to the top 200. Alternatively, if our target cutpoint forpvalue is 0.001, then a SNP will be called truly identified if thepvalue of the SNP is found to be less than 0.001. The proportion is estimated by counting how many times from the 200 simulations the SNP (rs6442089) was in the list of target SNPs or within the
pvalue cutpoint. Figure 1 lists the proportions for the 3
methods. Figure 1A indicates that the GRAMMAR pro-cedure with the baseline measures is more effective than any of the other methods in selecting the SNPs consider-ing SBP as outcome. But we found that the GRAMMAR procedure was not effective with baseline DBP measures among the models (Figure 1C). As seen in Figures 1Band D, LMM with mean measures outcome has greater power to detect the genetic variant considering a cut-point ofpvalues. It appears from the figures that apply-ing LMM to longitudinal DBP data provides better results in selecting the SNP compared to any of the other methods. We found similar results by both Model 3(A) and Model 3(B). That is, the results from Model 3(A) and Model 3(B) do not look qualitatively different from each other: In both cases, the performance of selecting the SNP is lower in SBP and higher in DBP.
Application to real data
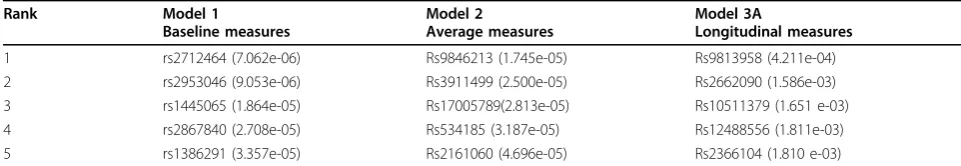
We employed the 3 LMMs to real phenotype SBP data after adjusting for covariates and we rank the SNPs using the pvalues for each SNP. We considered first 3 time points to avoid the missing values of the fourth time point, and we applied the 3 models to the same 845 individuals who were selected in the simulated data analysis. We report 5 top-ranked SNPs in Table 1. It can be seen that thepvalues from the LMM with longi-tudinal measurements are conservative compared to other methods. After investigation of the top 20 SNPs we found 3 SNPs in common across the models. The ranks for the known SNP, rs6442089, are 4376, 3105, and 758 by the LMMs with baseline, longitudinal (Model 3A), and mean measures outcome, respectively. Therefore, the real phenotype data suggest that the LMM with mean measurements performs best among the 3 methods for identifying the SNP rs6442089.
Discussion
In this article we applied 3 LMMs to the study of GAW18 in family data and in settings of relevance to baseline measures, mean measures, and longitudinally measured data. The statistical analysis of GWAS for GAW18 data using LMMs with longitudinal DBP mea-surements is capable of revealing the dynamic pattern of
genetic control over chromosome 3 but did not perform competitively with other models for longitudinal SBP measurements. Exploratory/graphical analysis for the trajectories of SBP and DBP measurements also sup-ported the conclusion that DBP had more subject-speci-fic variability in slopes than SBP. However, the GRAMMAR approach with single-measure SBP data at baseline can be used on the development of SNP selection.
A general consideration applicable to all the methods discussed here concerns the issue of whether the out-come is linear or nonlinear. An alternative approach could be to relax the conditions imposed on linear mod-els and explore the hidden structure by using a varying coefficient model [10]. Consequently, it will be interest-ing to apply another method assuminterest-ing the effects of SNPs are smooth functions of time.
Conclusion
We showed that a linear mixed modeling framework was most accurate at identifying known single-nucleotide polymorphism compared to other competing methods we considered in this manuscript for the analysis of long-itudinal measurements of diastolic blood pressure. In contrast, baseline measures performed best with systolic blood pressure highlighting that, depending on the trajec-tory profile of the quantitative trait of interest, either just baseline values or serially measured values can be useful in genetic association studies.
Competing interests
The authors declare that they have no competing interests.
Authors’contributions
AH designed the overall study, performed all of the data analysis and drafted the manuscript. JB assisted in conceiving the idea, helped in drafting the manuscript and provided overall supervision. Both authors read and approved the final manuscript.
Acknowledgements
AH acknowledges post-doctoral fellowship funding from the Drug Safety and Effectiveness Cross-Disciplinary Training (DSECT) Program. JB would like to acknowledge Discovery Grant funding from the Natural Sciences and Engineering Research Council of Canada (NSERC) (grant number 293295-2009) and Canadian Institutes of Health Research (CIHR) (grant number 84392). JB holds the John D. Cameron Endowed Chair in the Genetic
Table 1 Top 5 SNPs by the 3 LMMs considering the outcome SBP
Rank Model 1
1 rs2712464 (7.062e-06) Rs9846213 (1.745e-05) Rs9813958 (4.211e-04) 2 rs2953046 (9.053e-06) Rs3911499 (2.500e-05) Rs2662090 (1.586e-03) 3 rs1445065 (1.864e-05) Rs17005789(2.813e-05) Rs10511379 (1.651 e-03) 4 rs2867840 (2.708e-05) Rs534185 (3.187e-05) Rs12488556 (1.811e-03) 5 rs1386291 (3.357e-05) Rs2161060 (4.696e-05) Rs2366104 (1.810 e-03)
Determinants of Chronic Diseases, Department of Clinical Epidemiology and Biostatistics, McMaster University. The GAW18 whole genome sequence data were provided by the T2D-GENES Consortium, which is supported by NIH grants U01 DK085524, U01 DK085584, U01 DK085501, U01 DK085526, and U01 DK085545. The other genetic and phenotypic data for GAW18 were provided by the San Antonio Family Heart Study and San Antonio Family Diabetes/Gallbladder Study, which are supported by NIH grants P01 HL045222, R01 DK047482, and R01 DK053889. The Genetic Analysis Workshop is supported by NIH grant R01 GM031575. We would like to thank two anonymous reviewers and the editor for insightful comments that improved the presentation and clarity of our manuscript.
This article has been published as part ofBMC ProceedingsVolume 8 Supplement 1, 2014: Genetic Analysis Workshop 18. The full contents of the supplement are available online at http://www.biomedcentral.com/bmcproc/ supplements/8/S1. Publication charges for this supplement were funded by the Texas Biomedical Research Institute.
Published: 17 June 2014
References
1. Lu J, Li M, Zhang R, Hu C, Wang C, Jiang F, Yu W, Qin W, Tang S, Jia W:A common genetic variant of FCN3/CD164L2 is associated with essential hypertension in a Chinese population.Clin Exp Hypertens2012,
34:377-382.
2. Carnethon MR, Evans NS, Church TS, Lewis CE, Schreiner PJ, Jacobs DR Jr, Sternfeld B, Sidney S:Joint associations of physical activity and aerobic fitness on the development of incident hypertension: coronary artery risk development in young adults.Hypertension2010,56:49-55. 3. Levy D, Ehret GB, Rice K, Verwoert GC, Launer LJ, Dehghan A, Glazer NL,
Morrison AC, Johnson AD, Aspelund T,et al:Genome-wide association study of blood pressure and hypertension.Nat Genet2009,41:677-687. 4. Tabara Y, Kohara K, Kita Y, Hirawa N, Katsuya T, Ohkubo T, Hiura Y, Tajima A,
Morisaki T, Miyata T,et al:Common variants in the ATP2B1 gene are associated with susceptibility to hypertension: the Japanese Millennium Genome Project.Hypertension2010,56:973-980.
5. Lucek PR, Ott J:Neural network analysis of complex traits.Genet Epidemiol 1997,14:1101-1106.
6. Hoh J, Wille A, Ott J:Trimming, weighting, and grouping SNPs in human case control association studies.Genome Res2001,11:2115-2119. 7. Zhang Z, Ersoz E, Lai CQ, Todhunter RJ, Tiwari HK, Gore MA, Bradbury PJ,
Yu J, Arnett DK, Ordovas JM,et al:Mixed linear model approach adapted for genome-wide association studies.Nat Genet2010,42:355-360. 8. Aulchenko YS, de Koning DJ, Haley C:Genome wide rapid association
using mixed model and regression: a fast and simple method for genomewide pedigree-based quantitative trait loci association analysis.
Genetics2007,177:577-585.
9. González JR, Armengol L, Solé X, Guinó E, Mercader JM, Estivill X, Moreno V:
SNPassoc: an R package to perform whole genome association studies.
Bioinformatics2007,23:654-655.
10. Fan J, Zhang JT:Functional linear model for longitudinal data.J R Stat
Soc Series B Stat Methodol2000,55:757-796.
doi:10.1186/1753-6561-8-S1-S80
Cite this article as:Hossain and Beyene:Analysis of baseline, average, and longitudinally measured blood pressure data using linear mixed
models.BMC Proceedings20148(Suppl 1):S80.
Submit your next manuscript to BioMed Central and take full advantage of:
• Convenient online submission
• Thorough peer review
• No space constraints or color figure charges
• Immediate publication on acceptance
• Inclusion in PubMed, CAS, Scopus and Google Scholar
• Research which is freely available for redistribution