P R O C E E D I N G S
Open Access
Confidence set of putative quantitative trait loci
in whole genome scans with application to the
Genetic Analysis Workshop 17 simulated data
Charalampos Papachristou
From
Genetic Analysis Workshop 17
Boston, MA, USA. 13-16 October 2010
Abstract
As genetic maps become more highly dense, the ability to sufficiently localize putative disease loci becomes an achievable goal. This has prompted an increased interest in methods for constructing confidence intervals for the location of variants that contribute to a trait. Such intervals are important because, by reducing the number of candidate loci, they can help in the design of cost-effective and time-efficient follow-up studies. We introduce a new approach that can be used in whole-genome scans to obtain a confidence set of loci that contribute at least a predetermined percentagehto the overall genetic variation of a quantitative phenotype. The method is developed in the framework of generalized linear mixed models and can accommodate families of arbitrary size and structure. We apply our method to the Genetic Analysis Workshop 17 simulated data where we scan chromosomes 6, 15, 20, 21, and 22 to uncover loci regulating the simulated phenotype Q2. For the analyses we had prior knowledge of the simulation model used to generate the phenotype.
Background
Technological advances have provided us with highly dense genetic maps of single-nucleotide polymorphisms (SNPs) covering the whole genome. Based on these maps and using a variety of statistical methods, scientists nowa-days routinely scan the human genome in search of loci that either contribute to the variability of quantitative phenotypes or predispose individuals to develop binary traits. Currently used approaches have been particularly successful in identifying mutations in genes that cause relatively rare hereditary diseases. However, the search for susceptibility genes for common diseases has proved to be more challenging. It is widely accepted that such complex traits are influenced by many loci, each having only a small contribution to the phenotype. Naturally, the detection of these genes is difficult. Furthermore, investigators must adjust for multiplicity of the large number of markers simultaneously tested. This is not a
trivial task considering the complex dependencies in genetic data. As such, most genome-wide association stu-dies suffer from low power and often point to large geno-mic regions. Identifying the genes in these regions and locating those associated with the trait of interest can be both time-consuming and expensive. Hence there is an increased interest in methods that can significantly reduce the number of candidate genes identified but that have sufficient power, in the preliminary scan, to aid in the design of more cost-effective and time-efficient follow-up studies.
We propose a new confidence set inference (CSI) method that is motivated by the fact that, because the new genetic maps are highly dense, it is expected that many SNPs will not only reside within disease genes but also may be the causative variants themselves. Our approach can be used in preliminary genome association studies to obtain a confidence set (CS) of quantitative trait loci (QTLs) contributingat leasta predetermined percentage hto the overall genetic variation of a quantitative pheno-type. The method is developed in the framework of linear mixed models (LMMs) and can accommodate families of
Correspondence: [email protected]
Department of Mathematics, Physics, and Statistics, University of the Sciences, 600 S. 43rd Street, Philadelphia, PA 19104, USA
arbitrary size and structure. Furthermore, the approach provides a flexible framework that allows one to search for loci that have at least a specific level of contribution to the quantitative trait. As such, it gives us the ability to set the bar higher or lower depending on the amount of data available.
Methods
Hypotheses and test statistic
In traditional family-based association mapping the null hypothesis is that there is no association, whereas the alternative is that there is association. In our formula-tion we are actually reversing these two hypotheses. For each SNP on the map, our null hypothesis is that the locus is a QTL contributing at least a certain percentage of the total genetic variance (sGT)
2
of the quantitative phenotype, whereas the alternative is that the locus con-tributes to the trait less than the prespecified level (or nothing at all). More specifically, we assume that there is a dense SNP map consisting ofSmarkers that poten-tially harbor some QTLs which contribute to the pheno-type of interest. Then, for each SNPs (s= 1, …, S) we test the following hypotheses:
H0s :sG2s ≥hsG2T vs. Has:sG2s <hsG2T, (1)
where sG
s
2 is the genetic variance attributed to SNP s
and h is a number between 0 and 1 and is chosen in advance. It follows that the set of markers for which the null hypothesis in Eq. (1) is not rejected at levela con-stitutes a (1−a) × 100% confidence set of loci contri-buting at leasth× 100% to the total genetic variance of the phenotype.
Note that because of the reversal of the traditional null and alternative hypotheses, the type I error and power of our method are also the reversals of the tradi-tional ones. To avoid any confusion, in the rest of this paper we use the term true positiveto refer to any SNP that is included in the confidence set and is a trait-regu-lating locus. Similarly, we use the termfalse positiveto denote any SNP that is included in the confidence set and does not contribute to the trait.
We briefly describe how we test the hypotheses in Eq. (1). Consider a pedigree of arbitrary structure consist-ing ofnmembers. Lety = (y1, …,yn) be the vector of family phenotypic values of the trait of interest. We assume that for each personithe value of his/her pheno-type is governed by a major locusτ. Furthermore, the trait value is also influenced (potentially) by some known cov-ariatesXi(e.g., age and sex), which includes a constant of 1 to signify the overall effect. In addition, there is some environmental effect or residual, denotedei. Finally, we assume that the phenotype is affected by a number of other loci whose collective (random) polygenic effect on
the trait is denotedui. Now, assuming additivity across all effects, the overall phenotypic value of a person is:
yi =bXi+gzt +ui+ei, (2)
where bis a vector of unknown coefficients,g is the coefficient of the effect of the major locus, andzτis the number of copies of the disease allele at the major trait locus carried by the individual. We assume that the vec-tor of random polygenic effectsu= (u1,…, un) follows a multivariate normal distribution with mean 0 and covar-iance matrixΩ, that theeiare independent and identi-cally distributed from a normal distribution, also with mean 0 and variance se2, and that the two random
effects are independent of each other and the covariates. Under these assumptions, the joint distribution of theyi is simply a multivariate normal distribution with mean equal tobX+gzτand variance covariance matrix:
Vy = Ω +se2I, (3)
where XT = (X1, …, Xn) and I is the n × n identity matrix.
If the dominance genetic variance is negligible and there is minimal or no inbreeding in the family, then the matrixΩis approximately equal to:
Ω =2Φsa2
p, (4)
where F is a known matrix whose elements are the kinship coefficients between the family members and
sap 2
is the additive polygenic variance [1,2]. If we further assume that the major trait locus τis diallelic with minor allele frequencypτ, then we can show that the coefficientgin Eq. (2) must satisfy:
g st
where sa2t is the additive genetic variance due to the
major locus τ and pτ is the frequency of the disease allele. Using this fact, we can see that the hypotheses in Eq. (1) are equivalent to:
′ ≥
where sa2 is the total additive genetic variance of the
quantitative trait, ps is the frequency of the minor allele of the SNPs, andgsis the same coefficient as in Eq. (2) when sis the major trait locus. The statistic for testing the above hypotheses is given by:
where gs and SD( )gs are the maximum-likelihood
estimate ofgsand its standard deviation, respectively, obtained by maximizing the multivariate normal likeli-hood that corresponds to the LMM in Eq. (2). It is easily seen that the (asymptotic) distribution of the test statistic is a standard normal distribution. Thus we can easily find an appropriate threshold for testing the hypotheses in Eq. (6) at any significance levela.
Finally, the last piece of information we need to per-form the hypothesis test is the value of the overall total additive genetic variance of the phenotype sa2. This can
be readily estimated from the data themselves, usually with good accuracy, by maximizing a similar likelihood as in Eq. (2) but without any major gene effects [1,2].
The construction of the confidence set of SNPs that contribute at least a specific proportionhto the total genetic variance of a quantitative trait is achieved as fol-lows. First, we obtain an estimate sˆa2 of the overall genetic variance by fitting the model in Eq. (2) without any effects of major genes, that is, without the parameter
g. Next, for each SNPs, we obtain the maximum-likeli-hood estimate ofgsand its standard deviation, gˆs and
SD( )gs , respectively, by maximizing the likelihood in Eq. (2). Then, for each SNPs, we useh, sˆa2, gˆs, and SD( )gs
to compute the test statisticts. Finally, a (1−a) × 100% confidence set of loci contributing at leasth× 100% to the total genetic variance of the phenotype confidence set is formed by aggregating all those SNPs for which |ts| >za, wherezais the upperath percentile of the standard normal.
Results
We used the family simulated data sets from Genetic Analysis Workshop 17 (GAW17) [3] in an attempt to localize loci that are related to the simulated quantita-tive phenotype Q2. Under the simulation model, 72 SNPs contribute to the levels of the quantitative pheno-type. Because of time limits, we chose to analyze chro-mosomes 6, 15, 20, 21, and 22 for all 200 replicates provided in the simulated data. We selected chromo-some 6 because it houses nine SNPs that contribute to the phenotype, and thus it can help us gauge the ability of our method to identify loci contributing to the trait. Chromosomes 15, 20, 21, and 22 harbor no loci regulat-ing the trait, and they are used to study the false discov-ery rate (FDR) of the method. We preprocessed the data and excluded from the analysis SNPs with a minor allele count less than 28 copies in the entire data set (roughly minor allele frequencies [MAFs] of 4%, 2%, 1.5%, and 1% for the single, double, triple, and quadruple data set, respectively) in order to avoid potential problems with unstable estimates of the model parameters in Eq. (2) for SNPs with rare minor alleles. Because we analyzed only the simulated data, we did not consider any
filtering criterion that was based on the genotyping rate, calling rate, or Hardy-Weinberg equilibrium. After pre-processing the data, we were left with 351 SNPs on chromosome 6, 189 SNPs on chromosome 15, 137 SNPs on chromosome 20, 51 SNPs on chromosome 21, and 99 SNPs on chromosome 22. Furthermore, only three causative SNPs (C6S5380 on the VNN1gene and C6S5426 and C6S5441 on theVNN3gene) remained on the reduced map out of the nine SNPs that reside on chromosome 6.
Each of the 200 replicates of the family data consists of genotypes and phenotypes on 697 individuals forming 8 extended pedigrees with the number of members ranging from 73 to 128. This sample size may not be sufficient to provide enough power for our method to significantly localize the loci that contribute to the trait. Thus we decided to artificially increase the sample size by combin-ing data from 2, 3, or 4 consecutive replicates to create 100, 66, and 50 new replicates of samples with 1,394, 2,091, and 2,788 individuals, respectively. Note that the replicates are not completely independent because they share the same genotypes. This could potentially affect the performance of the method. However, the indepen-dence of the phenotypes should help to moderate the effect of the common genotypes.
Using our method and these new data sets as well as the original 200 replicates, we constructed 95% confi-dence sets for loci that contribute a specific percentageh to the overall additive genetic variance. The model we used to analyze the data assumed only the additive genetic variance component and only one covariate, the overall mean level of Q2. Even though additional covari-ates, such as age, sex, and smoking status, were available, a small preliminary analysis on several replicates showed that none of the covariates were statistically significant. Hence we opted to avoid including them in this particu-lar study to ease the computational burden. Finally, even though the family sizes were significantly large, 75 to 128 individuals per family, our method was able to handle all the pedigrees as a whole without splitting them into smaller units.
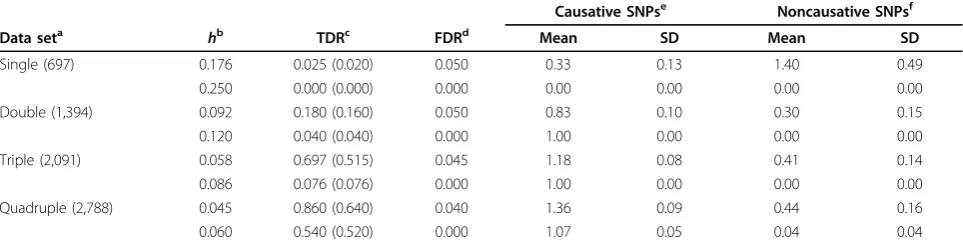
present the results for two different thresholds ofh. The first threshold corresponds to the smallest level for which the method yielded an FDR as close to 0.05 as possible, without exceeding it; the second threshold is the mini-mum threshold for which the method yielded zero FDR. For instance, for the triple data set (2,091 individuals) we chose the thresholds 0.058 and 0.086 because 0.058 resulted in confidence sets that had no functional SNPs in 3 out of the 66 replicates (FDR of 0.045) and because 0.086 resulted in confidence sets that had only causative loci.
As expected, a sample size of 697 (single) or 1,394 (double) was not enough for our method to be able to distinguish between causative and noncausative SNPs. To bring the FDR to zero levels, we had to sethto 0.25 for the single replicate and 0.12 for the double replicate. These high thresholds, though, caused the TDR to become almost zero.
However, when the sample size was tripled to 2,091 people, the advantages of our method started to unfold. Anhof 0.058 was sufficient to hold the FDR to accepta-ble levels (less than 5%). At this threshold level, we were able to identify at least one QTL in chromosome 6 in 46 out of the 66 replicates, a TDR of almost 70%. In fact, in 34 of the replicates (51.5%) the 95% confidence set included only causative SNPs. On average, we were able to identify 1.18 causative SNPs, and the confidence set included on average 0.41 noncausative SNP, thereby demonstrating the ability of the method to target only loci that contribute to the trait. When we increased the thresholdhto 0.076, the FDR of the method dropped to zero, but the TDR was also significantly reduced to roughly 8% (5 replicates out of 66). Not surprisingly, all
five of these replicates resulted in confidence sets that included only causative SNPs.
A further increase in the sample size to 2,788 indivi-duals (quadruple set) resulted in a significant increase in the observed TDR of the method. To reduce the FDR to close to 5%, the threshold forhneeded to be 0.045, and to reduce FDR to 0,hhad to be 0.060, which resulted in TDRs of 86% (43/50) and 54% (27/50), respectively. Again, most of the replicates (32 for the 0.045 threshold and 26 for the 0.060 threshold) yielded 95% confidence sets that included only causative SNPs.
Finally, the confidence sets included on average less than 0.5 nonfunctional SNP. Note that a large number of these false-positive SNPs came from chromosome 6, especially for the smaller sample sizes (single and double sets). A closer investigation revealed that these were usually SNPs that were in high linkage disequilibrium with the causative SNPs residing on chromosome 6. Nevertheless, as the sample size increased, our method was able to distinguish the causative SNPs from those in high linkage disequilibrium with them, thereby demon-strating a significant ability to localize causative loci. For example, for the quadruple data set with a threshold of 0.06, the CSI method identified causative SNPs in only 26 out of the 50 replicates (52%).
Discussion and conclusions
We have presented a CSI method for obtaining a set of SNPs that contribute at least a prespecified percentageh to the total additive variance of a quantitative trait. Our method provides a flexible tool that can be used in preli-minary whole-genome association scans to significantly reduce the number of candidate genes that need to be
Table 1 Analysis results for the 95% confidence sets of loci contributing to the quantitative phenotype Q2
Causative SNPse Noncausative SNPsf
Data seta hb TDRc FDRd Mean SD Mean SD
Single (697) 0.176 0.025 (0.020) 0.050 0.33 0.13 1.40 0.49
0.250 0.000 (0.000) 0.000 0.00 0.00 0.00 0.00
Double (1,394) 0.092 0.180 (0.160) 0.050 0.83 0.10 0.30 0.15
0.120 0.040 (0.040) 0.000 1.00 0.00 0.00 0.00
Triple (2,091) 0.058 0.697 (0.515) 0.045 1.18 0.08 0.41 0.14
0.086 0.076 (0.076) 0.000 1.00 0.00 0.00 0.00
Quadruple (2,788) 0.045 0.860 (0.640) 0.040 1.36 0.09 0.44 0.16
0.060 0.540 (0.520) 0.000 1.07 0.05 0.04 0.04
The results are based on 200 single, 100 double, 66 triple, and 50 quadruple replicates.
a
Number of original replicates combined to form the new data set to be analyzed. The number in parentheses corresponds to the number of individuals in the sample.
b
Threshold for contribution of a putative locus to the total additive genetic variance.
c
Proportion of replicates for which the resulting 95% confidence set includes at least one trait locus. Numbers in parentheses give the proportion of replicates for which the resulting confidence sets include only trait loci.
d
Proportion of replicates for which the resulting 95% confidence set includes only noncausative SNPs.
e
Observed mean and standard deviation (SD) of the number of causative SNPs included in the resulting 95% confidence sets per replicate.
f
followed up, thereby making subsequent studies more time- and cost-efficient. The key idea of our method lies in the reversal of the traditional null and alternative hypotheses of association versus nonassociation. The main advantage of reversing the traditional hypotheses is that it enables researchers to target genes with a specific contribution to the genetic variance of a trait and at the same time to choose the confidence level needed to iden-tify at least one such gene, if it exists. Having the ability to control this confidence level is particularly useful in preliminary studies. Such studies aim to reduce the num-ber of SNPs that will be carried over to the second stage of the analysis and strive to ensure, with high confidence, that enough causative loci will also be carried over. Thus our method is particularly suitable for preliminary scans involving a large number of SNPs that densely cover the entire genome.
Further advantages of our method include the ability to handle families of arbitrary size and structure and the abil-ity to incorporate into the analysis information on perti-nent variables that may have an effect on the quantitative phenotype. Finally, our method is expected to be robust with respect to population stratification because it uses data from extended families, and family-based association tests tend to be robust with respect to population stratifi-cation [4]. Applistratifi-cation of our method to the GAW17 simulated data demonstrates that our method has the abil-ity to significantly localize putative quantitative trait loci with high accuracy, down to within two SNPs, provided that there is a sufficient amount of data (at least 2,000 individuals), while maintaining a low false-positive rate.
Implementation of our method requires knowledge of the overall additive genetic variance of the trait and the allele frequencies of the SNPs. This information can be readily obtained from the data themselves, usually with high accuracy, depending on the sample size. An impor-tant tuning parameter in the implementation of our method is the choice of the thresholdhof the contribution of the putative trait loci to the overall additive genetic var-iance. This levelhneeds to be selected in advance, but its value should depend on the amount of data available for the study. Small sample sizes will require higher values of hto warrant a low FDR, whereas larger sample sizes, in practice more than 2,000 people, may allow for the identifi-cation of loci with a contribution as low as 5% to the total additive genetic variance. In principle, one could use a bootstrap approach to obtain thresholds tailored to the particular data used. However, for whole-genome scans involving a large number of individuals, the computational burden associated with bootstrap methods may render such an approach infeasible. In such a case, one may limit the number of SNPs to be followed up by adopting the fol-lowing practical approach: Using our method, researchers can obtain 95% upper confidence limits for the
contribution of each SNP to the total additive variance of the trait. Then, they can rank the loci according to these upper bounds and select the top loci for further study.
The current formulation assumes additivity across the different loci that regulate the trait and within the locus of interest. Even though additive genetic models have been considered a good approximation to more complicated inheritance modes, our method could be extended to accommodate dominant or recessive models. Finally, in this study we focused on loci that had relatively common functional variants (at least 28 copies of the minor allele). Considering more rare variants significantly increases the FDR of the method. Probably, the insufficient number of people with rare genotypes in the samples led to misesti-mation of the model parameters, which in turn increased the FDR. Perhaps, for more rare variants there is a need for larger sizes to ensure that enough individuals with the rare allele are included.
Acknowledgments
I sincerely thank Shili Lin for reading a draft of this manuscript and giving valuable comments and suggestions. The Genetic Analysis Workshop is supported by National Institutes of Health grant R01 GM031575. This article has been published as part ofBMC ProceedingsVolume 5 Supplement 9, 2011: Genetic Analysis Workshop 17. The full contents of the supplement are available online at http://www.biomedcentral.com/1753-6561/5?issue=S9.
Authors’contributions
The author developed the methodology presented in the contribution, performed the analyses, and drafted the manuscript. The Author read and approved the final manuscript.
Competing interests
The author declares no competing interests.
Published: 29 November 2011
References
1. Abney M, McPeek MS, Ober C:Estimation of variance components of quantitative traits in inbred populations.Am J Hum Genet2000, 66:629-650.
2. Jacquard A:The genetic structure of populations.New York, Springer; 1974.
3. Almasy L, Dyer T, Peralta JM, Kent JW Jr., Charlesworth JC, Curran JE, Blangero J:Genetic Analysis Workshop 17 mini-exome simulation.BMC Proc2011,5(suppl 9):S2.
4. Borecki IB, Province MA:Genetic and genomic discovery using family studies.Circulation2008,118:1057-1063.
doi:10.1186/1753-6561-5-S9-S58