Analysis methodology and recent results of the IGS network combination
R. Ferland, J. Kouba, and D. Hutchison
Geodetic Surveys Division, Natural Resources Canada, 456-615 Booth Street, Ottawa, Canada K1A 0E9
(Received January 13, 2000; Revised August 31, 2000; Accepted September 2, 2000)
A working group of the International GPS Service (IGS) was created to look after Reference Frame (RF) is-sues and contribute to the densification and improvement of the International Terrestrial Reference Frame (ITRF). One important objective of the Reference Frame Working Group is to generate consistent IGS station coordinates and velocities, Earth Rotation Parameters (ERP) and geocenter estimates along with the appropriate covariance information. These parameters have a direct impact on other IGS products such as the estimation of GPS satellite ephemerides, as well as satellite and station clocks. The information required is available weekly from the Analysis Centers (AC) (cod, emr, esa, gfz, jpl, ngs, sio) and from the Global Network Associate Analysis Centers (GNAAC) (JPL, mit, ncl) using a “Software Independent Exchange Format” (SINEX). The AC are also contributing daily ERPs as part of their weekly submission. The procedure in place simultaneously combines the weekly station coordinates, geocenter and daily ERP estimates. A cumulative solution containing station coordinates and velocity is also updated with each weekly combination. This provides a convenient way to closely monitor the quality of the estimated station coordinates and to have an up to date cumulative solution available at all times. To provide some necessary redundancy, the weekly station coordinates solution is compared against the GNAAC solutions. Each of the 3 GNAAC uses its own software, allowing independent verification of the combination process. The RMS of the coordinate differences in the north, east and up components between the AC/GNAAC and the ITRF97 Reference Frame Stations are 4–10 mm, 5–20 mm and 6–25 mm. The station velocities within continental plates are compared to the NNR-NUVEL1A plate motion model (DeMetset al., 1994). The north, east and up velocity RMS are 2 mm/y, 3 mm/y and 8 mm/y. Note that NNR-NUVEL1A assumes a zero vertical velocity.
1.
Reference Frame Stations
A set of so called RF stations is used to align the weekly and cumulative solutions. For the IGS realization of ITRF97, the RF station set is composed of 51 carefully selected stations. Criterion such as monumentation, data quality, data latency, collocation with other techniques, accurate velocity estimate, geographical distribution etc. were used for the station selec-tion (Koubaet al., 1998). Since GPS week 1021 (August 1, 1999), the weekly and cumulative solutions are aligned to ITRF97 (Boucheret al., 1999,http://lareg.ensg. ign.fr/ITRF). The IGS (http://igscb.jpl.nasa. gov) realization of ITRF96 used 47 stations; most are in the current realization. The earlier realizations used only 13 sta-tions; most of those are still being used in the current realiza-tion. The limited number of stations in the early realizations was occasionally causing instabilities, especially when sev-eral stations at crucial locations were missing. The larger number of stations in the more recent realizations greatly reduces those potential instabilities. The weekly and the cu-mulative solutions are aligned to ITRF and include complete covariance matrices, as well as auxiliary station information such as receiver and antenna type, antenna offset, dome num-ber, etc.
The weekly submissions of the preliminary RF products started with GPS week 0999. Work is continuing to improve
Copy right cThe Society of Geomagnetism and Earth, Planetary and Space Sciences (SGEPSS); The Seismological Society of Japan; The Volcanological Society of Japan; The Geodetic Society of Japan; The Japanese Society for Planetary Sciences.
the quality and timeliness of the submissions. The cumula-tive solution includes GNAAC solutions dating back to GPS week 0837. Starting with GPS week 0978 the AC were in-cluded in the combination while the GNAAC were used to quality control the combination. All AC use their own soft-ware, except for emr and jpl which use the GIPSY software. Although the combination was only made available starting with GPS week 0999, the procedure was tested on weekly solutions dating back to GPS week 0978.
2.
Weekly Combination Methodology
To meet the working group objectives, a semi-automated procedure was put in place to do the weekly combinations. The procedure performs the following functions for the in-put solutions: 1) validate; 2) unconstrain; 3) transform to the current ITRF; 4) compare; 5) combine and 6) report. The combination is presently generated within 2 days after the last GNAAC is available. The algorithms used follow gener-ally accepted geodesy procedures (Vanicek and Krakiwsky, 1986).
2.1 Validation
The format validation ensures that all the files used respect the SINEX V 1.0 (ftp://igscb.jpl.nasa.gov/pub/ data/format/sinex.txt). During the validation pro-cess, changes are also made such that all the SINEX files use a consistent interpretation of the SINEX format. This implies that minor differences may exist between the input AC and GNAAC information provided and the reported information.
applied when appropriate. LOD bias corrections, based on the IERS Bulletin A, are also applied. The ERPs are always referred to the ITRF origin.
2.2 Unconstraining
All the AC weekly estimated solutions have their station coordinates constrained to the reference frame, currently ITRF97. The applied constraints are reported with each so-lution. To extract each solution normal equations needed in the combination process, the solutions are unconstrained using apriori information provided in the SINEX solution. The possibility of distortions caused by the apriori informa-tion is also eliminated. Occasional difficulties with uncon-straining or inverting matrices appear to be caused mainly by rounding/truncation problems. Those are fairly minor and are resolved by simply rescaling the estimated and/or apriori diagonal matrix. The diagonal matrix rescaling is usually well below one part per million. All the weekly matrices are also rescaled by a variance factor (Chi**2/(degrees of free-dom) determined during a comparison with the combined cumulative solution. The applied scale factors are reported. Some solutions do contain multiple estimates for a given point at a site. Within a solution they are usually recombined. The coordinate differences between those multiple solutions are generally within a few mm. In the situation where sig-nificant differences exist, the outlier is rejected. All the AC solutions have their geocenter implicitly at the origin. An ex-plicit geocenter is added to the parameters with coordinates (0.0, 0.0, 0.0) for each AC SINEXfile.
2.3 Transformation
The alignment of all the unconstrained weekly solutions to ITRF is done with a 7-parameters (3 translations, 3 rota-tions and 1 scale) similarity transformation. The ERPs are corrected by the appropriate transformation rotation angles and are always referred to the origin. The transformation pa-rameters are reported. All the common points between each weekly solution and the RF stations are used to estimate the transformation. Unit weighting is used for the coordinates during the estimation of the transformation parameters. The use of the corresponding weight matrices usually leads to very similar transformation parameters. Occasionally, the transformation has shown to be sensitive to the matrices. Since the process is to be run as automatically as possible, the more robust unweighted estimation was chosen for the transformation. To ensure proper alignment to ITRF, the pro-cess also checks and deletes outliers. The outlier detection threshold is currently set at 5 sigmas. Any station deleted is reported with the residuals and the solutions involved. 2.4 Comparison
In an effort to produce reliable weekly and updated cu-mulative solutions, several comparisons are made to detect and reject outliers. The AC/GNAAC are compared with each other, with the RF stations and with the previous week “weekly”and cumulative solutions. During the comparison,
residuals between the AC/GNAAC and 1) the ITRF RF sta-tions, and 2) the weekly combination and 3) the cumulative combination are reported. Results of those comparisons will be presented below. Weighted average and RMS statistics are also reported for the daily ERP’s between the AC/GNAAC and the weekly combinations.
A pair-wise comparison between the weekly AC and GNAAC ensures that they are consistent. Detected outliers are by default rejected in bothfiles, except when there are in-dications that only one station solution is responsible. This process reveals station coordinates with significant incon-sistencies. The weekly AC and GNAAC solutions are also compared with the previous week combined solution to de-tect significant station coordinates variations between con-secutive weeks. The outlier stations are rejected from the offending solutions. This comparison detects significant sta-tion coordinates variasta-tions from week to week. The weekly AC and GNAAC solutions arefinally compared with the cu-mulative solution to detect outliers in the station coordinates time series. Any detected/rejected outlier is again reported. When stations are rejected, it often occurs at several of the input solutions in which they are present. They usually have similar residuals and statistics; which is a good indication of the estimates and covariances consistency. This indicates that the anomalous variations are likely contained in or due to the corresponding RINEX observations.
2.5 Combination
The weekly AC solutions are combined to produce the two weekly combinations, the “weekly” and cumulative. The full covariance information is used to combine the sta-tion coordinates, geocenter and daily ERP. Although, no rejection is expected from the combination, the outlier de-tection/rejection/reporting process is repeated. The cumula-tive solution, which also includes station velocity estimates, is then updated. It is followed by one last outlier detec-tion/rejection/reporting exercise. The combined “weekly” and cumulative solutions are aligned to ITRF using respec-tively 7 or 14 transformation parameters. The station coordi-nates and ERP consistency is maintained during the transfor-mation. The results are checked and the process is repeated if necessary. The SINEXfiles consistency with the“igs.snx” template is also ensured. A summary report is prepared. 2.6 Report
The weekly combination report is divided in 5 sections: 1) Contacts; 2) Products; 3) Combination Strategy; 4) Remarks and 5) Results.
Fig. 1. Estimated Scale Factors (square root of variance factor for the AC and the GNAAC from GPS weeks 0978 (98/10/04) to 1028 (99/09/25).
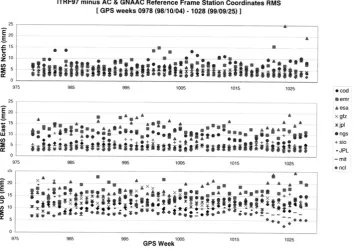
Fig. 2. RMS North/East/Up Station Coordinate differences between the AC and GNAAC and ITRF for the Reference Frame Stations.
itr, igsyyPwwww.res, IGSyyPww.res), one ERP file (igsyyPwwww.erp) and one summary file (igsyyPwwww. sum); where“yy”are the last two digits of the year,“ww” is the week of the year and“wwww”is the GPS week. The three residualfiles list the station residuals with respect to the ITRF RF stations, the weekly solution and the cumula-tive solution. In the case of the“weekly”combined solution, the residuals are also given for the ERPs and the
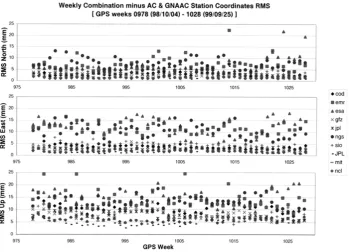
Fig. 3. RMS of North/East/Up Station Coordinate Differences between the AC and GNAAC and the“Weekly”Combination Solutions.
Fig. 4. RMS of North/East/Up Station Coordinate Differences between the AC and GNAAC and the Cumulative Combination Solutions.
and 7) the conflicts/inconsistencies.
3.
Results
The results presented in this section are extracted from the weekly summaryfiles between GPS weeks 0978 (October 4, 1998) to 1028 (September 25, 1999). Even though the solutions are publicly available only since GPS week 0999 (February 28, 1999), the procedure was tested with data dat-ing back to GPS week 0978. Those test weeks are also
included here.
conditions, 2 to 3 iterations are sufficient for the scale fac-tor estimation to converge. In most cases, the scale facfac-tor has random noise behavior. When all the AC started to use ITRF97 RF stations on GPS week 1021, steps were observed on some time series.
The weekly average residuals between the AC/GNAAC and ITRF for the RF stations is generally within 2–3 mm in all 3 directions (North, East, Up). The overall average is (−0.5 mm, −0.1 mm, 0.4 mm). Weighted average time series are correlated and they show small systematic biases. The RMS of the residuals (Fig. 2) is about (4.8 mm, 6.4 mm, 12.4 mm) for the RF stations. This shows that the alignment with ITRF is well within the computed RMS. The RMS of the residuals in the horizontal are stable, there seems to be a marginal improvement in the vertical axis.
Figure 3 shows the RMS for the AC/GNAAC weekly so-lutions with respect to the“weekly”combination solutions. It includes all the combined stations. The residuals with respect to the weekly combined solution have an overall weighted average of (−0.4 mm, 0.1 mm,−0.4 mm). The weighted average is marginally better than when comparing the RF stations to ITRF. The RMS for each direction is (3.9 mm, 5.4 mm, 10.4 mm). It is an indication of the internal consistency of the weekly AC/GNAAC station coordinates solutions. This also indicates that the RF stations coordi-nates and velocity estimates are consistent. Furthermore this also confirms the consistent quality of the horizontal station coordinates solutions and the marginal improvements in the vertical estimates. The best agreements are with the GNAAC solutions. They have the horizontal RMS at 1–2 mm and the vertical RMS at 4–6 mm. This is an indication of the upper bound for the processing noise.
Figure 4 show the RMS between the AC/GNAAC weekly solutions and the cumulative combined solution at the weekly solution epoch. The comparison includes all the combined
stations. The overall weighted average of the residuals is (−1.2 mm, 0.0 mm, 1.3 mm). It is larger than those esti-mated for the ITRF and the“weekly”combination compar-isons. Some systematic effects present in the weekly and/or cumulative solution likely cause this. A close look at the residuals time series has confirmed the presence of annual and semi-annual periods at a number of stations, predomi-nantly in the vertical component. Some stations also show more erratic behavior, which can reach several mm. The RMS are, on the average, about 5.0 mm, 6.5 mm and 13.7 mm. It is almost identical to the results obtained during the comparisons with the RF stations. It is an indirect indication of good internal consistency between the ITRF and the cu-mulative solutions. The ratio of the“weekly”and the above RMS is about 0.8 for both the horizontal and vertical com-ponents. Using the law of accidental error propagation one can estimate that about 60% of the noise is probably caused by the short term effects (about one week) and about 40% has a longer-term signature.
References
Boucher, C., Z. Altamimi, and P. Sillard (eds.), The 1997 International Terrestrial Reference Frame (ITRF97), IERS Technical Note 27, Obser-vatoire de Paris, Paris, 1999.
DeMets, C., R. G. Gordon, D. F. Argus, and S. Stein, Effects of recent revisions to the geomagnetic reversal time scale on estimates of current plate motions,Geophys. Res. Lett.,21, 2191–2194, 1994.
Kouba, J., J. Ray, and M. M. Watkins, IGS reference frame realization, 1998 IGS Analysis Center Workshop Proceedings, edited by J. M. Dowet al., pp. 139–172, European Space Operations Center, Darmstadt, Germany, 1998.
Vanicek, P. and E. Krakiwsky,Geodesy: The Concepts, 697 pp., North-Holland Publishing Company, 1986.