LETTER Earth Planets Space,52, 1107–1112, 2000
Elastic and inelastic strains in the Japanese Islands deduced from GPS dense array
Gamal S. El-Fiky
National Research Institute of Astronomy and Geophysics, Helwan, Cairo, Egypt
(Received November 25, 1999; Revised June 4, 2000; Accepted August 3, 2000)
To estimate the elastic and inelastic strains in the Japanese Islands, we used horizontal velocity vectors at 917 sites of the nation-wide GPS network for the period April 1996 to March 1998. To segregate the signal and noise in the velocity vectors, we employed the Least-Squares Prediction technique (LSP). Estimated signals (displacement vectors) were differentiated in space to reconstruct the total strains (elastic plus inelastic). Then, we estimated inelastic strains of the islands using the inversion method introduced by Horiet al.(1999). The estimated rate of inelastic strains is of the order of 10−3 μstrains/yr. Compared this with the rate of total strains of the order of 0.1 μstrains/yr, inelastic part was found to be negligible. Finally, shear stresses at the surface of the Japanese Islands have been estimated, based on the elasticity theory.
1.
Introduction
Monitoring variation in the crustal strain in space and time is a key to understand the physical process in the crust and to forecast the crustal activity. A dense array of continuous GPS tracking network provides us with one of the ideal tools for monitoring crustal strain. In Japan, the Geographical Survey Institute (GSI) started to establish a dense GPS array in the Kanto-Tokai region in 1992 and has further expanded it to cover the entire nation. The GSI has been operating 610 sites, for continuous monitoring of the daily site coordinates since April, 1996. The number of sites went up to about 1000 by 1997. The average site interval is about 20 km (e.g., Miyazakiet al., 1997). The array is now considered as one of the most dense and fundamental infrastructures for monitoring crustal activity in the Japanese Islands.
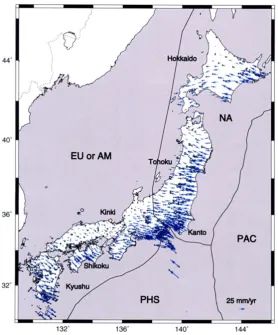
Miyazaki et al.(1998) estimated the displacement field of the Japanese Islands relative to the stable interior of the Eurasian plate by analysing the data from this network. The results indicated a prominent westward motion of the north-eastern part of Japan and a northwestward movement of the southwestern part of Japan. This clearly due to the effects of the subducting oceanic plates under the Japanese Islands. In the present study, we try to delineate the crustal elastic and inelastic strains of the Japanese Islands, using two years data from the above GPS array (Fig. 1).
One problem in providing the strain field using geodetic data is due to the assumption that the Japanese Islands de-form elastically in time and our inability to detect the inelas-tic properties of the crust that may be relevant to earthquake prediction. However, evidence from geology and geomor-phology suggests that the crustal deformation is not purely elastic, especially for long time intervals. Thus estimation of the inelastic properties of the crust is important to collab-orate the deformation with geomorphology. Moreover, the
Copy right cThe Society of Geomagnetism and Earth, Planetary and Space Sciences (SGEPSS); The Seismological Society of Japan; The Volcanological Society of Japan; The Geodetic Society of Japan; The Japanese Society for Planetary Sciences.
estimate of stress in the crust is important in relation to earth-quake occurrence, for which we need to know the inelastic deformation embedded in the total deformation. Therefore, a more appropriate way is to model the Japanese Islands as elasto-plastic bodies assuming that inelasticity comes from plastic strain. Then the surface strains can be inverted to study the inelastic properties of the crust. This could help us to delineate elastic crustal strains after removal of the non-elastic part.
In the present study, we first estimated the total strains and then, the principal components of these strains were inverted, using the inverse method proposed by Horiet al.(1999) to study the inelastic properties of the crust in the Japanese Is-lands. Finally, crustal stress is delineated from elastic crustal strains.
2.
Total Strains of the Japanese Islands
First, we employed the Least-Squares Prediction tech-nique (LSP) to estimate the total strains using the GPS data. The LSP method is a corollary of the Least-Squares Colloca-tion technique. The applicaColloca-tion of the method to the crustal deformation data was discussed in detail in previous papers (El-Fiky et al., 1997; El-Fiky and Kato, 1999a). In this study, the total strain components were calculated following the method described by El-Fiky and Kato (1999a).
To estimate the total strains (elastic plus inelastic) in the GPS data for the period April 1996 to March 1998, we used horizontal velocity vectors computed by Miyazaki et al. (1998) (Fig. 1). The average velocities are subtracted from all of the site velocities to remove the systematic bias. Then, we apply the LSP to each vector component (East-West and North-South) independently. The Empirical Co-variance Function (ECF) for each component is fitted to the data. Then, ECFs are used to reconstruct displacement vec-tors (signal) at grid points of 10 km×10 km mesh covering the Japanese Islands. Then estimated velocities at grid points are differentiated in space to obtain total crustal strains. Figs. 2,
1108 G. S. EL-FIKY: ELASTIC AND INELASTIC STRAINS IN THE JAPANESE ISLANDS
Fig. 1. Yearly averaged velocity vectors obtained from the continuous GPS observation network in the Japanese Islands for the period from April 1st, 1996 to March 31st, 1998 (Miyazakiet al., 1998). EU or AM: Eurasian or Amurian plate, NA: North American plate, PHS: Philippine Sea plate, and PAC: Pacific plate.
3, and 4 are thus the estimated dilatational strains, maximum shear strains, and principal axes of strains, respectively.
3.
Inelastic Strains
3.1 Inversion analysis
Hori et al.(1999) proposed a formulation of an inverse problem relating surface deformation and inelastic properties of the earth’s crust. They showed that, the inelastic properties of the crust could be studied if its deformation is measured. In this section we will make use of their hypothesis to isolate the inelastic properties of the Japanese Islands so that reliable crustal strains can be delineated for earthquake prediction studies.
The elasto-plastic constitutive relations of the heteroge-neous earth’s crust are expressed in terms of stress and strain (Horiet al., 1999) as
σi j=Ci j kl(klR− P
kl). (1)
WhereCi j kl is the stress tensor,klR is the observed (total)
strain increment, andP
kl is the plastic (inelastic) strain
in-crement or eigen strain. From Eq. (1) the observed stress,
σR
i j, and plastic stress,σ P
i j, can be expressed in the following
forms
i j is usually called eigen stress or polarized stress. When
eigen stress=0, then the material is fully elastic, i.e.,σi j = σR
i j. We can rewrite Eq. (1) in the following form
σi j =σi jR−σ P
i j. (3)
By space differentiation of Eq. (3) with respect tox andy respectively, we get the following equations
σ11,1+σ12,2 =σ11R,1+σ
Where the suffices, 1 and 2, following the comma in the above equations stands for the derivative with respect to x andyrespectively. From the equilibrium condition, the left hand side of Eqs. (4) and (5) should be equal to zero. Then, we have
Here we assume that plastic strain increment does not have volumetric part (P
i i =0), that is to say,
G. S. EL-FIKY: ELASTIC AND INELASTIC STRAINS IN THE JAPANESE ISLANDS 1109
Fig. 2. The areal dilatation of the Japanese Islands as estimated by the LSP technique for the period from April 1st, 1996 to March 31st, 1998. Unit is 0.1×μstrain/yr.
assumption, we can get the following equations:
σP 11,11+σ
P 11,22=σ
R 11,11−σ
R
22,22 (8)
σP 12,11+σ
P 12,22=σ
R 12,11+σ
R 12,22+σ
R 11,12+σ
R
22,12. (9)
Equations (8) and (9) are therefore our target to solve the inverse problem. The inverse problem then reduces to a pair of Poisson equations as follows:
σP 11,11+σ
P
11,22 =ρ1(x,y);
σP
12,11+σ12P,22 =ρ2(x,y).
(10)
The source terms of the above Poisson equations are known. Then, straightforward by the Finite Difference Equa-tions (FDE) technique (e.g., Richtmyer and Morton, 1967), Eq. (10) can be solved for the inelastic normal and shear strains. Finally, the maximum shear of inelastic strain is given by:
σP max= {(σ
P 11+σ
P 22)
2+(σP 12)
2}1/2. (11)
The right hand side of Eqs. (8) and (9) gives us the known surface deformation and the left hand side gives us the un-known inelastic properties of the crust. The un-known surface deformations are thefirst and second partial derivatives of the total strains at each grid point estimated in Section 2.
4.
Results and Discussion
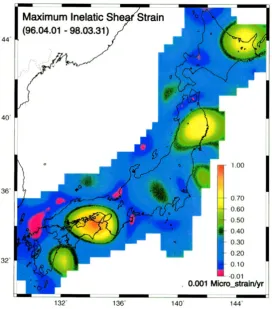
Figure 5 shows the estimated maximum shear rates of the inelastic strains of the Japanese Islands. The obtained inelas-tic shear strain rate does not exceed 1.0×10⁻⁹/yr everywhere
in the Japanese Islands. Even though the magnitude of the in-elastic strain rate is very small, it is significant, especially in the patched areas in Fig. 5. The uncertainty is estimated to be in the range of 30–40% of the obtained inelastic strains. As it is seen from thisfigure that the inelastic strains show some patches of relatively high inelasticity. They are over; north-east of Hokkaido, southern Tohoku district, and Shikoku Is-land. The inelastic strain in the northeast Hokkaido coin-cides with seismically active region, where the large 1973 (M7.4) Nemuro-oki offshore earthquake occurred (Kasahara and Kato, 1981). The relatively high inelasticity in the To-hoku region may be related to coseismic effect of Narugo earthquake (M5.9) of August 11th, 1996 and/or postseismic deformation of the Sanriku earthquake of 1994 (M7.5). The high inelastic strains in the Shikoku Island may be due to shear deformation along the Median Tectonic line. On the other hand, the central Japan has rather relatively very low inelasticity.
1110 G. S. EL-FIKY: ELASTIC AND INELASTIC STRAINS IN THE JAPANESE ISLANDS
Fig. 3. Distribution of the maximum shear strain rates in the Japanese Islands as estimated by LSP for the period from April 1st, 1996 to March 31st, 1998. Unit is 0.1×μstrain/yr. This pattern, also, represents the maximum shear stress rates estimated based on the simple elasticity theory; see the text for details.
(Fig. 5) are very low (10−3 μstrain/yr) compared to the to-tal rates (10−1 μstrain/yr) (Fig. 3). This suggests that the Japanese Islands deform mostly elastically, and the crustal stresses at surface can well be explained by simple elasticity theory as it is discussed later.
Based on the above analysis, we may conclude that the Japanese Islands deform mostly elastically and that Figs. 2∼4 represent the elastic crustal strains of the present interval. Thesefigures, though estimated from only two years of data, may well portray characteristics of the strains in the Japanese Islands.
First of all, the dilatational strains shown in Fig. 2 indicate that the Japanese Islands are under the compressional strain regime. This may be due to the subducting oceanic plates from east, Pacific plate, and southeast, Philippine Sea plate, (Fig. 1) and might be also due to the eastward extraction of China continental block by the collision of India towards north (e.g., Kato et al., 1998). Ishikawa and Hashimoto (1999) analysed the strain by the conventional surveys of 100 years and showed that the dilatational strain is posi-tive in Tokoku and Kyushu areas, which significantly differ from the present results. The present study shows that only the western and the southern parts of Kyushu are dilating positively. Discrepancy in the Tohoku district may have to be examined carefully because many interplate earthquakes have occurred in the past 100 years and affected strains in the area. Although none of the large interplate earthquakes have occurred in the Tohoku area in the studied period,
G. S. EL-FIKY: ELASTIC AND INELASTIC STRAINS IN THE JAPANESE ISLANDS 1111
Fig. 4. Magnitude and orientation of principal strains axis in the Japanese Islands as estimated by LSP for the period from April 1st, 1996 to March 31st, 1998. The blue bars are contraction and the red ones are extension.
Finally, northeastern part of Kyushu is most prominent in this figure. This may be due to coseismic and postseismic effect of Hyuganada earthquakes of October 19th (M6.6) and De-cember 3rd (M6.3), 1996 (e.g., GSI, 1997). The slow thrust slip event of May 1997 following the above Hyuganada earth-quakes, also, might have contributed to this high strain rate in this area as suggested by Hiroseet al.(1999).
Figure 4 shows directions of principal strain axes. Large north-south extension in the southern part of Kyushu Island is evident. This might be attributed to the expansion of the Okinawa trough (e.g., Tada, 1984). Apart from this, NW-SE compression is predominant in the southwestern Japan. This may be due to the compressional force acting at the conver-gent plate between the Philippine Sea plate and the continen-tal plate (Tabeiet al., 1996). The northeastern Japan exhibits east-west compressional strains due to the Pacific plate con-verging toward west, whose directions are consistent with the result obtained by the old triangulation data by Shen-Tu and Holt (1996) and Shen-Tuet al.(1995), but the magnitudes are about twice larger when compared to their result.
Finally, the maximum shear stress rates at the surface of the Japanese Islands are calculated by the simple elasticity theory. The Poisson’s ratio and rigidity are assumed to be 0.25 and 0.5×10¹¹N/m2, respectively. Since the maximum shear stress rate is estimated based on the elastic theory, it showed the same pattern of the maximum shear strain rates shown in Fig. 3. The rate of stress found to be maximum (3.4×10⁻³Mpa/yr) in southern part of the Shikoku district, which may be due to the subducting Philippine Sea plate
along the Nankai trough and/or the shear deformation along the Median Tectonic Line. The larger shear stress (strain) rates near the plate boundary may also indicate that the lock-ing depth of the subductlock-ing slab at the Nankai trough is very shallow (El-Fikyet al., 1999). In the northern part of the Tohoku district the stress is minimum (0.2×10⁻³ Mpa/yr) that may be due to the postseismic effect of the 1994 Sanriku earthquake (M7.5).
5.
Conclusion
1112 G. S. EL-FIKY: ELASTIC AND INELASTIC STRAINS IN THE JAPANESE ISLANDS
Fig. 5. Distribution of the maximum shear inelastic strain in the Japanese Islands as estimated by LSP and FDE for the period from April 1st, 1996 to March 31st, 1998. Unit is 0.001×μstrain/yr.
Acknowledgments. I am very grateful to Dr. Shin-ichi Miyazaki of the GSI for providing me the GPS data. I thank Prof. T. Kato, Dr. Eric Oware, Prof. M. Hori, Dr. Divakar Reddy, and Mr. Yosuke Aoki for their help and useful discussion. Comments of Prof. M. Kasahara and Prof. M. Hashimoto were invaluable to improve the manuscript. GMT software package was used to plot thefigures. I express sincere thanks to the Japan Society for the promotion of science (JSPS) for supporting me during this study.
References
El-Fiky, G. S. and T. Kato, Continuous distribution of the horizontal strain in the Tohoku district, Japan, deduced from least squares prediction,J. Geodynamics,27, 213–236, 1999a.
El-Fiky, G. S. and T. Kato, Interplate coupling in the Tohoku district, Japan, deduced from geodetic data inversion,J. Geophys. Res.,104, 20,361–
20,377, 1999b.
El-Fiky, G. S., T. Kato, and Y. Fujii, Distribution of the vertical crustal movement rates in the Tohoku district, Japan, predicted by least-squares collocation,J. Geodesy,71, 432–442, 1997.
El-Fiky, G. S., T. Kato, and E. N. Oware, Crustal deformation and interplate coupling in the Shikoku district, Japan, as seen from continuous GPS Observation,J. Tectonophys.,314, 387–399, 1999.
Geographical Survey Institute, Crustal movements in the Kyushu district, 58, 638–652, 1997.
Heki, K., S. Miyazaki, and H. Tsuji, Silent fault slip following an interplate thrust earthquake at the Japan trench,Nature,386, 595–598, 1997. Heki, K., S. Miyazaki, H. Takahashi, M. Kasahara, F. Kimata, S. Miura,
N. Vasilenko, A. Ivashchenko, and Ki-Dok An, The Amurian Plate mo-tion and current plate kinematics in eastern Asia,J. Geophys. Res.,104, 29,147–29,155, 1999.
Hirose, H., K. Hirahara, F. Kimata, N. Fujii, and S. Miyazaki, A slow thrust slip event following the two 1996 Hyuganada earthquakes beneath the Bungo Channel, southwest Japan,Geophys. Res. Lett.,26, 3237–3240, 1999.
Hori, M., T. Kameda, and N. Hosokawa, Formulation of identifying material property distribution based on equivalent inclusion method,J. Struct.
Mech. Earthquake Eng., JSCE,619, I–47, 1999.
Ishikawa, N. and M. Hashimoto, Average horizontal crustal strain rates in Japan during interseismic period deduced from geodetic surveys (part 2), Zishin,52, 299–315, 1999 (in Japanese).
Kasahara, K. and T. Kato, Aseismic faulting following the 1973 Nemuro-oki earthquake, Hokkaido, Japan (a retrospective study),Purer Apple. Geophys.,119, 392–403, 1981.
Kato, T., G. S. El-Fiky, E. N. Oware, and S. Miyazaki, Crustal strains in the Japanese islands as deduced from dense GPS array,Geophys. Res. Lett., 25, 3445–3448, 1998.
Miyazaki, S., T. Saito, M. Sasaki, Y. Hatanaka, and Y. Iimura, Expansion of GSI’s nationwide GPS array,Bull. Geogr. Surv. Inst.,43, 23–34, 1997. Miyazaki, S., T. Tada, T. Sagiya, D. Dong, and J. Johnson, Regional crustal
deformation of Japan derived by Japanese GPS array,Eos Trans., AGU, 79, F186, 1998.
Richtmyer, R. D. and K. M. Morton,Difference Methods for Initial Value Problems, 405 pp., New York, Wiley-interscience, 1967.
Sagiya, T., Boso Peninsula silent earthquake of May 1996,Eos Trans.,78, F165, 1997.
Shen-Tu, B. and W. E. Holt, Interseismic horizontal deformation in northern Honshu and its relationship with the subduction of the Pacific plate in the Japan trench,Geophys. Res. Lett.,23, 3103–3106, 1996.
Shen-Tu, B., W. E. Holt, and A. J. Haines, Intraplate deformation in the Japanese Island: A kinematic study of intraplate deformation at a con-vergent plate margin,J. Geophys. Res.,100, 24,275–24,293, 1995. Tabei, T., T. Ozawa, and Y. Date, Crustal deformation at the Nankai
subduc-tion zone, southwest Japan, derived from GPS measurements,Geophys. Res. Lett.,23, 3059–3062, 1996.
Tada, T., Spreading of the Okinawa trough and its relation to the crustal deformation in Kyushu,Zishin,37, 407–415, 1984 (in Japanese). Tsuji, H., Y. Hatanaka, T. Sagiya, and M. Hashimoto, Coseismic crustal
deformation from the 1994 Hokkaido-Toho-oki earthquake monitored by a nationwide continuous GPS array in Japan,Geophys. Res. Lett.,22, 1669–1672, 1995.