Open Access
Proceedings
Pattern-based mining strategy to detect multi-locus association and
gene × environment interaction
Zhong Li*
1,4, Tian Zheng
2, Andrea Califano*
3,4,5and Aris Floratos
4Address: 1Department of Computational Genetics, High Throughput Biology Inc., 513 West Mount Pleasant Avenue, Livingston, New Jersey
07039, USA, 2Department of Statistics, Columbia University, Room 1005, MC4690, 1255 Amsterdam Avenue, New York, New York 10027, USA, 3Department of Biomedical Informatics, Columbia University, 622 West 168th Street, Vanderbilt Clinic, 5th Floor, New York, New York 10032,
USA, 4Center for Computational Biology and Bioinformatics, Columbia University, 1130 St. Nicholas Avenue, New York, New York 10032, USA
and 5Co-senior author
Email: Zhong Li* - [email protected]; Tian Zheng - [email protected]; Andrea Califano* - [email protected]; Aris Floratos - [email protected]
* Corresponding authors
Abstract
As genome-wide association studies grow in popularity for the identification of genetic factors for common and rare diseases, analytical methods to comb through large numbers of genetic variants efficiently to identify disease association are increasingly in demand. We have developed a pattern-based data-mining approach to discover unlinked multilocus genetic effects for complex disease and to detect genotype × phenotype/genotype × environment interactions. On a densely mapped chromosome 18 data set for rheumatoid arthritis that was made available by Genetic Analysis Workshop 15, this method detected two potential locus associations as well as a putative two-locus gene × gender interaction.
Background
Long considered to hold promise for dissecting the genetic etiology of complex diseases [1], genome-wide association studies have produced significant and some-times highly reproducible findings in an increasing number of publications [2]. Despite early successes that demonstrated the feasibility of whole-genome studies, strategies for fully analyzing genome-wide data, such as detecting multilocus genetic effects for complex disease or detecting genotype × phenotype/genotype × environment interactions, are still underdeveloped or underutilized, affecting the effectiveness of those large-scale studies on
advancing our understanding of the genetic contribution to common human diseases [3,4]. An increasing number of methods have been proposed to detect multilocus genetic association: some make use of haplotypes [5] or logistic regression [6], while others use nonparametric "data mining" strategies such as the multifactor dimen-sionality reduction (MDR) [7] and neural networks [8]. Methods to analyze pair-wise interactions between unlinked loci have also been developed [9].
We have developed a pattern-based mining strategy (man-uscript in preparation) to detect local (markers in
moder-from Genetic Analysis Workshop 15
St. Pete Beach, Florida, USA. 11–15 November 2006
Published: 18 December 2007
BMC Proceedings 2007, 1(Suppl 1):S16
<supplement> <title> <p>Genetic Analysis Workshop 15: Gene Expression Analysis and Approaches to Detecting Multiple Functional Loci</p> </title> <editor>Heather J Cordell, Mariza de Andrade, Marie-Claude Babron, Christopher W Bartlett, Joseph Beyene, Heike Bickeböller, Robert Culverhouse, Adrienne Cupples, E Warwick Daw, Josée Dupuis, Catherine T Falk, Saurabh Ghosh, Katrina A Goddard, Ellen L Goode, Elizabeth R Hauser, Lisa J Martin, Maria Martinez, Kari E North, Nancy L Saccone, Silke Schmidt, William Tapper, Duncan Thomas, David Tritchler, Veronica J Vieland, Ellen M Wijsman, Marsha A Wilcox, John S Witte, Qiong Yang, Andreas Ziegler, Laura Almasy and Jean W MacCluer</editor> <note>Proceedings</note> <url>http://www.biomedcentral.com/content/pdf/1753-6561-1-S1-info.pdf</url> </supplement>
This article is available from: http://www.biomedcentral.com/1753-6561/1/S1/S16 © 2007 Li et al; licensee BioMed Central Ltd.
ate or strong linkage disequilibrium, or LD) and global (unlinked markers) multilocus genetic associations as well as gene × gene/gene × environment interactions. The pattern-based method exhaustively yet efficiently identi-fies all patterns satisfying pre-defined pattern search crite-ria and evaluates the association of patterns to disease state through a χ2-based test statistics. For the work
described in this report, we applied the pattern-based method on the chromosome 18 data set on rheumatoid arthritis (RA) ascertained by the North American Rheuma-toid Arthritis Consortium (NARAC) that was made avail-able for the Genetic Analysis Workshop 15 (GAW15). Ten patterns were found to be significantly associated with the RA phenotype after multiple testing correction. The signif-icance of those ten patterns was confirmed using Monte Carlo simulation. Furthermore, we identified a poten-tially significant multi-gene/gender interaction involving two loci: SNP0177 and the LD region containing markers SNP0603–SNP0615.
Methods
Pattern Examiner: a pattern-based method to detect multi-locus association and interaction
Data are organized in a two-dimensional data matrix with markers as columns, individuals as rows, and individuals' alleles or genotypes as cell values. Each marker is repre-sented by five columns: one column for each of the two alleles of the marker and one column for each of the three possible genotypes for the marker. A pattern is defined as a maximal sub-matrix of the data matrix in which the value of each marker across all individuals in the sub-matrix satisfies a predefined equivalence criterion such as same genotype value. A sub-matrix is maximal if 1) no more rows can be added while keeping the columns fixed and, 2) no more columns can be added when keeping the rows fixed. Under this formulation patterns can be used to model both multilocus allelic and multilocus genotypic contributions to disease state.
Pattern Examiner is a nonparametric data mining-based method for the detection of multilocus associations and gene × gene/gene × environment interactions on data col-lected in population-based case/control studies. This method has two steps: 1) pattern discovery and 2) signif-icance evaluation. In the pattern discovery step, patterns are identified using as input data from the case population only. The extensiveness (and execution time) of the pat-tern discovery step is controlled by two parameters: the
support threshold, which specifies the minimum number of rows a pattern must have; and the locus threshold, which specifies the extent of locus interaction. For example, with the support and locus thresholds set to 20 and 2 respec-tively, all reported patterns will have 20 or more case sup-ports and mostly one or two markers. In the significance evaluation step, a 2 × 2 contingency table is constructed
for each pattern to tally its support in the case and control populations ("case support" and "control support", respectively). The two categorical variables tabulated are population type ("cases" vs. "controls") and pattern match status ("matches" vs. "does not match"). Partially missing data are excluded. The p-value is obtained from a
χ2 test of independence and then adjusted for multiple
testing. A modified Bonferroni correction for multiple testing is applied to each pattern, using as the correction factor the total number of patterns that contain equal or greater case support than the target pattern under signifi-cance evaluation, rather than the total number of patterns identified. As a result, the adjusted significance is robust against the arbitrary selection of values for parameters in the pattern discovery step. The odds ratio with confidence interval is also calculated for each pattern.
Test for differential gene × gender interactions in cases vs. controls
To test for the null hypothesis that there is no difference on genotype × gender interaction between cases and con-trols, three 2 × N contingency tables were constructed with the observed N genotypes of a significant pattern as rows and genders as columns. Three chi-square values, χ2
case, χ2
control, and χ2pooled, were then obtained for cases only,
controls only, and cases and controls pooled, respectively. The p-value was obtained using χ2 = χ2
case + χ2control -χ2
pooled with N - 1 degree of freedom.
Results
Significant association between two-locus patterns and RA
demonstrated a recessive effect with the inclusion of homozygote genotype(s) in corresponding significant patterns.
To further evaluate the significance of those ten patterns, we performed a Monte Carlo simulation using 400 simu-lated data sets generated by randomizing the case-control assignment of the 920 individuals in the study while maintaining the female/male ratio in both cases and con-trols. The pattern-based method was applied to each sim-ulated data set. On average, 2.7 million patterns were identified from each data set, which were then subject to test statistics and multiple testing correction. In 8 out of 400 (2%) simulated data sets we observed ten or more patterns that had p-values less than 0.05 after multiple testing correction (false-positive patterns). In 20 out of 400 (5%) simulated data sets we observed five or more false-positive patterns. These results suggest that the ten significant patterns discovered in the real data set are unlikely to be an artifact of chance alone. Furthermore, if we consider the fact that these ten patterns share the same marker, SNP0177, then the significance gets even stronger: out of the 400 simulated data sets there was only 1 case (0.25%) where sharing of a common marker was observed in ten or more patterns.
Significant interaction between multilocus genotypes and gender in RA
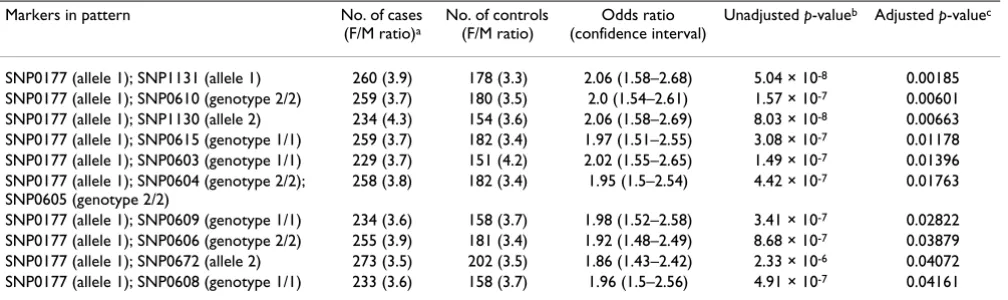
It is known that the incidence rate of RA is higher in females. Indeed, there is a matching 3.82:1 female/male ratio in both the case sample and control sample of this data set. However, as shown in Table 1 (columns "No. of cases (F/M ratio)" and "No. of controls (F/M ratio)"),
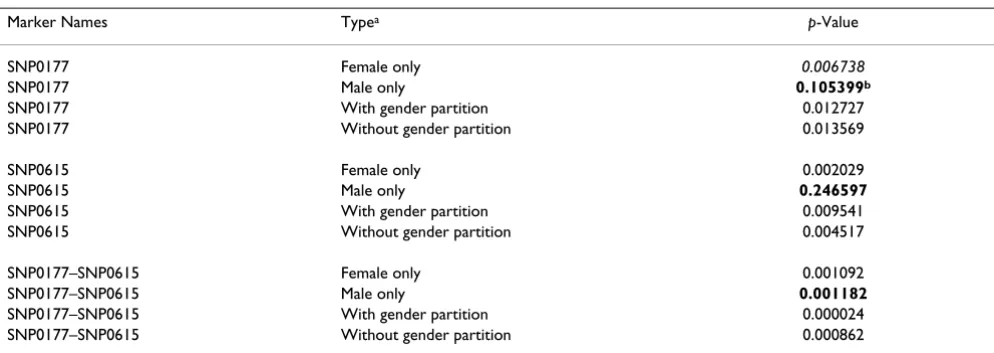
notable differences on the female/male ratio between cases and controls were observed for many significant pat-terns. To investigate the genotype × gender interaction fur-ther, we constructed 2 × N contingency tables for each marker in the significant patterns and for each significant pattern with observed genotypes for marker or pattern as rows. Four variations of the contingency tables were con-structed as detailed in the legend of Table 2. Table 2 shows a representative pattern demonstrating significant interac-tion between multilocus genotypes and gender. Individu-ally, marker SNP0177 or SNP0615 was not significant in male population (bold). However together they demon-strated strong significance in male population that reached the same magnitude (p = 0.00118) as in females (p = 0.00109) despite the much smaller sample size. When both female and male populations were considered together ("With gender partition"), an even stronger asso-ciation between the pair of markers and the disease was observed. For individuals with the 1/1–1/2 genotype for markers SNP0177 and SNP0615, an odds ratio of 11.7 (confidence interval: 1.34–102.86) was observed in females over males. For individuals with the 2/2–1/2 gen-otype for markers SNP0177 and SNP0615, an odds ratio of 7.51 (confidence interval: 1.94–28.99) was observed in males over females. Logistic regression analysis on the interaction between the pattern and gender also yielded a significant p-value of 0.0021 (data not shown). Further-more, a test for differential interaction in cases and con-trols yielded a p-value of 0.0016, suggesting that there is significant interaction between the SNP0177–SNP0615 pattern and gender in the affected individuals vs. unaf-fected individuals. Similar results were obtained for all patterns containing markers in the SNP0603–0615 LD Table 1: Significant patterns identified with the pattern-based method
Markers in pattern No. of cases (F/M ratio)a
No. of controls (F/M ratio)
Odds ratio (confidence interval)
Unadjusted p-valueb Adjusted p-valuec
SNP0177 (allele 1); SNP1131 (allele 1) 260 (3.9) 178 (3.3) 2.06 (1.58–2.68) 5.04 × 10⁻⁸ 0.00185
SNP0177 (allele 1); SNP0610 (genotype 2/2) 259 (3.7) 180 (3.5) 2.0 (1.54–2.61) 1.57 × 10⁻⁷ 0.00601
SNP0177 (allele 1); SNP1130 (allele 2) 234 (4.3) 154 (3.6) 2.06 (1.58–2.69) 8.03 × 10⁻⁸ 0.00663
SNP0177 (allele 1); SNP0615 (genotype 1/1) 259 (3.7) 182 (3.4) 1.97 (1.51–2.55) 3.08 × 10⁻⁷ 0.01178
SNP0177 (allele 1); SNP0603 (genotype 1/1) 229 (3.7) 151 (4.2) 2.02 (1.55–2.65) 1.49 × 10⁻⁷ 0.01396
SNP0177 (allele 1); SNP0604 (genotype 2/2); SNP0605 (genotype 2/2)
258 (3.8) 182 (3.4) 1.95 (1.5–2.54) 4.42 × 10⁻⁷ 0.01763
SNP0177 (allele 1); SNP0609 (genotype 1/1) 234 (3.6) 158 (3.7) 1.98 (1.52–2.58) 3.41 × 10⁻⁷ 0.02822
SNP0177 (allele 1); SNP0606 (genotype 2/2) 255 (3.9) 181 (3.4) 1.92 (1.48–2.49) 8.68 × 10⁻⁷ 0.03879
SNP0177 (allele 1); SNP0672 (allele 2) 273 (3.5) 202 (3.5) 1.86 (1.43–2.42) 2.33 × 10⁻⁶ 0.04072
SNP0177 (allele 1); SNP0608 (genotype 1/1) 233 (3.6) 158 (3.7) 1.96 (1.5–2.56) 4.91 × 10⁻⁷ 0.04161
Significant patterns were ordered according to their adjusted p-values. Each pattern contains markers with either individual allele or genotype.
aThe "No. of cases" column contains the number of individuals with RA who carried the specified alleles/genotypes at the specified markers in a
pattern. The number in parenthesis indicates the female/male ratio. Similar arrangement was made for "No. in controls".
block (data not shown). On the other hand, no differen-tial interaction in cases and controls was observed for the three remaining significant patterns (data not shown).
Discussion
Several lines of evidence suggest that the significant mul-tilocus associations we detected with Pattern Examiner on the NARAC chromosome 18 data set provided by GAW15 might be true associations: 1) except for marker SNP0177 and SNP0672, multiple markers from the same LD region (markers SNP1130 and 1131, markers SNP0603–0615) were found to be in different significant patterns; 2) all markers in the same LD region displayed consistent dom-inant (an allele in the pattern) or recessive (a homozygote genotype in a pattern) effect; 3) a Monte Carlo simulation with randomized cases and controls produced a type I error probability of 0.02 for the observed results. The sin-gleton SNP0177 does raise a flag because it is in a strong LD region with adjacent markers. Further investigation is necessary to confirm the role SNP0177 plays in the asso-ciation. The ultimate proof for true association will have to come from replication studies. Taking advantage of our method's ability to detect multilocus association, we per-formed a novel multilocus gene × gender interaction anal-ysis and detected a two-locus gene × gender interaction that was supported by three independent assays. Detailed analysis revealed large odds ratios for certain genotype combinations. However, a wide confidence interval (due to small sample size) dampens our enthusiasm. Again, further investigation with larger sample sizes is necessary to confirm this observation.
Several reports in the "Association – Problem 2" group of GAW15 have identified the LD region including markers SNP1097–1107 to be significantly associated with RA [[11]; Zhu G, Rao S, Li X, personal communication]. Although we also found markers SNP1097–1107 to be significant using a genotype-based single-marker χ2 test (p
= 0.0002 for most markers in this region), the significance disappeared after Bonferroni correction with 2300 mark-ers. After applying a less stringent Bonferroni correction using the number of LD blocks (233 LD blocks were iden-tified by the HapBlock program) in this 10-Mb region, those markers resurfaced as significant. Because none of the significant patterns identified by the pattern-based method included markers SNP1097–1107, this locus might act alone as a risk factor for RA.
By focusing on detecting multilocus association and inter-actions, the pattern-based method complements the tradi-tional single marker association test. A preliminary power analysis (data not shown) suggested that this method has more power than the traditional single marker-based analysis under a couple of two-locus disease models. Additional power analysis is needed to further validate its utility.
Conclusion
We have identified two potential multilocus associations (SNP0177/SNP1130–1131 and SNP0177/SNP0603– 0615) with RA as well as evidence of interaction between gender and loci SNP0177/SNP0603–0615.
Table 2: Evidence of interaction between multiple loci and gender in cases
Marker Names Typea p-Value
SNP0177 Female only 0.006738
SNP0177 Male only 0.105399b
SNP0177 With gender partition 0.012727
SNP0177 Without gender partition 0.013569
SNP0615 Female only 0.002029
SNP0615 Male only 0.246597
SNP0615 With gender partition 0.009541
SNP0615 Without gender partition 0.004517
SNP0177–SNP0615 Female only 0.001092
SNP0177–SNP0615 Male only 0.001182
SNP0177–SNP0615 With gender partition 0.000024
SNP0177–SNP0615 Without gender partition 0.000862
aFour variations of the 2 × N contingency table were constructed for each marker in the significant patterns in Table 1 and for each significant
pattern with the observed N genotypes as rows. Each contingency table has two columns for case and control. In "Without gender partition", individuals were grouped and allocated to table cells according to genotypes regardless of their gender. In "With gender partition", individuals were grouped together according to genotypes and gender with each combination of genotype and gender as a row. In "Males only", only males were grouped and allocated to table cells according to genotypes. In "Females only", only females were grouped and allocated to table cells according to genotypes.
Publish with BioMed Central and every scientist can read your work free of charge "BioMed Central will be the most significant development for disseminating the results of biomedical researc h in our lifetime."
Sir Paul Nurse, Cancer Research UK
Your research papers will be:
available free of charge to the entire biomedical community
peer reviewed and published immediately upon acceptance
cited in PubMed and archived on PubMed Central
yours — you keep the copyright
Submit your manuscript here:
http://www.biomedcentral.com/info/publishing_adv.asp
BioMedcentral
Competing interests
Dr. Zhong Li is currently employed by High Throughput Biology Inc. (HTB) and serves as its President. He owns stocks of HTB and has the potential to gain commercially from this publication. No patent was filed at this time on the methods discussed in the manuscript. Dr. Andrea Cal-ifano is currently consulting and on the Advisory Board of High Throughput Biology Inc.(HTB), for whichhe receives a very small monthly compensation. He has no stock nor holds any position in any other company that stands to commercially gain from this publication. He has no fur-ther conflict of interest. No patent was filed at this time on the methods discussed in the manuscript. Dr. Aris Floratos has received consulting fees from High Throughput Biol-ogy Inc. He has no stock nor holds any position in any other company that stands to commercially gain from this publication. He has no further conflict of interest. No pat-ent was filed at this time on the methods discussed in the manuscript. Dr. Tian Zheng has no competing interests.
Acknowledgements
We thank Drs. Fatemeh Haghighi, Peter Gregersen, Wentian Li, and Jurg Ott for many helpful discussions. This work is supported by a Small Busi-ness Innovation Research (SBIR) grant to ZL (2R44CA101432-02A1).
This article has been published as part of BMC Proceedings Volume 1 Sup-plement 1, 2007: Genetic Analysis Workshop 15: Gene Expression Analysis and Approaches to Detecting Multiple Functional Loci. The full contents of the supplement are available online at http://www.biomedcentral.com/ 1753-6561/1?issue=S1.
References
1. Risch N: Searching for genetic determinants in the new mil-lennium. Nature 2000, 405:847-856.
2. Arking D, Pfeufer A, Post W, Kao WH, Newton-Cheh C, Ikeda M, West K, Kashuk C, Akyol M, Perz S, Jalilzadeh S, Illig T, Gieger C, Guo CY, Larson MG, Wichmann HE, Marbán E, O'Donnell CJ, Hirschhorn JN, Kääb S, Spooner PM, Meitinger T, Chakravarti A: A common genetic variant in the NOS1 regulator NOS1AP modulates cardiac repolarization. Nat Genet 2006, 38:644-651.
3. Evans D, Cardon L: Genome-wide association: a promising start to a long race. Trends Genet 2006, 22:350-354.
4. Moore J, Richie M: The challenges of whole-genome approaches to common diseases. JAMA 2004, 291:1642-1643. 5. Lou X, Casella G, Littel R, Yang M, Johnson J, Wu R: A
haplotype-based algorithm for multilocus linkage disequilibrium map-ping of quantitative trait loci with epistasis. Genetics 2003,
163:1533-1548.
6. Tan Q, Christiansen L, Christensen K, Bathum L, Li S, Zhao J, Kruse T: Haplotype association analysis of human disease traits using genotype data of unrelated individuals. Genet Res 2005,
86:233-231.
7. Richie M, Hahn L, Roodi N, Bailey L, Dupont W, Parl F, Moore J: Mul-tifactor-dimensionality reduction reveals high-order interac-tions among estrogen-metabolism genes in sporadic breast cancer. Am J Hum Genet 2001, 69:138-147.
8. Lucek P, Ott J: Neural network analysis of complex traits.
Genet Epidemiol 1997, 14:1101-1106.
9. Zhao J, Jin L, Xiong M: Test for interaction between two unlinked loci. Am J Hum Genet 2006, 79:831-845.
10. Zhang K, Qin Z, Chen T, Liu J, Waterman M, Sun F: HapBlock: hap-lotype block partitioning and tag SNP selection software using a set of dynamic programming algorithms. Bioinformatics
2005, 21:131-134.