R E S E A R C H A R T I C L E
Open Access
Quality of prenatal care questionnaire: instrument
development and testing
Maureen I Heaman
1*†, Wendy A Sword
2†, Noori Akhtar-Danesh
2, Amanda Bradford
3, Suzanne Tough
4,
Patricia A Janssen
5, David C Young
6, Dawn A Kingston
7, Eileen K Hutton
8and Michael E Helewa
9Abstract
Background:Utilization indices exist to measure quantity of prenatal care, but currently there is no published instrument to assess quality of prenatal care. The purpose of this study was to develop and test a new instrument, the Quality of Prenatal Care Questionnaire (QPCQ).
Methods:Data for this instrument development study were collected in five Canadian cities. Items for the QPCQ were generated through interviews with 40 pregnant women and 40 health care providers and a review of prenatal care guidelines, followed by assessment of content validity and rating of importance of items. The preliminary 100-item QPCQ was administered to 422 postpartum women to conduct item reduction using exploratory factor analysis. The final 46-item version of the QPCQ was then administered to another 422 postpartum women to establish its construct validity, and internal consistency and test-retest reliability.
Results:Exploratory factor analysis reduced the QPCQ to 46 items, factored into 6 subscales, which subsequently were validated by confirmatory factor analysis. Construct validity was also demonstrated using a hypothesis testing
approach; there was a significant positive association between women’s ratings of the quality of prenatal care and their satisfaction with care (r= 0.81). Convergent validity was demonstrated by a significant positive correlation (r= 0.63) between the“Support and Respect”subscale of the QPCQ and the“Respectfulness/Emotional Support”subscale of the Prenatal Interpersonal Processes of Care instrument. The overall QPCQ had acceptable internal consistency reliability (Cronbach’s alpha = 0.96), as did each of the subscales. The test-retest reliability result (Intra-class correlation coefficient = 0.88) indicated stability of the instrument on repeat administration approximately one week later. Temporal stability testing confirmed that women’s ratings of their quality of prenatal care did not change as a result of giving birth or between the early postpartum period and 4 to 6 weeks postpartum.
Conclusion:The QPCQ is a valid and reliable instrument that will be useful in future research as an outcome measure to compare quality of care across geographic regions, populations, and service delivery models, and to assess the relationship between quality of care and maternal and infant health outcomes.
Keywords:Prenatal care, Quality of care, Measurement, Instrument, Reliability, Validity, Psychometric testing
Background
The evidence for the effectiveness of prenatal care remains equivocal, despite its widespread use [1,2], and substantial amounts of health care resources “continue to be ex-pended on a tradition of care that has not proven itself equal to the perinatal health issues of today”[3]. Previous
research has frequently relied on prenatal care utilization indices to study the association between adequacy of pre-natal care and pregnancy outcomes [4-6]; however these indices focus solely on quantifying the use of care and do not adequately assess the content or quality of care [1]. Several studies have highlighted the potential importance of content and quality of care [7-14]. In fact, the“role of adequate utilization has more recently been downplayed and greater credence has been given to the importance of the content, comprehensiveness, and quality of prenatal care”[1].
* Correspondence:[email protected] †Equal contributors
1College of Nursing and Departments of Community Health Sciences and
Obstetrics, Gynecology and Reproductive Sciences, College of Medicine, Faculty of Health Sciences, University of Manitoba, 89 Curry Place, Winnipeg R3T 2N2, Manitoba, Canada
Full list of author information is available at the end of the article
The content and quality of prenatal care have been measured in different ways. For example, Beeckman and colleagues recently developed the Content and Timing of Care in Pregnancy (CTP) tool to assess women’s receipt of recommended content based on recommenda-tions in national and international guidelines [8]. Partici-pants recorded the timing and content of prenatal care using diaries. These investigators concluded the content items need further refinement prior to larger scale testing of the new measure [8]. Content has also been measured in studies that examined the effect of adherence to recom-mended prenatal care content, assessed from medical re-cords, on pregnancy outcomes [9-11]. Other studies have investigated the impact of enhanced or augmented pre-natal services [12,13,15] or new models of care, such as group prenatal care [16], on outcomes. The quality of prenatal care has been evaluated using focus groups to ex-plore quality as experienced by women [17-19], develop-ing audit indicators of quality of prenatal care [20], or using checklists, observations and exit interviews [21]. Wong and colleagues developed an instrument to meas-ure the quality of interpersonal processes of care [22], but this instrument measures only one dimension of quality. To date, research on the effectiveness of prenatal care has been hindered by the lack of an instrument that compre-hensively measures quality of prenatal care.
Assessment of prenatal care has focused primarily on women’s satisfaction, but often without clear distinction between the constructs of satisfaction and quality of care. Research to empirically test the relationships be-tween these variables provides evidence that perceived quality affects satisfaction with health care, and that quality of care and consumer satisfaction are distinct constructs [23,24]. Quality is defined as a judgment or evaluation of several dimensions specific to the service being delivered, whereas satisfaction is an affective or emotional response to a specific consumer experience [23,24]. Satisfaction measures tend to include compo-nents that are considered elements of quality, such as structure of service delivery (wait time, continuity of care, physical environment) and process of care (advice received, explanations given by care provider, technical quality of care) [25-27]. These instruments have limita-tions in that they do not discriminate between quantity and quality of care [28], generally lack psychometric evaluation [27], and do not adequately tap varying di-mensions of the uniqueness of prenatal care [27]. Finally, satisfaction measures are insensitive, as most women re-port high levels of satisfaction with prenatal care [25,26], particularly when measured after delivery [29].
Approaches to the assessment of quality of prenatal care have been largely atheoretical. Among the few stud-ies that have based their selection of measures on a the-oretical framework [21,30-32], the two frameworks most
commonly used were Donabedian’s [33,34] model of qual-ity and Aday and Andersen’s [35,36] theoretical frame-work for the study of access to medical care. The latter model is primarily focused on health service utilization is-sues. There is a need to develop a theoretically-grounded measure of prenatal care quality that is distinct from satis-faction measures in order to better evaluate the relation-ship between quality of prenatal care and pregnancy outcomes. The conceptual framework guiding this re-search was Donabedian’s systems-based model of quality health care [34]. The framework encompasses a three-part approach to quality assessment, in which“good structure increases the likelihood of good process, and good process increases the likelihood of a good outcome” [34]. Struc-ture includes attributes of the setting in which care is provided, such as material and human resources and organizational structure [34]. The process component re-flects the actual care given. There are two processes of care: clinical or technical, and interpersonal [37]. Accord-ing to Donabedian, the goodness of technical performance should be judged in comparison with best practice, while interpersonal process is the vehicle by which technical care is implemented and includes information exchange, privacy, informed choice, and sensitivity [34].
In keeping with the findings of qualitative studies that demonstrated the value women place on the interper-sonal processes of prenatal care (including communica-tion, decision-making and interpersonal style), recent attention has been focused on the conceptualization of these processes, their measurement, and their impact on women’s satisfaction and perception of quality of care [7,22]. Research has demonstrated that ineffective com-munication is a barrier to prenatal care utilization [38-40]. Care provider characteristics, such as lack of perceived concern and respect, being task focused and conveying an authoritarian approach, also deter use of prenatal care [40-42]. These characteristics also can be a barrier to women disclosing health concerns [43]. Thus interper-sonal processes are important in keeping women engaged in prenatal care and, ultimately, in enhancing outcomes.
women in the development of measurement instruments [26,27], and only one tool incorporated both women’s and health care providers’perspectives [45].
Purpose and aims of the study
The development of a valid and reliable instrument to measure prenatal care quality is a critical scientific foun-dation for research to monitor the provision and benefits of prenatal health care services. Donabedian states that consumers make an indispensable contribution to defin-ing and evaluatdefin-ing the quality of care [15]. The purpose of this study was to develop and test a new instrument, the Quality of Prenatal Care Questionnaire (QPCQ), to be completed by consumers (women receiving prenatal care). Specific aims were:
1. To generate items for the QPCQ;
2. To conduct content and face validity assessment and exploratory factor analysis of the QPCQ to
determine final items; and
3. To conduct psychometric testing of the final version of the QPCQ.
Methods
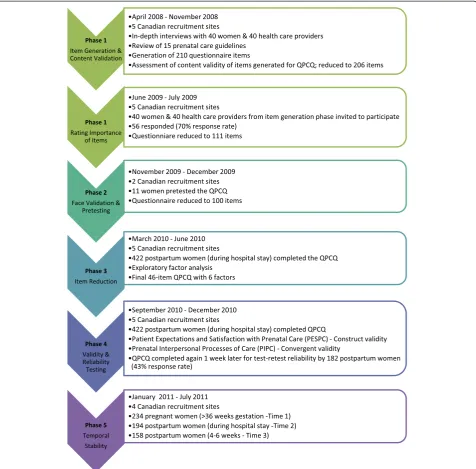
This study addressed the development, validation, and evaluation of a research instrument. Guided by the methodological frameworks for developing measurement scales described by Streiner and Norman [46] and Pett, Lackey and Sullivan [47], the study consisted of five phases implemented over the course of 4 years. Refer to Figure 1 for a flow chart of the five phases. Phase One was development of an instrument to measure quality of prenatal care, and included item generation, content val-idity, rating of importance of items, and item presenta-tion. Phase Two consisted of face validation and pretesting. Phase Three was item reduction using factor analysis. Phase Four involved instrument evaluation, that is, psychometric testing to establish its construct validity, internal consistency reliability, and test-retest reliability. Phase Five involved temporal stability testing. Ethical ap-proval for this study was received from Hamilton Health Sciences/McMaster University Faculty of Health Sciences Research Ethics Board, the University of Manitoba Educa-tion/Nursing Research Ethics Board, the University of Calgary Conjoint Health Research Ethics Board, the IWK Health Centre Research Ethics Board, and the University of British Columbia Clinical Research Ethics Board.
Phase one: item generation, content validation, rating of importance of items, and item presentation
Item generation
The first step of the instrument development process was to generate a comprehensive list of items to represent the various components of the construct quality of prenatal
care. The items for the initial questionnaire were gener-ated from two sources. The first source was a qualitative descriptive study involving in-depth semi-structured inter-views with 40 pregnant women and 40 prenatal care pro-viders from five urban centers across Canada (Vancouver, Calgary, Winnipeg, Hamilton, and Halifax), conducted be-tween April and November 2008. The qualitative descrip-tive study is described in detail elsewhere [48]. In keeping with Donabedian’s suggestion that the goodness of clinical or technical performance should be judged in comparison with best practice [34], the second source of items was a review of the evidence from 15 international guidelines that inform the provision of prenatal care. Table 1 pre-sents a list of the prenatal care guidelines reviewed.
Rating importance of items
A clinimetric or“clinical sensibility”approach was used to select which of the 206 items in the QPCQ would be retained for the next step of instrument development [49]. This approach relied on the judgments of patients and cli-nicians rather than on mathematical (psychometric) tech-niques to determine which items to include [50]. The sample of 40 women and 40 health care providers who participated in the qualitative descriptive study [48] were mailed a copy of the 206-item instrument along with a cover letter and self-addressed, stamped envelope for re-turn in June and July of 2009. Four randomly generated versions of the list of QPCQ items were prepared to avoid response fatigue toward the end of rating all the items. To maximize response rate, a modification of Dillman’s tai-lored design method was utilized, including a reminder letter and second mailing of surveys to respondents [51]. In the cover letter, participants were given the following instructions:“When you rate the items, we are not asking you to reflect on your own experiences with prenatal care. Rather, we would like you to rate how important you think each item is in the care provided by health care profes-sionals to pregnant women using a 7-point rating scale from 1 (not very important) to 7 (extremely important).”
Data for this phase were entered into Microsoft Excel. A mean rating score was generated for each item.
Item presentation
Once the most important items were selected for inclu-sion in the QPCQ, the research team discussed and made decisions regarding instrument format, printed layout, wording of instructions to the subjects, wording and structuring of the items, and response format [47]. Our intent was to develop an instrument suitable for self-administration to pregnant or postpartum women.
Phase two: face validation and pretesting
refers to the appearance of the instrument to a layper-son, and whether the instrument appears to measure the construct [52]. Pretesting was used to ensure that items were clearly written and were being interpreted correctly [46]. Research assistants administered the 111- item ver-sion of the QPCQ to 11 pregnant women in two sites (Winnipeg and Hamilton) between November and December 2009 in a location of the participants’choice (e.g., prenatal care facility, own home). Women were instructed to respond to each item as if they were actu-ally participating in a study, but to mark items that were
difficult to read or confusing. The length of time to complete the QPCQ was recorded. Women were then asked a series of questions by the research assistant about the clarity of the instructions and the items, whether the items appear to be related to the construct of quality of prenatal care, suggestions for alternate wording, items that should be added or removed, and the overall appearance of the instrument. The feedback regarding the quality of prenatal care instrument was discussed by the researchers and revisions were made accordingly.
Phase three: item reduction using exploratory factor analysis The purpose of this step was to further reduce the num-ber of items in the QPCQ by eliminating any that were redundant or not congruent with the overall construct being measured. We aimed to recruit a convenience sample of at least 400 women (approximately 80 women per study site) to participate in the item reduction step. A sample size of 400 women was determined to be suffi-cient as Devillis [53] suggests that a sample size of 200 is adequate in most cases of factor analysis, while Comrey and Lee state that a sample size of 300 is good and 500 is very good [54].
Setting and sample
Subjects were recruited from hospitals providing obstet-rical services in each study site. These hospitals included BC Women’s Hospital, Vancouver, BC; Foothills Hospital, Calgary, AB; St. Boniface General Hospital and Health Sciences Centre Women’s Hospital, Winnipeg, MB; St. Joseph’s Healthcare, Hamilton, ON; and IWK Health Centre, Halifax, NS. Women were eligible to par-ticipate if they had given birth to a singleton live infant, were 16 years of age or older, had at least 3 prenatal care visits, and could read and write English. We excluded women with a known psychiatric disorder that pre-cluded participation in data collection, and women who had a stillbirth or early neonatal death because it would be inappropriate to collect data from these women dur-ing the grievdur-ing process.
Recruitment and data collection procedure
Nursing staff of the postpartum units were asked to identify women who met the inclusion criteria and de-termine their willingness to learn more about the study. Women were then approached by the site research as-sistant (Vancouver, Calgary, Winnipeg, Halifax) or the research coordinator (Hamilton), who provided a verbal explanation and written information about the study. Signed, informed consent was obtained from those who agreed to participate. Participants completed the QPCQ and a brief demographic form, and received a $20 gift certificate in appreciation for their time and contribution to the study. Data collection for Phase Three was con-ducted between March and June 2010.
Data analysis
Exploratory factor analysis was conducted using SPSS Version 18.0. Exploratory factor analysis is used when the researcher does not know how many factors are needed to explain the interrelationships among a set of items, indicators, or characteristics [47]. This analytic approach involves a series of structure-analyzing proce-dures to identify the interrelationships among a large set of observed variables and group the variables into di-mensions or factors that have similar characteristics [47]. First, a correlation matrix was constructed to summarize the interrelationships among the items in the scale [47]. The matrix was examined to identify any items that were either too highly correlated (r≥0.80) or Table 1 Prenatal care guidelines reviewed to generate items for the QPCQ based on“A”grade evidence
Organization name Guideline title Publication date
The American College of Obstetricians and Gynecologists & American Academy of Pediatrics
Guidelines for Perinatal Care (6th edition) October 2007
The American College of Obstetricians and Gynecologists Committee Opinion-Psychological Risk Factors: Perinatal Screening and Intervention
August 2006
The Society of Obstetricians and Gynaecologists of Canada Healthy Beginnings: Guidelines for Care During Pregnancy and Childbirth
December 1998
Fetal Health Surveillance: Antepartum and Intrapartum Consensus Guideline
September 2007
Public Health Agency of Canada Family-Centered Maternity & Newborn Care: National Guidelines 2000
National Institute for Health and Clinical Excellence Antenatal Care: Routine care for healthy pregnant women March 2008
The Royal Australian and New Zealand College of Obstetricians and Gynaecologists
Obstetricians and childbirth responsibilities July 2007
Prenatal screening for trisomy 21, trisomy 18 and neural tube defects July 2007
Mineral and vitamin supplementation in pregnancy July 2008
Antenatal screening tests June 2008
Diagnosis of Gestational Diabetes Mellitus June 2008
Guidelines for the use of Rhd immunoglobulin in Obstetrics in Australia
March 2007
Royal College of Obstetricians and Gynaecologists Clinical Standards: Advice on Planning the Service in Obstetrics and Gynaecology
July 2002
World Health Organization What is the effectiveness of antenatal care? (Supplement) December 2005
not correlated sufficiently with one another (r <0.30), and these items were dropped from the analysis. Ex-ploratory factor analysis was then used to explore the underlying dimensions of the construct of interest [47], since the conceptual framework did not clearly specify a set number of subconcepts or process of care dimen-sions [55,56]. Principal axis factoring was used to extract the factors, followed by oblique rotation using the direct oblimin procedure [55]. We chose oblique rotation because we did not expect the dimensions to be orthog-onal, i.e., uncorrelated with one another. A factor pat-tern matrix was generated, which contained the loadings that represented the unique relationship of each item to a factor, after controlling for the correlation among the factors [47]. Items with weak loadings (less than 0.40) or that did not load reasonably on any factor were deleted.
Phase four: validity and reliability testing
Phase Four involved administering the newly designed 46-item QPCQ to women to establish its construct val-idity, internal consistency reliability, and test-retest reli-ability. Similarly to the previous phase, participants were recruited from hospital postpartum units in each study site using the same eligibility/ineligibility criteria and re-cruitment procedure. Study participants were asked to complete a brief demographic questionnaire, the 46-item QPCQ, the Patient Expectations and Satisfaction with Prenatal Care Instrument (PESPC) [27], and the Prenatal Interpersonal Processes of Care (PIPC) instrument [22]. Women were given a second copy of the QPCQ to be completed 1 week later and returned in a stamped self-addressed envelope. Each participant received a $20 gift certificate in appreciation for their time and contribution to the study. Data collection for Phase Four was con-ducted between September and December 2010.
Construct validity
Validity testing of an instrument is on an ongoing process to determine whether there is sufficient evidence to support that it accurately measures the construct it was designed to measure, and the degree to which it per-forms according to theoretical predictions [57]. First, confirmatory factor analysis was conducted, using the Amos version 7 statistical analysis program, to test the utility of the underlying dimensions of the construct that were previously identified though exploratory factor ana-lysis [47]. A second approach to determining construct validity was through hypothesis testing. According to Donabedian, patient satisfaction is one of the desired outcomes of quality of care [34]. Although different defi-nitions of quality were used, a randomized controlled trial [12] and a cross-sectional study [7] found that women who received “high quality” prenatal care were
significantly more likely to be satisfied with their care. We hypothesized that women who rated the quality of their prenatal care higher would have higher ratings of satisfaction with prenatal care. The Pearson correlation between the total QPCQ score and the satisfaction sub-scale score of the Patient Expectations and Satisfaction with Prenatal Care instrument (PESPC) [27] was esti-mated. The PESPC is a 41-item self-administered questionnaire designed to measure pregnant women’s expectations and satisfaction with the prenatal care they anticipated and received. The PESPC is structurally valid, and the satisfaction subscale demonstrates an ac-ceptable level of internal consistency (Cronbach’s alpha of 0.94). The third approach was to test the convergent validity principle, whereby different measures of the same construct should correlate highly with each other [52]. Although there is no other instrument that mea-sures quality prenatal care in all its dimensions, one in-strument has been developed to measure the quality of interpersonal processes of prenatal care, known as the Prenatal Interpersonal Processes of Care (PIPC) [22]. The PIPC has seven subscales and 30 items that reflect three underlying dimensions: Communication, Patient-Centered Decision Making, and Interpersonal Style. The majority of the seven subscales have acceptable internal consistency reliability (ranging from 0.66 to 0.85) and preliminary evidence of construct validity has been established. It was anticipated that one or more of the PIPC subscales (such as respectfulness/emotional sup-port) would measure similar constructs as one or more of the QPCQ subscales, and if so, the Pearson correl-ation between the subscales would be estimated.
Reliability
Reliability of an instrument is the degree of consistency with which it measures the attribute it is intended to measure [58]. Both internal consistency reliability and test-retest reliability of the QPCQ were assessed.
Internal consistency is based on the average correl-ation among items within a test [59] and assesses homo-geneity or the extent to which all items measure the same construct [58]. Cronbach’s alpha was used to assess the extent to which performance of any one item on the instrument was a good indicator of performance of any other item on the same instrument [57], and was calcu-lated for both the overall scale and each of the subscales. A Cronbach’s alpha coefficient of at least 0.70 is consid-ered acceptable, while 0.80 or greater is desirable [46,59]. In addition, item-to-total scale correlation coeffi-cients for the instrument subscales were examined, as well as whether the Cronbach’s alpha increased if any of the items were deleted.
administration of the instrument to the same sample. As mentioned previously, women participating in this phase of the study were given a second copy of the QPCQ to be completed one week later and returned by mail. This time interval is within the recommended retest interval of 2 to 14 days [46]. For each participant who returned the second questionnaire, their scores on the QPCQ were summed for time one and time two, and the level of agreement between the two sets of scores was deter-mined using the intra-class correlation coefficient (ICC). Reliability coefficients above 0.70 are considered accept-able [58]. For the sample size calculation, the minimal acceptable level of ICC was set at 0.75 and the upper limit of ICC at 0.85, with α= 0.05 and β= 0.20. Using the method suggested by Walter, Eliasziw and Donner [60], a minimum sample size of 79 subjects was needed.
Phase five: temporal stability testing
This phase was conducted to assess whether or not women’s responses to the QPCQ were stable between late pregnancy and the postpartum period, in order to determine whether or not the birth experience and out-come might have influenced women’s recall of quality of care and their responses to the questionnaire. This infor-mation is needed to inform timing of administration of the questionnaire in future research.
For this phase of the study, we collected data from 234 women in four of the study sites. Women were asked to provide background information and complete a package of questionnaires shortly before they gave birth (after 36 weeks gestation) (Time 1), again during their postpar-tum hospital stay (Time 2), and then again 4 to 6 weeks after the baby was born (Time 3). Data collection was conducted between January and July 2011. Mean scores on the total QPCQ and each of the subscales were cal-culated. At first, we used a randomized block design (RBD) analysis of variance to evaluate the differences be-tween the three time points. RBD was used to adjust for the correlations between time points for the same indi-viduals. However, because of an imbalance in the num-ber of participants at different time points and to use the most information available in the data, we followed RBD with conducting a paired t-test between each two time points (i.e., Time 1 and Time 2, Time 1 and Time 3, Time 2 and Time 3). The intra-class correlation coef-ficient (ICC) was used to examine stability of the QPCQ total score and subscale scores across the three time periods.
Results
Phase one: item generation, content validation, rating of importance of items, and item presentation
Results from the qualitative descriptive study [48] and the review of prenatal care guidelines were used to
create a blueprint to establish the specific scope and em-phasis of our instrument to measure quality of prenatal care, including the major domains to be assessed [52]. The Co-Principal Investigators (MIH & WAS) generated an initial list of 210 items for the preliminary version of the Quality of Prenatal Care Questionnaire (QPCQ). Several of the items were generated from the interview data that informed the development of themes. These themes were organized into three main categories in-formed by the structure and process components of Donabedian’s [34] model of quality health care. Structure of care themes included access to care, staff and provider characteristics, and the physical setting. Themes under clinical care processes included screening and assess-ment, health promotion and illness prevention, continu-ity of care, information sharing, women-centeredness, and non-medicalization of pregnancy. Themes concern-ing interpersonal care processes included emotional sup-port, approachable interaction style, taking time, and respectful attitude [48]. Items generated from the guide-line review reflected components of prenatal care rated as having a high certainty of net benefit (i.e., “A” grade evidence) [61]). The research team then met to review and discuss the list of 210 items, and as the content ex-perts, assessed the content validity of the QPCQ by evaluating each item for its relevance and clarity, and for any repetition of items. Four items judged to duplicate other items were removed.
Ratings of the importance of the 206 items for the QPCQ were received from 56 participants (70% response rate). The overall top 100 items that were rated as most important were retained for the next version of the in-strument; these items had a mean rating of 5.7 or higher on a scale of 1 to 7. In order to ensure that the perspec-tives of women and health care providers were equally represented, we also added any items ranked in the top 50 from either women or providers that were not in the overall top 100. Because there was generally good con-gruence between women and providers in rating the im-portance of items, this resulted in only 3 items with high ratings from health care providers and 2 items from women being added to the top 100 items. Six items de-rived from A-level evidence but not in the top 100 items were also retained. These steps resulted in a QPCQ with 111 items.
when all items are written as positive [46]. The 111 items were then formatted into the initial version of the QPCQ with the following instructions: “This question-naire asks about the prenatal care you received from a physician, midwife, or other health care providers during your pregnancy. You might have seen more than one health care provider for your care but please think of the prenatal care you received overall when completing this questionnaire. Please read each statement carefully and indicate how much you agree or disagree with it by circ-ling the appropriate number.”
Phase two: face validation and pretesting
During the pretesting phase, the mean length of time for women to complete the 111-item version of the QPCQ ranged from 10 to 23 minutes, with a mean of 16 mi-nutes. Women indicated that the QPCQ was easy to complete, and only a few items were identified as poten-tially problematic. Based on this feedback, 11 items were removed from the QPCQ, either because the item was too vague (e.g., “My prenatal care provider was thor-ough”) or the item was not universally applicable to all pregnant women (e.g., “My prenatal care provider took time to answer my partner’s/family member’s ques-tions”). This resulted in a 100-item questionnaire. In addition, four items underwent wording changes to im-prove their clarity or completeness (e.g., The item“I fully understood the reasons for tests my prenatal care pro-vider (s) ordered for me” was changed to“I fully under-stood the reasons for blood work and other tests my prenatal care provider (s) ordered for me”).
Phase three: item reduction using exploratory factor analysis The final sample for Phase Three consisted of 422 par-ticipants. Demographic characteristics of the participants are summarized in Table 2; cases with missing data on each item were excluded from the analyses. Use of ex-ploratory factor analysis extracted 5-, 6- and 7-factor so-lutions. The researchers examined the 3 solutions, and selected the 6-factor solution because the items were judged to be the most relevant and grouped into factors in the most meaningful way based on our clinical know-ledge and experience. The 6-factor solution reduced the QPCQ to 46 items. These final factors or dimensions comprised the subscales of the QPCQ; the research team met to agree on the names to be assigned to each factor. The six factors are as follows:
1. Information Sharing: The 9 items within this factor focus on how prenatal care providers answer questions, keep information confidential, and ensure women understand reasons for tests and their results. 2. Anticipatory Guidance: The 11 items in this factor
focus on women being given enough information to
make decisions about their prenatal care and how their prenatal care providers prepare and give women options for their birth experience.
3. Sufficient Time: The 4 items within this factor focus on the time prenatal care providers spend
addressing women’s questions and the time spent in an appointment.
4. Approachability: The 4 items in this factor address the health care provider’s approachability (e.g., woman was afraid to ask questions, felt like she was wasting prenatal care provider’s time).
5. Availability: The 5 items in this factor include knowing how to contact the prenatal care provider and how available the clinic/office staff or prenatal care provider are to respond to questions, concerns or needs. 6. Support and Respect: This factor has 12 items
related to women being respected and supported by their prenatal care providers in regard to their concerns and decisions.
We used the Flesch-Kincaid Grade Level test, available in Microsoft Word, to assess the readability of the 46-item QPCQ. This test rates text on a U. S. school grade level, which is similar to the Canadian grade level sys-tem. The QPCQ had a Flesch-Kincaid grade level score of 8.7, which means that women with a grade 9 educa-tion can read and understand the items in the QPCQ.
Phase four: validity and reliability testing
The final sample for Phase Four consisted of 422 women. Demographic characteristics of the participants are sum-marized in Table 2.
Confirmatory factor analysis verified and confirmed the presence of six factors, and all 46 items were there-fore retained in the QPCQ. Refer to Table 3 for a list of the items loading on each factor. The factor (or sub-scale) means and standard deviations are presented in Table 4. Each subscale mean score was calculated by first reversing the scores of any reverse scored items in the subscale, then summing the scores for the items of the subscale and dividing the sum by the number of items. The QPCQ is a norm-referenced measure, in which an individual’s score takes on meaning when compared with the scores of others (e.g., in the same sample) [46]. Higher scores on the QPCQ and its subscales reflect a higher rating of quality of prenatal care. The mean scores for the factors ranged from 3.84 to 4.37 out of a total score of 5, indicating that women rated the quality of their prenatal care toward the higher end of the con-tinuum. The factor “Anticipatory Guidance” had the lowest mean rating, while“Information Sharing”had the highest mean rating.
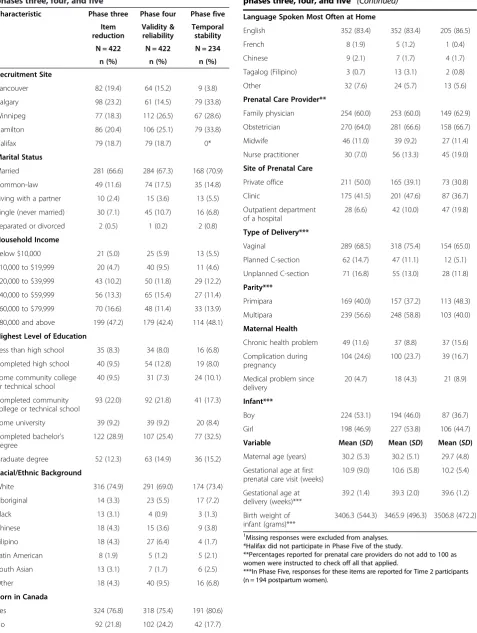
Table 2 Demographic characteristics of participants in phases three, four, and five1
Characteristic Phase three Phase four Phase five
Item
Vancouver 82 (19.4) 64 (15.2) 9 (3.8)
Calgary 98 (23.2) 61 (14.5) 79 (33.8)
Winnipeg 77 (18.3) 112 (26.5) 67 (28.6)
Hamilton 86 (20.4) 106 (25.1) 79 (33.8)
Halifax 79 (18.7) 79 (18.7) 0*
Marital Status
Married 281 (66.6) 284 (67.3) 168 (70.9)
Common-law 49 (11.6) 74 (17.5) 35 (14.8)
Living with a partner 10 (2.4) 15 (3.6) 13 (5.5)
Single (never married) 30 (7.1) 45 (10.7) 16 (6.8)
Separated or divorced 2 (0.5) 1 (0.2) 2 (0.8)
Household Income
Below $10,000 21 (5.0) 25 (5.9) 13 (5.5)
$10,000 to $19,999 20 (4.7) 40 (9.5) 11 (4.6)
$20,000 to $39,999 43 (10.2) 50 (11.8) 29 (12.2)
$40,000 to $59,999 56 (13.3) 65 (15.4) 27 (11.4)
$60,000 to $79,999 70 (16.6) 48 (11.4) 33 (13.9)
$80,000 and above 199 (47.2) 179 (42.4) 114 (48.1)
Highest Level of Education
Less than high school 35 (8.3) 34 (8.0) 16 (6.8)
Completed high school 40 (9.5) 54 (12.8) 19 (8.0)
Some community college
Some university 39 (9.2) 39 (9.2) 20 (8.4)
Completed bachelor’s degree
122 (28.9) 107 (25.4) 77 (32.5)
Graduate degree 52 (12.3) 63 (14.9) 36 (15.2)
Racial/Ethnic Background
White 316 (74.9) 291 (69.0) 174 (73.4)
Aboriginal 14 (3.3) 23 (5.5) 17 (7.2)
Black 13 (3.1) 4 (0.9) 3 (1.3)
Yes 324 (76.8) 318 (75.4) 191 (80.6)
No 92 (21.8) 102 (24.2) 42 (17.7)
Table 2 Demographic characteristics of participants in
phases three, four, and five1(Continued)
Language Spoken Most Often at Home
English 352 (83.4) 352 (83.4) 205 (86.5)
French 8 (1.9) 5 (1.2) 1 (0.4)
Chinese 9 (2.1) 7 (1.7) 4 (1.7)
Tagalog (Filipino) 3 (0.7) 13 (3.1) 2 (0.8)
Other 32 (7.6) 24 (5.7) 13 (5.6)
Prenatal Care Provider**
Family physician 254 (60.0) 253 (60.0) 149 (62.9)
Obstetrician 270 (64.0) 281 (66.6) 158 (66.7)
Midwife 46 (11.0) 39 (9.2) 27 (11.4)
Nurse practitioner 30 (7.0) 56 (13.3) 45 (19.0)
Site of Prenatal Care
Private office 211 (50.0) 165 (39.1) 73 (30.8)
Clinic 175 (41.5) 201 (47.6) 87 (36.7)
Outpatient department of a hospital
28 (6.6) 42 (10.0) 47 (19.8)
Type of Delivery***
Vaginal 289 (68.5) 318 (75.4) 154 (65.0)
Planned C-section 62 (14.7) 47 (11.1) 12 (5.1)
Unplanned C-section 71 (16.8) 55 (13.0) 28 (11.8)
Parity***
Primipara 169 (40.0) 157 (37.2) 113 (48.3)
Multipara 239 (56.6) 248 (58.8) 103 (40.0)
Maternal Health
Chronic health problem 49 (11.6) 37 (8.8) 37 (15.6)
Complication during
Girl 198 (46.9) 227 (53.8) 106 (44.7)
Variable Mean (SD) Mean (SD) Mean (SD)
Maternal age (years) 30.2 (5.3) 30.2 (5.1) 29.7 (4.8)
Gestational age at first
3406.3 (544.3) 3465.9 (496.3) 3506.8 (472.2)
1
Missing responses were excluded from analyses. *Halifax did not participate in Phase Five of the study.
**Percentages reported for prenatal care providers do not add to 100 as women were instructed to check off all that applied.
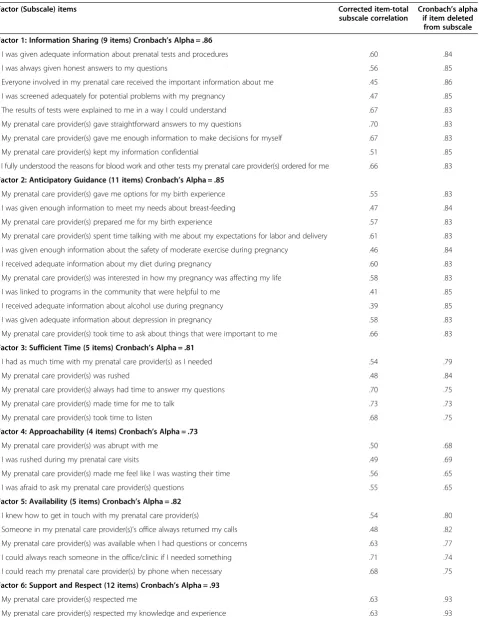
Table 3 Items loading on each factor, corrected item-total subscale correlations, and Cronbach’s alpha if item deleted from subscale
Factor (Subscale) items Corrected item-total
subscale correlation
Cronbach’s alpha if item deleted
from subscale
Factor 1: Information Sharing (9 items) Cronbach’s Alpha = .86
- I was given adequate information about prenatal tests and procedures .60 .84
- I was always given honest answers to my questions .56 .85
- Everyone involved in my prenatal care received the important information about me .45 .86
- I was screened adequately for potential problems with my pregnancy .47 .85
- The results of tests were explained to me in a way I could understand .67 .83
- My prenatal care provider(s) gave straightforward answers to my questions .70 .83
- My prenatal care provider(s) gave me enough information to make decisions for myself .67 .83
- My prenatal care provider(s) kept my information confidential .51 .85
- I fully understood the reasons for blood work and other tests my prenatal care provider(s) ordered for me .66 .83
Factor 2: Anticipatory Guidance (11 items) Cronbach’s Alpha = .85
- My prenatal care provider(s) gave me options for my birth experience .55 .83
- I was given enough information to meet my needs about breast-feeding .47 .84
- My prenatal care provider(s) prepared me for my birth experience .57 .83
- My prenatal care provider(s) spent time talking with me about my expectations for labor and delivery .61 .83
- I was given enough information about the safety of moderate exercise during pregnancy .46 .84
- I received adequate information about my diet during pregnancy .60 .83
- My prenatal care provider(s) was interested in how my pregnancy was affecting my life .58 .83
- I was linked to programs in the community that were helpful to me .41 .85
- I received adequate information about alcohol use during pregnancy .39 .85
- I was given adequate information about depression in pregnancy .58 .83
- My prenatal care provider(s) took time to ask about things that were important to me .66 .83
Factor 3: Sufficient Time (5 items) Cronbach’s Alpha = .81
- I had as much time with my prenatal care provider(s) as I needed .54 .79
- My prenatal care provider(s) was rushed .48 .84
- My prenatal care provider(s) always had time to answer my questions .70 .75
- My prenatal care provider(s) made time for me to talk .73 .73
- My prenatal care provider(s) took time to listen .68 .75
Factor 4: Approachability (4 items) Cronbach’s Alpha = .73
- My prenatal care provider(s) was abrupt with me .50 .68
- I was rushed during my prenatal care visits .49 .69
- My prenatal care provider(s) made me feel like I was wasting their time .56 .65
- I was afraid to ask my prenatal care provider(s) questions .55 .65
Factor 5: Availability (5 items) Cronbach’s Alpha = .82
- I knew how to get in touch with my prenatal care provider(s) .54 .80
- Someone in my prenatal care provider(s)’s office always returned my calls .48 .82
- My prenatal care provider(s) was available when I had questions or concerns .63 .77
- I could always reach someone in the office/clinic if I needed something .71 .74
- I could reach my prenatal care provider(s) by phone when necessary .68 .75
Factor 6: Support and Respect (12 items) Cronbach’s Alpha = .93
- My prenatal care provider(s) respected me .63 .93
PESPC provided additional support for construct validity (Pearsonr= 0.81). Convergent validity was demonstrated by a significant positive correlation (r= 0.63) between the “Support and Respect” subscale of the QPCQ and the “Respectfulness/Emotional Support” subscale of the PIPC, and a significant positive correlation (r= 0.59) be-tween the“Anticipatory Guidance”subscale of the QPCQ and the“Empowerment/Self-care”subscale of the PIPC.
Testing showed acceptable internal consistency reli-ability for the overall scale (Cronbach’s alpha = 0.96) and for the six subscales (ranging from 0.73-0.93). Refer to Table 3 for the results. Item-total scale correlation coef-ficients were positive, and the Cronbach’s alpha did not increase if any of the items were deleted, with the excep-tion of one item, “My prenatal care provider was rushed,”showing a slight increase.
Of the 422 participants, 182 women (43%) completed the retest version of the QPCQ 5 to 14 days later and returned it by mail. The QPCQ demonstrated acceptable test-retest reliability (ICC = 0.88), indicating stability of the instrument on repeat administration.
Phase five: temporal stability testing
Demographic characteristics of the participants in Phase Five (Time 1) are summarized in Table 2, and the sam-ple size for each site and time period is shown in Table 5.
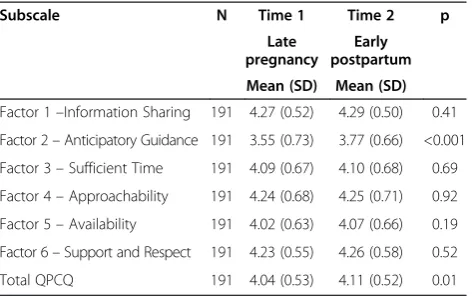
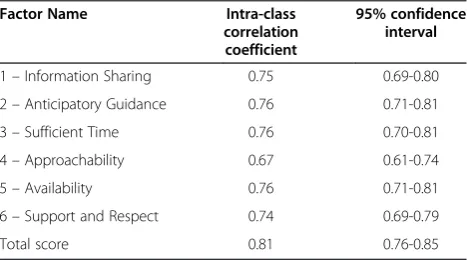
There were 234 participants at Time 1, 194 at Time 2, and 158 at Time 3, demonstrating some attrition over time. There were no statistically significant differences in mean scores across time periods for the majority of the QPCQ subscales (Tables 6, 7, and 8). Although there was a significant difference in mean score for the Antici-patory Guidance subscale between Time 1 and 2 (d= 0.22) and between Time 1 and 3 (d= 0.17), and for the mean QPCQ score between Time 1 and 2 (d= 0.07), the differences in mean scores were small and deemed not to be clinically significant. The intra-class correlation co-efficient (ICC) was also used to examine stability of the QPCQ subscale scores across the three time periods, and varied from 0.67 to 0.76 (Table 9). The ICC for the total QPCQ score was 0.81 (95% CI: 0.76-0.85).
Discussion
Measurement of the quality of prenatal care is an essen-tial step in more fully evaluating its effectiveness. We have developed a new instrument, the Quality of Pre-natal Care Questionnaire (QPCQ), through a rigorous process of item generation and psychometric testing. The QPCQ was designed to be completed by women who received prenatal care, consistent with growing ac-knowledgement of the value of the consumer’s viewpoint in evaluating quality of health care [22,23,62,63]. The final 46-item version of the QPCQ demonstrated con-struct validity, as well as acceptable internal consistency and test-retest reliability. Having women complete the QPCQ before delivery, during their postpartum hospital stay, and again 4 to 6 weeks after delivery confirmed that women’s ratings of their quality of prenatal care did not change as a result of giving birth or between the early postpartum period and 4 to 6 weeks postpartum. These results suggest that the QCPQ can be administered to a woman after 36 weeks gestation and up to 6 weeks postpartum.
Exploratory factor analysis resulted in a six-factor so-lution for the QPCQ, with six factors retained in the
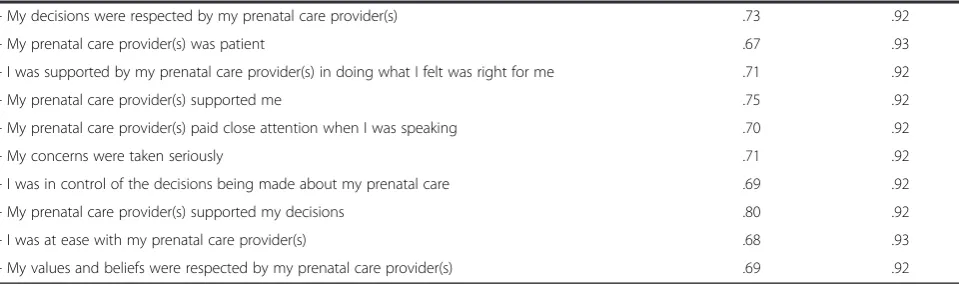
Table 3 Items loading on each factor, corrected item-total subscale correlations, and Cronbach’s alpha if item deleted
from subscale(Continued)
- My decisions were respected by my prenatal care provider(s) .73 .92
- My prenatal care provider(s) was patient .67 .93
- I was supported by my prenatal care provider(s) in doing what I felt was right for me .71 .92
- My prenatal care provider(s) supported me .75 .92
- My prenatal care provider(s) paid close attention when I was speaking .70 .92
- My concerns were taken seriously .71 .92
- I was in control of the decisions being made about my prenatal care .69 .92
- My prenatal care provider(s) supported my decisions .80 .92
- I was at ease with my prenatal care provider(s) .68 .93
- My values and beliefs were respected by my prenatal care provider(s) .69 .92
Table 4 QPCQ factor (or subscale) means and standard deviations (SD) from phase four (N = 422)
Subscale Mean (SD)
Factor 1–Information Sharing 4.37 (0.50)
Factor 2–Anticipatory Guidance 3.84 (0.60)
Factor 3–Sufficient Time 4.16 (0.65)
Factor 4–Approachability 4.22 (0.71)
Factor 5–Availability 4.18 (0.65)
Factor 6–Support and Respect 4.35 (0.52)
confirmatory factor analysis. This indicates that the con-cept of quality of prenatal care is multidimensional and the instrument consists of six subscales [56]. In addition to the total QPCQ score, the score for each of the sub-scales can be examined separately. The derived factors made conceptual sense, and were consistent with the themes arising from our qualitative descriptive study [48]. The six subscales of the QPCQ measure both structure and process attributes of Donabedian’s model, with more emphasis on clinical and interpersonal pro-cesses of care. Although the initial draft of the QPCQ contained several items related to structure of prenatal care, many of these items were rated low on importance in Phase One and were subsequently deleted from the questionnaire (e.g.,“The office/clinic was in a convenient location,” “The waiting area was crowded.”). This is con-sistent with Campbell’s viewpoint that structure is not a component of care“but the conduit through which care is delivered and received” [37]. As such, structure may influence the way in which care is provided and thus women’s assessment of quality. For example, having ad-equate funding, facilities and personnel may influence women’s responses to items in the“Sufficient Time” sub-scale (e.g., “I had as much time with my prenatal care provider as I needed”) and the“Availability”subscale (e.g., “I could always reach someone in the office/clinic if I
needed something”). Items in the QPCQ “Information Sharing”and“Anticipatory Guidance”subscales primarily measured the clinical or technical processes of care, while items in the“Approachability”and“Support and Respect” subscales reflected interpersonal processes. Mean scores for the subscales ranged from 3.84 to 4.37, and indicated that women rated the quality of“Anticipatory Guidance” the lowest, and “Information Sharing” and “Support and Respect” the highest (Table 4). In the temporal stability testing phase, the Anticipatory Guidance subscale was the only one showing significant (although small) differences in mean scores over time, with both postpartum scores being higher than the prenatal score. Some of the Antici-patory Guidance items may be more accurately assessed by women in the postpartum period (e.g., “I was given enough information to meet my needs about breastfeed-ing”), possibly resulting in higher rating scores.
The subscales and items in the QPCQ measure com-ponents of quality of prenatal care identified by women as important in other qualitative studies [17-19] and an integrative review [64]. Wheatley and colleagues found that markers of quality prenatal care included the extent to which the provider listened carefully, showed respect, explained things, and spent enough time with the woman [18]. The main elements of quality of maternity care ser-vices identified in Goberna-Tricas’s study were technical Table 5 Number of participants per site for each time period in phase five of the study
Recruitment site
Before delivery QPCQ–T1*
After delivery QPCQ–T2*
4-6 week QPCQ–T3*
Total matched T1/T2
Total matched T2/T3
Total matched T1/T2/T3
n (%) n (%) n (%) n (%) n (%) n (%)
Vancouver 9 (4) 6 (3) 5 (2) 6 (3) 5 (2) 5 (2)
Calgary 79 (33) 77 (32) 65 (27) 74 (31) 64 (27) 62 (26)
Winnipeg 67 (28) 42 (18) 32 (14) 42 (18) 32 (14) 32 (14)
Hamilton 79 (33) 69 (29) 56 (24) 69 (29) 56 (24) 56 (24)
SUBTOTAL 234 194 158 191 157 155
*T1 = time one, T2 = time two, T3 = time three.
Table 6 Comparison of QPCQ subscale and total scores between Time 1 and Time 2 in Phase five, using paired t-test
Subscale N Time 1 Time 2 p
Late pregnancy
Early postpartum
Mean (SD) Mean (SD)
Factor 1–Information Sharing 191 4.27 (0.52) 4.29 (0.50) 0.41
Factor 2–Anticipatory Guidance 191 3.55 (0.73) 3.77 (0.66) <0.001
Factor 3–Sufficient Time 191 4.09 (0.67) 4.10 (0.68) 0.69
Factor 4–Approachability 191 4.24 (0.68) 4.25 (0.71) 0.92
Factor 5–Availability 191 4.02 (0.63) 4.07 (0.66) 0.19
Factor 6–Support and Respect 191 4.23 (0.55) 4.26 (0.58) 0.52
Total QPCQ 191 4.04 (0.53) 4.11 (0.52) 0.01
Table 7 Comparison of QPCQ subscale and total scores between Time 1 and Time 3 in Phase five, using paired t-test
Subscale N Time 1 Time 3 p
Late pregnancy
4-6 weeks postpartum
Mean (SD) Mean (SD)
Factor 1–Information Sharing 155 4.29 (0.45) 4.27 (0.44) 0.43
Factor 2–Anticipatory Guidance 155 3.53 (0.70) 3.70 (0.67) <0.001
Factor 3–Sufficient Time 155 4.11 (0.64) 4.12 (0.56) 0.73
Factor 4–Approachability 155 4.30 (0.60) 4.31 (0.61) 0.75
Factor 5–Availability 155 4.02 (0.58) 4.04 (0.68) 0.70
Factor 6–Support and Respect 155 4.25 (0.51) 4.25 (0.51) 0.97
expertise of the health professional, the human dimension of the relationship between the caregiver and the patient (interpersonal skill), and the structural aspects that deter-mine the context in which the health care is provided [17]. Hildingsson and Thomas analyzed responses of 827 Swedish pregnant women to an open ended question in a survey, and grouped the findings into the following cat-egories: technical aspects of care (being skilled and com-petent), psychological aspects of care (being a good listener, being supportive, treating the woman with re-spect), personal characteristics (not judging, not being rushed), health-related content and information (checking the baby’s health, providing information about physical and mental changes and breastfeeding), and structural as-pects of provider visits (enough time during visits, con-tinuity of care) [19]. The items in the QPCQ capture the majority of these aforementioned elements of quality of prenatal care.
Strengths and limitations of the study
The QPCQ was developed taking into consideration effective prenatal care practices, the diversity of the Canadian population, and variations in the way prenatal care is delivered, and with input from both consumers
and providers of care. The five study sites provided a broad cross-section of the childbearing population in Canada and its multicultural uniqueness. For instance, Winnipeg has a large and growing Aboriginal popula-tion, Vancouver has a high concentration of immigrants from East Asia, and Halifax serves a large rural popula-tion. Similarly, there are differences in the options for prenatal care available to women across the five study sites. Midwifery care was not regulated or integrated into the health care system in Nova Scotia at the time of this study, but was more widely available to women liv-ing in certain areas of Ontario, such as Hamilton, and other provinces where midwifery was a regulated profes-sion. In some provinces, obstetricians were the most com-mon provider of prenatal care (e.g., Ontario) compared to family physicians in others (e.g., British Columbia) [65]. Finally, some prenatal programs had integrated additional or substitutive prenatal care through nurse specialists and nurse practitioners [66]. The study protocol thereby en-sured the development of an instrument that captured core elements of quality applicable to the Canadian popu-lation as a whole under a system of universal health care.
Our study also has limitations. The QPCQ was devel-oped in the context of the Canadian health care system, so its applicability to health care systems, prenatal care provision, or populations that are substantively different will need to be assessed prior to widespread use. The in-strument was intended to be applicable to all pregnant women; therefore the items may not fully capture all elements of quality in specific situations, such as care provided to women with a complicated or high risk pregnancy. The QPCQ reflects the woman’s perception of the quality of prenatal care she received; further re-search is needed to determine the congruence between the woman’s assessment of quality and the extent to which the care she received conformed to guidelines for prenatal care using methods such as chart audits. The relatively high mean scores found among some of the QPCQ subscales may be a reflection of selection bias in-curred as a result of using a convenience sample, in that women who agreed to participate in the study may have viewed the quality of their care more positively than women who declined participation. In addition, the re-sponse rate for completion of the retest version of the QPCQ was relatively low (43%), although the number of respondents (n = 182) exceeded the minimum sample size of 79 estimated as needed in the sample size calculation.
Finally, we acknowledge there are competing views re-garding use of non-parametric versus parametric statis-tics to analyze Likert scales [67,68]. Although individual Likertitemsare ordinal in character, we support the pos-ition that Likert scales (collections of Likert items) pro-duce interval data, and that it is appropriate to summarize the ratings generated from Likert scales using means and Table 8 Comparison of QPCQ subscale and total scores
between Time 2 and Time 3 in Phase five, using paired t-test
Subscale N Time 2 Time 3 p
Early postpartum
4-6 weeks postpartum
Mean (SD) Mean (SD)
Factor 1–Information Sharing 157 4.31 (0.44) 4.26 (0.44) 0.05
Factor 2–Anticipatory Guidance 157 3.77 (0.64) 3.69 (0.67) 0.02
Factor 3–Sufficient Time 157 4.14 (0.60) 4.12 (0.56) 0.47
Factor 4–Approachability 157 4.31 (0.65) 4.31 (0.60) 0.99
Factor 5–Availability 157 4.08 (0.60) 4.04 (0.68) 0.16
Factor 6–Support and Respect 157 4.27 (0.54) 4.25 (0.50) 0.36
Total QPCQ 157 4.13 (0.47) 4.09 (0.48) 0.05
Table 9 Intra-class correlation coefficients for QPCQ subscales across three time points in Phase five
Factor Name Intra-class correlation coefficient
95% confidence interval
1–Information Sharing 0.75 0.69-0.80
2–Anticipatory Guidance 0.76 0.71-0.81
3–Sufficient Time 0.76 0.70-0.81
4–Approachability 0.67 0.61-0.74
5–Availability 0.76 0.71-0.81
6–Support and Respect 0.74 0.69-0.79
standard deviations, and to use parametric statistics to analyze the scales [68]. Health care providers may find it helpful to examine the rank order of (dis)agreement for individual items on the QPCQ to identify specific aspects of prenatal care in need of quality improvement. However, for research using the QPCQ, we agree with Carifio and Perla’s view that treating the data from Likert scales as interval in character permits“more powerful and nuanced analyses”[68].
Recommendations for future research
This valid and reliable instrument can now be used as an outcome measure to evaluate quality of prenatal care, to identify predictors of quality of prenatal care, to com-pare and contrast quality of prenatal care across regions, populations, and types of health care providers and ser-vice delivery models, and to assess the relationship be-tween quality of care and a variety of maternal and infant health outcomes. The outcomes studied should not be limited to gestational age and birth weight, but rather encompass a range of health status and behavioral indicators. As noted by Alexander and Kotelchuck, “there are several other perinatal outcomes that may be modified by prenatal care” [1]. Rosenberg has suggested that attention should be given to studying the effect of optimal prenatal care on maternal self-esteem, attach-ment, connections to both the health care system and social services, and maternal physical and mental health [69]. Other appropriate outcomes include postnatal health status of mother and infant, the adoption and maintenance of healthy behaviors, disclosure of sensitive concerns, postpartum behaviors, maternal and infant health care utilization, and infant injury and disease rates [1]. The relationship between quality of care and a variety of outcomes may have implications for allocation of resources, program planning, and policy development. With a valid and reliable QPCQ, researchers and decision makers will be well positioned to collect evidence that can be used to design and refine programs to improve women’s experiences and enhance perinatal outcomes.
Conclusions
The QPCQ is a new self-report instrument that mea-sures overall quality of prenatal care, and quality of care for six factors or subscales. Following a rigorous process of development and psychometric testing, the QPCQ has been shown to demonstrate construct validity, in-ternal consistency reliability, and test-retest reliability. This valid and reliable instrument will be useful in future research to evaluate women’s perceptions of quality of prenatal care, to compare quality of care across regions, populations, types of health care provider, and service delivery models, and to assess the relationship between
quality of care and a variety of maternal and infant health outcomes.
Abbreviations
QPCQ:Quality of Prenatal Care Questionnaire; CTP: Content and timing of care in pregnancy tool; PESPC: Patient Expectations and Satisfaction with Prenatal Care instrument; PIPC: Prenatal Interpersonal Processes of Care instrument; ICC: Intra-class correlation coefficient; RBD: Randomized block design.
Competing interests
The authors declare that they have no competing interests.
Authors’contributions
WAS and MIH wrote the grant application, directed the implementation of the study protocol, and had overall responsibility for the research. All authors contributed to conception and design of the study, and interpretation of the results, with input from the collaborators. AB coordinated the study. MIH, WAS, ST, PAJ, and DCY supervised participant recruitment in their respective sites. NA-D performed data analysis, assisted by AB. MIH drafted the manuscript. All authors provided feedback on the draft manuscript, and read and approved the final manuscript.
Acknowledgements
This study was funded by an operating grant from the Canadian Institutes of Health Research (CIHR) (MOP - 84427). Dr. Heaman received career support from a CIHR Chair in Gender and Health award. We thank our collaborators for their contributions to the study: Melanie Basso (Vancouver), Laurie Blahitka (Calgary), Patricia Gregory (Winnipeg), Lynda Tjaden (Winnipeg), Jackie Barrett (Hamilton), Glenda Carson (Halifax), and Kate Lively (Halifax).
The QPCQ is licensed under a Creative Commons Attribution–Non Commercial–No Derivatives 4.0 International License. © Copyright 2013. W. Sword, M. Heaman, and the QPCQ Research Team. McMaster University. All rights reserved.
Author details
1
College of Nursing and Departments of Community Health Sciences and Obstetrics, Gynecology and Reproductive Sciences, College of Medicine, Faculty of Health Sciences, University of Manitoba, 89 Curry Place, Winnipeg R3T 2N2, Manitoba, Canada.2School of Nursing and Department of Clinical
Epidemiology and Biostatistics, Faculty of Health Sciences, McMaster University, 1280 Main Street West, Hamilton L8S 4K1, Ontario, Canada.
3
Gilbrea Centre for Studies in Aging, McMaster University, 1280 Main Street West, Hamilton L8S 4M4, Ontario, Canada.4Departments of Paediatrics and
Community Health Sciences, Faculty of Medicine, University of Calgary, 2888 Shaganappi Trail NW, Calgary T3B 6A8, Alberta, Canada.5School of
Population and Public Health, University of British Columbia, 2206 East Mall, Vancouver V6N 1Z3, British Columbia, Canada.6Department of Obstetrics
and Gynecology, IWK Health Centre, Dalhousie University, 5980 University Avenue, P.O. Box 9700, Halifax B3K 6R8, Nova Scotia, Canada.7Faculty of
Nursing, University of Alberta, 5-258 Edmonton Clinic Health Academy, 11405-87th Avenue, Edmonton T6G 1C9, Alberta, Canada.8Department of
Obstetrics and Gynecology and Department of Clinical Epidemiology and Biostatistics, Faculty of Health Sciences, McMaster University, 1280 Main Street West, Hamilton L8S 4K, Ontario, Canada.9Department of Obstetrics, Gynecology and Reproductive Sciences, College of Medicine, Faculty of Health Sciences, University of Manitoba, 735 Notre Dame Avenue, University of Manitoba, Winnipeg R3T 2N2, Manitoba, Canada.
Received: 16 September 2013 Accepted: 16 May 2014 Published: 3 June 2014
References
2. Lu MC, Tache V, Alexander GR, Kotelchuck M, Halfon N:Preventing low birth weight: is prenatal care the answer?J Matern Fetal Neonatal Med
2003,13(6):362–380.
3. Moos MK:Prenatal care: limitations and opportunities.J Obstet Gynecol Neonatal Nurs2006,35(2):278–285.
4. Heaman MI, Newburn-Cook CV, Green CG, Elliott LJ, Helewa ME:Inadequate prenatal care and its association with adverse pregnancy outcomes: a comparison of indices.BMC Pregnancy Childbirth2008,8:15.
5. VanderWeele TJ, Lantos JD, Siddique J, Lauderdale DS:A comparison of four prenatal care indices in birth outcome models: comparable results for predicting small-for-gestational-age outcome but different results for preterm birth or infant mortality.J Clin Epidemiol2009,62(4):438–445. 6. Partridge S, Balayla J, Holcroft CA, Abenhaim HA:Inadequate prenatal care
utilization and risks of infant mortality and poor birth outcome: a retrospective analysis of 28,729,765 U.S. deliveries over 8 years.Am J Perinatol2012,29(10):787–794.
7. Korenbrot CC, Wong ST, Stewart AL:Health promotion and psychosocial services and women’s assessments of interpersonal prenatal care in Medicaid managed care.Matern Child Health J2005,9(2):135–149. 8. Beeckman K, Louckx F, Masuy-Stroobant G, Downe S, Putman K:The
development and application of a new tool to assess the adequacy of the content and timing of antenatal care.BMC Health Serv Res2011,
11:213.
9. Kogan MD, Alexander GR, Kotelchuck M, Nagey DA:Relation of the content of prenatal care to the risk of low birth weight. Maternal reports of health behavior advice and initial prenatal care procedures.JAMA
1994,271(17):1340–1345.
10. White DE, Fraser-Lee NJ, Tough S, Newburn-Cook CV:The content of prenatal care and its relationship to preterm birth in Alberta.Canada Health Care Women Int2006,27(9):777–792.
11. Handler A, Rankin K, Rosenberg D, Sinha K:Extent of documented adherence to recommended prenatal care content: provider site differences and effect on outcomes among low-income women.Matern Child Health J2012,16(2):393–405.
12. Klerman LV, Ramey SL, Goldenberg RL, Marbury S, Hou J, Cliver SP:A randomized trial of augmented prenatal care for multiple-risk, Medicaid-eligible African American women.Am J Public Health2001,91(1):105–111. 13. Ricketts SA, Murray EK, Schwalberg R:Reducing low birthweight by
resolving risks: results from Colorado’s prenatal plus program.Am J Public Health2005,95(11):1952–1957.
14. Carlson NS, Lowe NK:Centering pregnancy: a new approach in prenatal care.MCN Am J Matern Child Nurs2006,31(4):218–223.
15. Wilkinson DS, Korenbrot CC, Greene J:A performance indicator of psychosocial services in enhanced prenatal care of Medicaid-eligible women.Matern Child Health J1998,2(3):131–143.
16. Ruiz-Mirazo E, Lopez-Yarto M, McDonald SD:Group prenatal care versus individual prenatal care: a systematic review and meta-analyses.J Obstet Gynaecol Can2012,34(3):223–229.
17. Goberna-Tricas J, Banus-Gimenez MR, Palacio-Tauste A, Linares-Sancho S:
Satisfaction with pregnancy and birth services: the quality of maternity care services as experienced by women.Midwifery2011,27(6):e231–e237. 18. Wheatley RR, Kelley MA, Peacock N, Delgado J:Women’s narratives on
quality in prenatal care: a multicultural perspective.Qual Health Res2008,
18(11):1586–1598.
19. Hildingsson I, Thomas JE:Women’s perspectives on maternity services in Sweden: processes, problems, and solutions.J Midwifery Womens Health
2007,52(2):126–133.
20. Vause S, Maresh M:Indicators of quality of antenatal care: a pilot study. Br J Obstet Gynaecol1999,106(3):197–205.
21. Boller C, Wyss K, Mtasiwa D, Tanner M:Quality and comparison of antenatal care in public and private providers in the United Republic of Tanzania.Bull World Health Organ2003,81(2):116–122.
22. Wong ST, Korenbrot CC, Stewart AL:Consumer assessment of the quality of interpersonal processes of prenatal care among ethnically diverse low-income women: development of a new measure.Womens Health Issues2004,14(4):118–129.
23. Vinagre MH, Neves J:The influence of service quality and patients’ emotions on satisfaction.Int J Health Care Qual Assur2008,21(1):87–103. 24. Gotlieb JB, Grewal D, Brown SW:Consumer satisfaction and perceived
quality: complementary or divergent constructs?J Appl Psychol1994,
79(6):875.
25. Handler A, Rosenberg D, Raube K, Lyons S:Prenatal care characteristics and African-American women’s satisfaction with care in a managed care organization.Womens Health Issues2003,13(3):93–103.
26. Lawrence JM, Ershoff D, Mendez C, Petitti DB:Satisfaction with pregnancy and newborn care: development and results of a survey in a health maintenance organization.Am J Manag Care1999,5(11):1407–1413. 27. Omar MA, Schiffman RF, Bingham CR:Development and testing of the
patient expectations and satisfaction with prenatal care instrument.Res Nurs Health2001,24(3):218–229.
28. Clement S, Sikorski J, Wilson J, Das S, Smeeton N:Women’s satisfaction with traditional and reduced antenatal visit schedules.Midwifery1996,
12(3):120–128.
29. Seguin L, Therrien R, Champagne F, Larouche D:The components of women’s satisfaction with maternity care.Birth1989,16(3):109–113. 30. Erci B, Ivanov L:The relationship between women’s satisfaction with
prenatal care service and the characteristics of the pregnant women and the service.Eur J Contracept Reprod Health Care2004,9(1):16–28. 31. Ivanov LL, Flynn BC:Utilization and satisfaction with prenatal care
services.West J Nurs Res1999,21(3):372–386.
32. Ivanov LL, Champion VL:Development of a Russian satisfaction with prenatal care scale.J Nurs Meas2000,8(2):117–129.
33. Donabedian A:Evaluating the quality of medical care.Milbank Mem Fund Q1966,44(Suppl 3):206.
34. Donabedian A:The quality of care. How can it be assessed?JAMA1988,
260(12):1743–1748.
35. Aday LA, Andersen R:A framework for the study of access to medical care.Health Serv Res1974,9(3):208–220.
36. Andersen RM:Revisiting the behavioral model and access to medical care: does it matter?J Health Soc Behav1995,36(1):1–10.
37. Campbell SM, Roland MO, Buetow SA:Defining quality of care.Soc Sci Med
2000,51(11):1611–1625.
38. Bennett I, Switzer J, Aguirre A, Evans K, Barg F:‘Breaking it down’:
patient-clinician communication and prenatal care among African American women of low and higher literacy.Ann Fam Med2006,4(4):334–340. 39. Moore ML, Ketner M, Walsh K, Wagoner S:Listening to women at risk for
preterm birth.MCN Am J Matern Child Nurs2004,29(6):391–397. 40. Tandon SD, Parillo KM, Keefer M:Hispanic women’s perceptions of
patient-centeredness during prenatal care: a mixed-method.Birth-Issues Perinatal Care2005,32(4):312–317.
41. Bloom KC, Bednarzyk MS, Devitt DL, Renault RA, Teaman V, Van Loock DM:
Barriers to prenatal care for homeless pregnant women.J Obstet Gynecol Neonatal Nurs2004,33(4):428–435.
42. Sword W:Prenatal care use among women of low income: a matter of “taking care of self”.Qual Health Res2003,13(3):319–332.
43. Chew-Graham CA, Sharp D, Chamberlain E, Folkes L, Turner KM:Disclosure of symptoms of postnatal depression, the perspectives of health professionals and women: a qualitative study.BMC Fam Pract2009,10:7. 44. Al-Qutob R, Mawajdeh S, Bin RF:The assessment of reproductive health
services: a conceptual framework for prenatal care.Health Care Women Int1996,17(5):423–434.
45. Langer A, Nigenda G, Romero M, Rojas G, Kuchaisit C, Al-Osimi M, for the WHO Antenatal Care Trial Research Group:Conceptual bases and methodology for the evaluation of women’s and providers’perception of the quality of antenatal care in the WHO Antenatal Care Randomised Controlled Trial.Paediatr Perinat Epidemiol1998,12(Suppl 2):98–115. 46. Streiner DL, Norman GR:Health measurement scales: a practical guide to their
development and use.3rd edition. Oxford: Oxford University Press; 2003. 47. Pett MA, Lackey NR, Sullivan J:Making sense of factor analysis: the use of
factor analysis for instrument development in health care research.Thousand Oaks, CA: Sage Publications; 2003.
48. Sword W, Heaman MI, Brooks S, Tough S, Janssen PA, Young D, Kingston D, Helewa ME, Akhtar-Danesh N, Hutton E:Women’s and care providers’ perspectives of quality prenatal care: a qualitative descriptive study.BMC Pregnancy Childbirth2012,12:29.
49. Feinstein AR:Clinimetrics.New Haven: New Haven: Yale University Press; 1987. 50. Marx RG, Bombardier C, Hogg-Johnson S, Wright JG:Clinimetric and
psychometric strategies for development of a health measurement scale. J Clin Epidemiol1999,52(2):105–111.