The frequency variation of Pc5 ULF waves during a magnetic storm
A. Du1,2, W. Sun2, W. Xu1, and X. Gao3
1Institute of Geology and Geophysics, Chinese Academy of Sciences, Beijing 100029, China 2Geophysical Institute, University of Alaska Fairbanks, AK 99775, USA 3Institute of Tibetan Plateau Research, Chinese Academy of Sciences, Beijing 100085, China
(Received September 3, 2004; Revised May 30, 2005; Accepted May 30, 2005)
The relationship between Pc5 ULF waves and the asymmetric ring current during the magnetic storm on July 15, 2000 is studied using ground-based magnetometer data and particle observations by the LANL satellite. A frequency decreases of Pc5 is noted during the main phase, which can be attributed to injections of heavier ions (O+ and He+) into the ring current. In addition, it is observed that during the main phase of the storm, the frequency drop of the Pc5 in the IMAGE chain around the MLT midnight is larger than that in the ALASKA chain at MLT post noon. Meanwhile, the longitudinal variation ofH with the maximum around midnight implies a highly asymmetric distribution of the ring current. These results suggested that the frequency variation of Pc5 pulsation during storms is related to the partial distribution in the ring current.
Key words:ULF waves, magnetic storm, ring current.
1.
Introduction
The distribution and time variation of plasma density in the magnetosphere can be estimated from ground-based ob-servations of ULF waves as standing waves of the Alfven mode (Obayashi and Jacobs, 1958; Waters et al., 1991, 1996). Theoretical work suggested the development of the field line resonance model of ULF waves (Tamao, 1966; Chen and Hasegawa, 1974; Southwood, 1974). In the cold plasma, the fast mode wave across the magnetic filed line and is independent on the magnetic field, while the shear Alfven wave is magnetic field line guided. The field line resonance and cavity resonance could generate Pc5 ULF at auroral latitude (Yumoto, 1984; Voelker, 1962; Glassmeier, 1995). The drift-bounce resonance is an internal source of ULF waves (Yeoman and Wright, 2001). Compressional Pc5 ULF waves, found on the nightside close to the flanks of the magnetosphere, are the dominant pulsations at high latitudes during a magnetic storm. Azimuthally polarized toroidal Pc5 pulsations are thought to be a fundamental mode of the toroidal field line resonance (FLR). The res-onant frequency of the field line decreases with the increase of plasma density and the length of the field line. The Pc5 ULF waves observed during a storm on July 15, 2000 were identified as field line resonance (Duet al., 2003).
Compressional Pc5 are correlated with the development of the partial ring currents (Anderson, 1993). The partial ring current associated with the asymmetry of the ring cur-rent connected to the auroral electrojet in the ionosphere through field-aligned currents (Akasofuet al., 2003). In-jections of heavier ions (O+and He+) into the ring current during the main phase of a magnetic storm were identified
Copy right cThe Society of Geomagnetism and Earth, Planetary and Space Sci-ences (SGEPSS); The Seismological Society of Japan; The Volcanological Society of Japan; The Geodetic Society of Japan; The Japanese Society for Planetary Sci-ences; TERRAPUB.
by satellite observations (Daglis, 1997). The strong dawn-dusk asymmetry of the ring current is caused mainly by O+ and He+ ions, but not by H+ ions (Fuet al., 2001). The increase of heavy ions will affect the resonant frequency of field line.
In this paper, we investigate the variation of the Pc5 frequency and its relationship with longitudinal asymmetry of the ring current during a storm on July 15, 2000.
2.
Data Analysis and Results
Seven stations of the IMAGE chain (the top 7 rows in Table 1) and four stations in the Alaska array (the middle 4 rows in the Table 1) are adopted for studying the char-acteristics of Pc5 ULF waves during a storm. Eight sta-tions in middle and low latitudes (the bottom 8 rows) are used to detect the asymmetry of the ring current. The ge-ographic and geomagnetic coordinates of all stations are listed in Table 1. The values of L for each station are also shown in Table 1 while MLTIMAGE≈UT+2 hrs and
MLTALASKA≈UT−11 hrs.
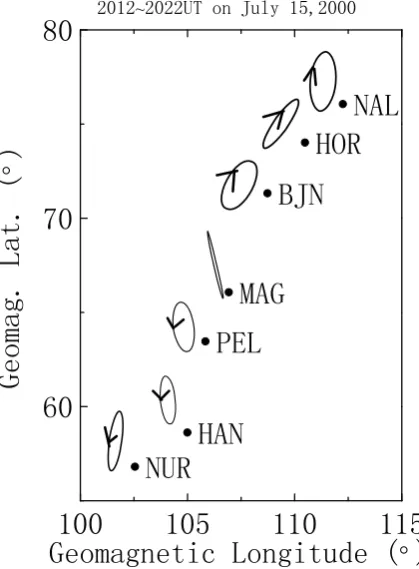
Duet al. (2003) studied the characteristics of filed line resonance for Pc5 on July 15–16, 2000. The main fre-quency of Pc5 ULF waves increases with the decrease of latitude during the storm on July 15–16, 2000. The ampli-tude peaks of Pc5 ULF waves during the initial phase, main phase and recovery phase occurred near 64◦N, 66◦N and 71◦N, respectively. Figure 1 shows the latitudinal variation of polarization ellipse of Pc5 waves. A linear polarization occurred at MAG with latitude of 66.07◦, and polarization changed from counterclockwise to clockwise. It indicates that Pc5 pulsations are generated by field line resonance.
2.1 Longitudinal asymmetry of the ring current dur-ing a storm of July 15, 2000
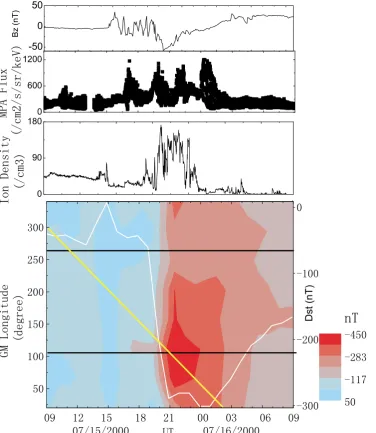
The top panel of Fig. 2 shows Bzcomponent of the In-terplanetary Magnetic Field (IMF) from Wind satellite, the two middle panels show the total ion fluxes from the 1–20
620 A. DUet al.: THE FREQUENCY VARIATION OF PC5 ULF WAVES DURING A MAGNETIC STORM
Table 1. The list of geographic and geomagnetic coordinates for the magnetic stations.
Station code Geographic Geographic Geomagnetic Geomagnetic L-value
latitude/ (◦) longitude/ (◦) latitude/ (◦) longitude/ (◦) (Re)
MAS 69.46 23.70 66.07 106.92 6.22
KEV 69.76 27.01 66.21 109.73 5.36
LOZ 67.97 35.08 64.23 114.49 5.36
SOD 67.37 26.63 63.82 107.71 5.25
PEL 66.90 24.08 63.46 105.38 5.12
HAN 62.30 26.65 58.62 104.99 3.77
DOB 62.07 9.11 59.29 90.20 3.90
BETTLES 66.90 208.45 66.46 255.27 6.35
CIGO 65.87 212.14 66.20 259.70 6.16
EAGLE 64.78 218.84 66.44 267.16 6.26
POKER 65.12 212.57 65.60 260.90 5.85
TAM 22.79 5.53 3.33 78.35 1.07
ABG 28.60 72.90 22.84 145.40 1.20
PHU 21.00 105.95 13.99 13.99 1.08
KAK 25.23 140.18 17.95 211.39 1.12
HON 21.32 202.00 21.30 269.86 1.17
DLR 29.50 259.08 38.89 326.35 1.68
SJG 18.40 293.90 29.1 5.2 1.08
MBO 14.40 343.03 23.49 58.86 1.05
Fig. 1. Snapshot of Pc5 polarization ellipse in IMAGE chain.
keV energy channel of MPA instrument on the LANL satel-lite and the total density of ions number observed by CPI on the Geotail satellite. The LANL satellite just locates near the IMAGE region at 2100 UT on July 15. There are sev-eral peaks of ion fluxes in LANL data and the density of ions observed by Geotail increases sharply. The IMF Bz remains southward and the ion flux increases, with several peaks occurring during the main phase. The bottom panel shows contour of theH at middle and low latitudes to-gether with the Dst index. As seen in the Dst profile, a sud-den commencement (SSC) occurred at 1440 UT, and then Dst decreased sharply at 1900 UT, arriving at the minimum at 2400 UT on July 15, then increasing slowly in the recov-ery phase.
Fig. 2. The IMFBzcomponent from the Wind satellite, ion fluxes from the LANL satellite; the longitudinal-UT distribution of magnetic disturbance, the Dst indices (white line in the lower panel).
2.2 Wavelet analysis of Pc5 frequency
To study the Pc5 ULF waves, the data were preliminarily filtered in the 1–8 mHz band by a digital band-pass filter. The Pc5 waveforms at the SOD station in the IMAGE chain and the Poker Flat station in the ALASKA chain are shown in the upper panel of Fig. 3 on July 15–16, 2000.
A Morlet wavelet analysis (Torrence and Compo, 1998), which consists of a plane wave modulated by a Gaussian function ϕ0(η) = π−1/4eiωηe−η
2/2
, was used to process the pulsation data. The lower panel of Fig. 3 shows the wavelet power spectrum of magnetic disturbances which were observed at SOD station in the IMAGE chain and at Poker Flat in the ALASKA chain during July 15–16, 2000. It is important to note that the frequency of Pc5 pulsa-tions at the IMAGE stapulsa-tions clearly declined gradually after the initiation of a storm at 1500 UT. The frequency reached a minimum at the maximum time of the main phase at 00 UT on July 16. Then it began to increase during the
re-covery. Meanwhile, the trend of Pc5 frequency at Alaska stations was similar to that in the IMAGE chain, but the variational amplitudes were much smaller. The Pc5 pul-sations frequency dropping during the main phase is obvi-ously associated with the injection of heavier ions (He+and O+) into the ring current during the main phase of a storm (Jordanovaet al., 2001).
2.3 Variations of Pc5 frequency and particles in the ring current during a magnetic storm
622 A. DUet al.: THE FREQUENCY VARIATION OF PC5 ULF WAVES DURING A MAGNETIC STORM
1 2 4 8
F
requency (mHz)
SOD
09 12 15 18 21 24 03 06 09
UT (Hour) 1
2 4 8
POKER 271.082
108704. nT^2 -150
0 150
Amplitude(nT)
SOD
-150 0
150 POKER
Fig. 3. Filtered pulsations (1–8 mHz) and the normalized wavelet power spectrum of pulsations for the SOD station in the IMAGE chain and Poker Flat station in Alaska chain on July 15–16, 2000.
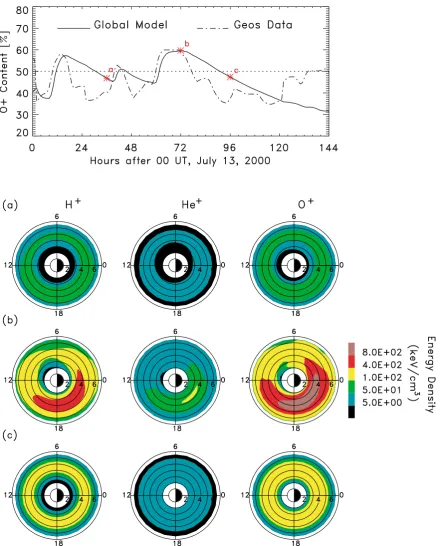
Fig. 5. Top: content of ring current O+. Bottom: H+, He+, and O+ring current ion energy density at selected hours indicated with (a), (b), and (c) in the top panel (Jordanova and Thorne, 2001).
IMAGE and ALASKA chains, respectively.
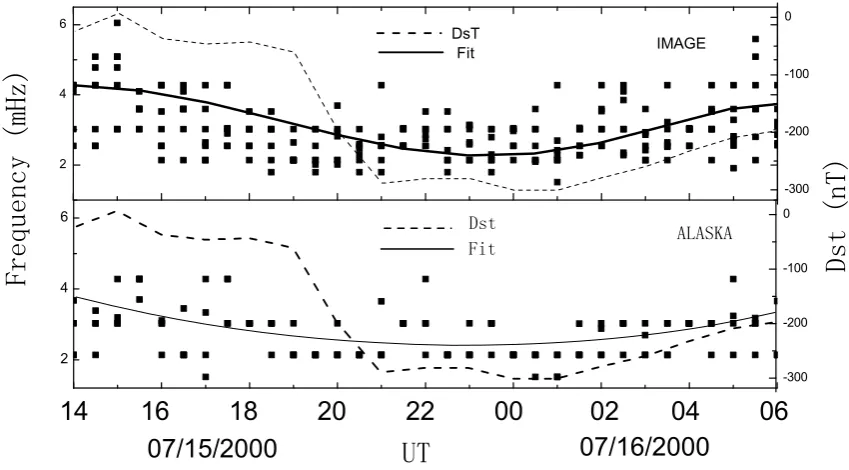
It is interesting to note that the main frequency at the IM-AGE stations decreased around 3 mHz on average from the initial time to the maximum time of the storm. The min-imum of the polynomial fit line locates in the main phase where Dst is less than−280 nT. On the other hand, only about 1 mHz decrease, in the average of the main frequency was found at the Alaska stations. The difference of the main frequency decrease between both chains is believed to arise from the different location of two chains, because
the ALASKA stations were located in the post-noon sector and the IMAGE array was in the midnight sector.
624 A. DUet al.: THE FREQUENCY VARIATION OF PC5 ULF WAVES DURING A MAGNETIC STORM
2000. They found that the content of O+in the ring current reached maximum values of 60% near the minimum value of the Dst index, and an asymmetry in the ring current was evident during the main phase with the maximum energy densities of ions near the dusk sector (see figure 5 in Jor-danova, 2001). At the same time, the decrease in amplitude of the magnetic field is only about 1 percent of total mag-netic field. The length of field line varies irregularly due to the compression of solar wind pressure and the dipolization of magnetic field. So we conclude that the difference of the main frequency difference between the chains at different MLT is associated with the asymmetry of injected heavier ions (He+and O+) in the ring current.
3.
Summary and Discussion
(1) The time variation of Pc5 magnetic pulsation fre-quency at the IMAGE stations is well correlated to the Dst index during a magnetic storm on July 15–16, 2000. The decrease of Pc5 pulsations frequency during the main phase of a storm indicates enhanced particle injections into the ring current, in particular for heavy ions O+and He+.
(2) The difference of the decrease in frequency of Pc5 ULF waves at between the IMAGE chain and the Alaska chain indicates the asymmetry of injected heavier ions (He+ and O+) in the ring current, which is consistent withH observations at low latitudes.
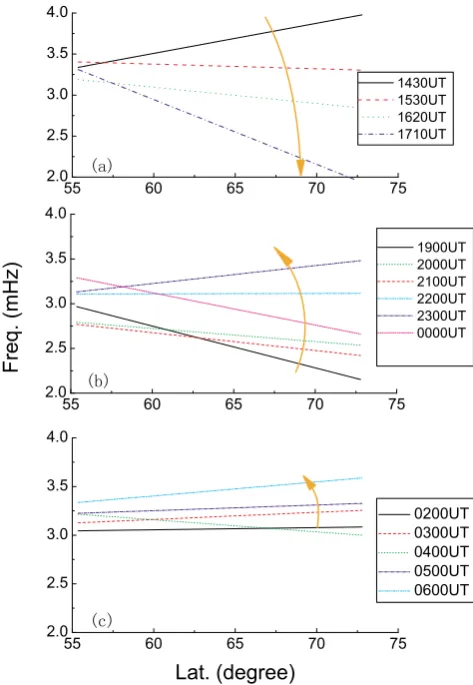
Fig. 6. The variations of Pc5 frequency with the latitude at the internal of 1430–0600 UT in July 15–16, 2000.
Field lines resonance associated with near magnetopause field lines. In the high latitude region, the field lines cross outside the plasmpause, so the wave structure of the ob-served FLRs will varies with radial distance. The field line eigenfrequency varies depending on a number of factors, including the field line stretching and the plasma density. Waters et al. (2000) showed this behavior of Alfven ve-locity and resonant period with L shell. In addition, some impulses during a storm usually affect the Pc5 frequency. Waterset al.(1995) and Mathieet al.(1999) also found a diurnal variation in the frequency. It is noted that the low-est Pc5 frequency is always seen at 2 mHz at both stations and the frequency higher than 3 mHz are almost seen at the IMAGE chain in Fig. 4.
Figure 6(a)–(c) show the variations of Pc5 frequency with the latitude for the period 1430–0600 UT, July 15–16, 2000. The different lines in the figure represent the linear fittings of frequency variation for different time intervals. For ex-ample, the black solid line indicates the frequency of Pc5 increases with increasing latitude at 1430 UT. In the inter-val 1530∼2100 UT, the frequency of Pc5 waves decreases with increasing latitude. In the interval 2100∼0600 UT, the frequency of Pc5 ULF waves increases with increasing lat-itude. It suggests that the temporal convection process of ions into the ring current is from higher latitude to lower latitude areas. We can see that Pc5 ULF waves whose fre-quency is near 2 mHz locates in different latitude. Because the range of latitude in IMAGE chain is wider than that in ALASKA chain, these phenomena result in the Pc 5 fre-quency distributes broader at the IMAGE chain than at the ALASKA chain.
Acknowledgments. We thank the Finnish Meteorological Insti-tute, and the geophysical institute of the university of Alaska Fair-banks. We would like to thank the many individuals who have provided valuable data including the LANL, WIND, Geotail and the University of Kyoto. This work is supported by NSFC (No. 40304013 and 40236058).
References
Akasofu, S.-I., W. Sun, and B.-H. Ann, Comments on some long-standing problems in storm/substorm studies, Disturbances in Geospace: The storm-substorm relationship,Geophysical Monograph,142, 243–254, 2003.
Anderson, B. J., Statistical studies of Pc 3-5 pulsations and their relevance for possible source mechanisms of ULF waves,Ann. Geophysicae,11, 128–143, 1993.
Chen, L. and A. Hasegawa, A theory of long-period magnetic pulsations,
J. Geophys. Res.,79, 1024, 1974.
Daglis, I. A., The role of magnetosphere-ionosphere coupling in magnetic storm dynamics, inMagnetic Storms, AGU Monogragh,98, 107–116, 1997.
Du, A.,et al., Characteristics of Pc5 ULF waves during the magnetic storm on July 15–16, 2000,Chinese Geophysics Journal,46(3), 322– 327, 2003.
Fu, S. Y.,et al., Temporal and spatial variation of the ion composition in the ring current,Space Science Reviews,95, 539–554, 2001.
Glassmeier, K.-H., ULF pulsations, inHandbook of Atmospheric Electro-dynamics, volume II, Chapter 14, pp. 482–503, 1995.
Jordanova, V. K. and R. M. Thorne, Ring current dynamics during the 13– 18 July 2000 storm period,Solar Physics,204, 361–375, 2001. Mathie, R. A., F. W. Menk, I. R. Mann, and D. Orr, Discrete field line
reso-nances and the Alfven continuum in the outer magnetosphere,Geophys. Res. Lett.,26, 659–662, 1999.
Southwood, D. J., Some features of field line resonances in the magneto-sphere,Planet. Space Sci.,17, 483, 1974.
Takahashi, K., B. J. Anderson, and S. Ohtani, Multisatellite study of night-side transient toroidal waves, J. Geophys. Res., 101, 24815–24825, 1996.
Tamao, T., Transmission and coupling resonance of hydromagnetic dis-turbances on the non-uniform Earth’s magnetosphere,Sci. Rep. Tohoku Univ., Ser. 5,17, 43 ,1966.
Torrence, C. and G. P. Compo, A practical guide to wavelet analysis,Bull. Amer. Meteor. Soc.,79, 61–78, 1998.
Voelker, H., Zur Breitenabhangigkeit der perioden erdmagnetischer pulsa-tions, Naturwissenschaften,49, 8–9, 1962.
Waters, C. L., F. W. Menk, and B. J. Fraser, The resonance structure of low latitude Pc3 geomagnetic pulsations,Geophys. Res. Lett.,18, 2293, 1991.
Waters, C. L., J. C. Samson, and E. F. Donovan, The temporal variation
of the frequency of high latitude field line resonances,J. Geophys. Res., 100, 7987–7996, 1995.
Waters, C. L., J. C. Samson, and E. F. Donovan, Variation of plasmatrough density derived from magnetospheric field line resonances,J. Geophys. Res.,101, 24737, 1996.
Waters, C. L., B. G. Harrold,et al., Field line resonances and waveguide modes at low latitudes,J. Geophys. Res.,105(A4), 7763–7774, 2000. Yeoman, T. K. and D. M. Wright, ULF waves with drift resonance
and drift-bounce resonance energy sources as observed in artificially-induced HF radar backscatter, Annales Geophysicae, 19, 159–170, 2001.
Yumoto, K., Long-period magnetic pulsations generated in the magne-tosperic boundary layers,Planet. Space Sci.,32, 1205–1218, 1984.