L
and surface topography forms the bound-ary between the solid earth, atmosphere, and hydrosphere. It controls air, water, and mass fluxes; redistributes solar irradiation; and, consequently, has a major influence on physical processes, ecosystems, and human activities. Understanding topography—its char-acter, properties, and human interaction—is therefore fundamental for many disciplines and provides the dri-ving force for research and development of terrain analysis and visualization tools.For centuries, people have used 3D solid terrain mod-els—which for most are intuitive and easy to interpret— for military planning and landscape design. New technologies, such as solid terrain modeling (see http://www.stm-usa.com) and 3D printers make model production efficient and can help generate impressive 3D physical models for settings where readily inter-pretable landscape representation is essential. Various institutions have used static solid models to convey 3D landscape information to the general public. Types of institutions using this approach include
■museums—for example, the National Geographic Museum in Washington, D.C.;
■parks—for example, Grand Teton National Park; and ■state and local governments—for example, Sioux Falls (see http://www.esri.com/news/arcnews/ winter0203articles/inthecityof-siouxfalls.html), San Francisco, and Illinois (see http://www.sws.uiuc. edu/chief/gis/illinois3d.htm).
Military and firefighting groups have focused on train-ing and planntrain-ing applications ustrain-ing solid models. Solid models are frequently employed for collaboration and decision support, although the range of displayed data and type of interaction is limited to viewing a single ter-rain representation.
By contrast, virtual terrain modeling environments are highly interactive, allowing users to combine elevation data with additional map layers, select a viewing posi-tion, adjust exaggeraposi-tion, use selective illuminaposi-tion, fly through the model, and modify other surface properties. The basic tools use a GUI and mouse to control the view, while the more sophisticated systems provide controllers with 6 DOF for navigation and immersive VR.1
The virtual terrain modeling tools are particularly effective in combination with geographic information systems (GIS) and numerical
mod-els of landscape processes.2 Howev-er, this type of visualization is aimed at a single user and the immersive environments can lead to a feeling of separation from the real world and nausea on the part of the user.1For effective group discussion, collabo-ration, and collective decision mak-ing, virtual terrain representations require the development of appro-priate interaction tools and new multiuser environments,3such as the combination of computer-vision-based hand and object tracking with augmented and virtual reality.1
We introduce a concept that
builds upon previous independent tangible user inter-face (TUI) and terrain analysis research (see the “Relat-ed Work” sidebar on the next page) and aims at more intuitive collaborative interaction with digital landscape data. In addition to visualization of existing data, our work’s specific focus is to use terrain surface modifica-tions to explore relamodifica-tionships that occur between differ-ent terrains, the physical parameters of terrains, and the landscape processes that occur in these terrains. Here, we describe various approaches to human interaction
Emerging technologies that combine the flexibility of digital landscape representation with easy-to-interpret 3D physical models open new possibilities for user interaction with geospatial data. A prototype tangible geospatial modeling environment lets users interact with landscape analysis and simulations using a tangible physical model.
Helena Mitasova and Lubos Mitas
North Carolina State University
Carlo Ratti, Hiroshi Ishii, and Jason Alonso
Massachusetts Institute of Technology
Russell S. Harmon
US Army Research Laboratory
Real-Time Landscape
Model Interaction
Using a Tangible
with terrain data, propose a tangible system configura-tion, and discuss coupling our system with the Geo-graphic Resource Analysis Support System (Grass) GIS.4
Interaction with terrain data
in Grass GIS
Capabilities for visualizing topography in GIS have evolved from 2D raster maps, contours, and simple 3D meshes in the 1980s to interactive 3D rendered surfaces with shading and color maps draped over the surface that became standard in the 1990s. Grass GIS was among the first general GIS environments that offered surface and volume visualization in 3D space controlled by an easy-to-use GUI (see http://skagit.meas.ncsu. edu/~helena/gmslab/appdoc/sg3d_tut.html). The system’s capabilities included dynamic 3D surfaces2 used to represent dynamic phenomena based on mea-sured data, such as a pollutant plume’s temporal evolu-tion or to communicate landscape process simulaevolu-tion results—for example, water and pollutant flow over complex terrain (see more at http://skagit.meas.ncsu. edu/~helena/publwork/grasskey02/grass02talk10. html). Support for multiple surfaces and interactive cut-ting planes later added the ability to explore terrain change using a set of digital elevation models (DEMs)
representing elevation surfaces at different time peri-ods (for example, before and after construction4), but elevation surface has been considered a static entity for most GIS applications.
New mapping technologies, especially laser scanning (for example, lidar and ladar), have dramatically improved terrain-mapping efficiency and high-resolu-tion, multitemporal DEMs are now increasingly avail-able. These data provide a new and more dynamic view of landscapes and stimulate the need for viewing, ana-lyzing, and modeling terrain change and its impacts within GIS. Interacting with terrain data has become important for different types of spatial analysis and design and planning tasks. It can provide insights into the relation between terrain surface shape changes and spatial patterns of the terrain’s derived parameters. For example, access to this type of data can help address the following questions:
■What is the pattern of slope around a peak or a saddle point, on a ridge, or in a valley, and how will this pat-tern change if the peak is removed or the valley filled during a surface mining operation?
■What is the relation between the terrain shape and water flow patterns, which shape is associated with Exploring Geovisualization
Related Work
Recently, several new technologies that combine the flexibility of digital representation with intuitive 3D physical models have emerged.
In one system, solid physical models combine high-resolution imagery printed on the model surface with a projection of selected map layers retrieved from geographic information systems (GIS).1The system is static, but the
user can display various types of GIS data, such as the location of a floodplain, wetlands, or a planned highway, over the terrain surface and the printed imagery.
A pin-based system creates the terrain model using movable rods covered by a flexible latex sheet. The pins lift the latex sheet to form a 3D model of the landscape based on digital elevation data while an image file is projected on the surface. Through computer control, a new surface can be generated within 30 seconds to 2 minutes. Recently, researchers have combined this type of physical terrain model with a touch table for better interaction (see http:// www.xenotran.com/products.htm and http://www.ms. northropgrumman.com/images/TerrainTable_FS.pdf).
Illuminated Clay consists of a flexible clay terrain model, a laser scanner, and a projector.2The laser scans the surface
that is amenable to physical modification by hand, and the impact of the modification on a selected terrain parameter (for example, slope and water flow direction) is then
projected as a color map on the surface in near real time. The MIT Media Laboratory developed the prototype systems.
The first two technologies, with a focus on data display, have recently become commercially available. The third tangible approach, which offers the opportunity for a superior combination of flexibility and cost efficiency, is at the research and development stage. This tangible user
interface (TUI) integrates terrain representation and control within a physical tangible model coupled with its virtual digital representation.
TUIs have emerged as an alternative paradigm to the more conventional GUIs3letting users manipulate objects in
space, thereby combining the benefits of physical and digital models in the same representation. The early developments of TUIs date back to the early 1980s, when Frazer explored different approaches to parallel physical and digital interactions with his 3D data input devices.4The
Illuminated Clay concept was directly inspired by the Urban Design Workbench,5which uses digitally augmented
tagged physical objects to represent buildings that can be rearranged to facilitate the process of urban design. A similar system has been coupled with a GIS.6
References
1. C. Coucelo, P. Duarte, and R. Crespo, “Combining 3D Solid Maps with GIS Data Video Projection,” Proc. 2nd Int’l Conf. Geographic Information GIS Planet, CD-ROM, 2005; http://www.gison3dmap. com/index.asp.
2. C. Ratti et al., “Tangible User Interfaces (TUIs): A Novel Paradigm for GIS,” Trans. GIS, vol. 8, no. 4, 2004, pp. 407-421.
3. B. Ullmer and H. Ishii, “Emerging Frameworks for Tangible User Interfaces,” IBM Systems J., vol. 393, no. 3, 2000, pp. 915-931. 4. J. Frazer, An Evolutionary Architecture, Architectural Assoc., 1995. 5. J. Underkoffler and H. Ishii, “Urp: A Luminous-Tangible Work-bench for Urban Planning and Design,” Proc. Conf. Human Factors in Computing Systems (CHI), ACM Press, 1999, pp. 386-393. 6. V. Coors, V. Jung, and U. Jasnoch, “Using the Virtual Table as an
■
pattern of water flow and sediment transport? ■What happens to the flow distribution pattern if
ter-races are introduced on a uniform hill slope?
Interactive manipulation of terrain models can help teach reading of a topographic map or a cut-and-fill plan represented by contours. Educators can simultaneous-ly project contours over the 3D model and as a 2D map to demonstrate how topographic contours change when the surface is modified. Easily adding structure and building models to the DEM (essentially combining CAD and GIS) is important for exploring design alternatives when creating neighborhoods, preparing plans for storm water and sediment control, placing structures for best passive solar energy performance, and numer-ous other creative design tasks requiring human input and analysis of alternatives.
Currently, we can modify DEMs in Grass GIS by onscreen digitizing, using a mouse and GUI. This approach involves making 3D changes using an image displayed on a 2D screen—for example, by outlining the area to be modified and assigning it a selected elevation value. When using a mouse and GUI in such a way, there is a disconnect between the manipulated object (repre-sented by an image on the screen) and the tool to do it (a mouse) that requires good hand–eye coordination and 3D spatial perception. Therefore, we have been investigating more intuitive approaches. A variety of haptic devices, such as a haptic desktop arm, allow the user to touch and modify a virtual model, but the hand of the person making the changes is still separated from the object, although the haptic arm lets the user feel it (see http://www.computersculpture.com/Pages/ Index_Modeling.html). The haptic arm approach is cur-rently used for object modification (such as in industri-al design); the practicindustri-ality of applying this approach in geosciences remains to be explored.
To see the impact of surface modifications on terrain parameters, the user must run several additional mod-ules to perform the analysis. To enhance the GIS capabil-ities for interaction with terrain data, we are investigating coupling between Grass GIS and the illuminated clay5 concept.
Tangible system configuration
The Illuminated Clay system uses a commercially available laser scanner (a Minolta Vivid-900 or 910) to capture the surface geometry of a 3D topographic model made of flexible clay. The 3D scanner is coupled to a video projector that projects images onto the landscape model. The scanner and projector pair is housed inside a casing approximately 2 meters above the terrain model. A special program based on Minolta’s software development kit performs successive scans of the model at approximately three scans per second—instead of the standard scan-and-stop mode of operation. The pro-gram converts the results obtained as distance values from the scanner’s lens into a raster DEM, commonly used in the geosciences. It then applies the terrain
analy-sis algorithms5to the DEM and the resulting raster maps are then projected on the landscape model using a video projector. The interaction loop is recursive, performing approximately one scan-analysis-projection cycle each 1 to 2 seconds, providing users with an almost instant response to any change manually introduced on the model surface.
The entire set of analysis functions (for example, ele-vation, flow direction, and profile) occurs simultane-ously and all parameters are displayed as small 2D raster maps around the physical model edges (see Figure 1) while the user-selected parameter (such as land surface slope) is projected over the physical model. The user can then use any of the 2D raster maps to select an image to project over the physical model. We can add additional projectors to create a virtual 3D terrain model that is coupled with the tangible physical model and the sys-tem interface. The virtual terrain model lets the user view the modified surface and objects placed on it from a near-ground perspective or any other user-selected viewing position.
We built the physical landscape model from various flexible materials, such as plasticine with a metal mesh, and wooden or plastic blocks for structures. We can form the plasticine and mesh surface using a mold created from real-world digital elevation data and a 3D printer, solid terrain modeling technology, or simple foam lay-ers cut along contours. Alternatively, we could create the surface interactively by projecting a difference between the DEM and the scanned model onto the sur-face and modifying it until the difference is below a given threshold. The possible interaction with the model includes manual shaping of the clay surface and adding or removing model structures.
Coupling with GIS
We can consider the original illuminated clay system a TUI for terrain surface analysis because it supports computation of those landscape parameters that use only elevation data as an input. To expand the system’s use beyond the topography by including additional landscape features and processes, we have defined sev-eral levels of coupling between the 3D physical model
1
(a) Illuminating clay system configuration combining a ceiling-mounted 3D laser scanner with a projector and a flexible clay landscape model. (b) An additional projector projects a coupled virtual terrain model on the vertical screen.and Grass GIS. The coupling options described in the “Different Levels of Possible Coupling between Grass GIS and a 3D Physical Landscape Model” sidebar pro-vide a framework for building scalable tangible mod-eling systems, from simple, low-cost options to sophisticated geospatial modeling environments with near-real-time response to different types of landscape modifications.
Grass GIS,4as one of the largest open source projects by the size of its code, includes more than 350 modules
that support georeferenced data management, projec-tion, spatial analysis, image processing, modeling, and visualization. Among these modules, some 20 are directly applicable for analysis of impacts of terrain modification in a two-way coupling mode (see the “Dif-ferent Levels of Possible Coupling between Grass GIS and a 3D Physical Landscape Model” sidebar’s second and third options). These require only elevation data as an input and allow us to perform a comprehensive topographic analysis as discussed in the “Topographic Exploring Geovisualization
Different Levels of Possible Coupling between
Grass GIS and a 3D Physical Landscape Model
Based on the type of interaction between the physical model surface representing elevation, its color representing landscape attributes, and a computer system, we can define different levels of coupling.
Passive physical model combined with active image projection
This level transfers a landscape attribute map from the computer to the physical model. This one-way coupling involves a projection of a thematic map created in the Grass GIS1graphical window over the physical model (see Figure A),
an adequate approach for small models (around 1 foot2).
Image transformation to the central projection is required for larger models and greater terrain complexity.
A
One-way coupling projects a GIS map onto the solid terrain model.The projected map can be static, incorporating a combination of raster and vector features (for example, combined vegetation, roads, building footprints, and streams) or an animation representing a landscape process (for example, water flow or spread of fire). This approach offers great flexibility for the type of displayed data and allows the user to explore the relationship between the data represented by a projected map and the topography in an intuitive, natural manner. For example, by projecting a vegetation map, you can easily identify the association between the pattern of bottom-land forest distribution and river valleys. This type of coupling is useful for education, displays for the general public (for example, museums and parks), and other applications where solid models are used with GIS map layers to broaden the range of themes that users can explore.
Active physical model combined with active image projection
This level transfers elevation data from the physical model to the computer and an attribute map from the computer to the model (see Figure B). The model surface can be modified manually and the new surface elevations transferred to the computer using 3D laser scanning. The elevation data are imported into the Grass GIS where digital elevation models (DEMs) and parameters computation takes place at a user-selected resolution. The analysis can take several seconds; therefore, the attribute data are projected from the computer to the surface with a delay (several seconds or more, depending on the resolution and complexity of analysis) so the user has to wait for the result. Sophisticated spatial approximation methods,1,2used also for lidar data,
can be applied within Grass GIS to reduce noise associated with the laser scanning and manual manipulation of the clay
surface.
B
Basic two-way coupling transfers the data from physical terrain model to GIS and projects GIS maps onto the model.The spatial approximation module simultaneously computes a set of raster maps representing topographic parameters that can be projected on the model surface and the small peripheral 2D maps. This two-way asynchronous coupling permits complex spatial modeling that requires additional map layers stored in the GIS database and GIS modeling tools. For example, erosion modeling combines the land cover, soil, and rainfall data stored in the GIS with terrain parameters derived from the scanned model. The resulting erosion-risk raster map can then be projected over the terrain model and subsequently used to guide the design of specific soil conservation practices.
The asynchronous coupling also lets the user derive vector layers from the modified surface, such as new topographic contours and stream networks as well as perform analysis, modeling, or optimization tasks that might use attributes stored in an external database. This option can also support Color: attributes
Projector
Surface: elevation Computer:
GIS Projector Color: attributes
Surface: elevation 3D scanner
Analysis Coupled with a Tangible Landscape Model” sidebar on the next page.
Several modules combine elevation data with addi-tional map layers for more complex analysis that takes full advantage of GIS. Soil erosion risk assessment, fire spread simulation, ecosystem modeling, and analysis of shortest path are examples of applications where the scanned terrain surface is combined with raster maps representing vegetation, soil types, climate conditions, infrastructure, or other landscape properties to
com-pute an updated image projected over the modified sur-face. Using the tangible interface, we can introduce ter-rain modifications at various locations and investigate the sensitivity of the modeled phenomenon to chang-ing topography. For example, in the study of erosion risk, we can compare the impact of various types of ter-rain change in vegetated areas with impacts in areas with bare soil.
Dynamic models of landscape processes, such as water flow and sediment transport, require special Active physical model combined with active
near-real-time image projection
This option is similar to the first option, but the transfer of elevation data from the physical model to the computer and the projection of an attribute map onto the model happen in near real time. Users can manually modify the model surface while its elevation is being transferred to the computer and a new attribute map is projected onto the surface within 1 to 2 seconds, creating a user perception of instant response. This type of coupling was developed for the Illuminated Clay concept and the fast response is achieved by combining the lower-resolution fast-scanning mode with simple
approximation methods for computation of DEM and its parameters.
Various options for two-way synchronous coupling with selected Grass GIS modules are currently being investigated. The synchronous coupling is the most unique aspect of the proposed system, as it permits visualization of the impact of terrain modifications while they are performed so the user can continue to make adjustments until the desired outcome is achieved.
Active, computer controlled landscape model with active near-real-time image projection
This option transfers elevation data from the physical model to the computer and from the computer to the model, with an attribute map transferred from the computer to the model (see Figure C). This two-way surface coupling could support the capabilities described in the second option, but also would make the surface adjustable using the digital elevation data, a capability currently supported only by the pin-based systems.
C
Full two-way coupling transfers both elevation and attribute data between the physical model and GIS.expensive and not yet practical option because the pin-based systems don’t allow interactive modification of the topographic surface by hand.
This option would expand the system’s use letting users modify the physical terrain model based on the results of numerical simulations of landscape evolution due to erosion and deposition processes. It would also allow users to modify the physical model using digital data, for example by incorporating CAD data representing a planned
development that could be further explored and modified using the tangible approach.
Active, computer-controlled physical model with active near-real-time attribute input and
projection
This level would permit elevation transfer from the model to the computer and/or from the computer to the model, as well as accommodate the transfer of an attribute map from the computer to the model and from the model to the computer (see Figure C). This approach would support all the capabilities described in the previous option, but also would use the landscape model’s RGB scan, acquired by the laser scanner simultaneously with the elevation surface, to capture manually introduced change in color. Thus, it would permit color coding of the surface and structures to indicate the type of land cover, permeability of structures, and other properties needed as input for landscape process modeling and decision making.
Considerable research still needs to be done to build this type of system. In addition to the development of an affordable computer-controlled physical model, suitable materials and tools for adding the color to the physical model will have to be explored and methods for fast analysis of the color image and its transformation to surface
attributes need to be investigated.
References
1. M. Neteler and H. Mitasova, Open Source GIS: A Grass GIS Approach, 2nd ed., Kluwer/Springer, 2004.
2. H. Mitasova, L. Mitas, and R.S. Harmon, “Simultaneous Spline Interpolation and Topographic Analysis for Lidar Elevation Data: Methods for Open Source GIS,” IEEE Geoscience and Remote Sens-ing Letters, vol. 2, no. 4, 2005, pp. 375- 379.
Color: attributes Projector
Surface: elevation Shaper
3D scanner Computer:
attention. In this case, the evolution of the simulated process changes as the user interacts with the surface. Researchers are investigating various approaches for this type of dynamic real-time coupling, including
■displaying the evolution of flow during computation; ■displaying the resulting flow with increasing
accura-cy by gradually sharpening the image using an increasing number of particles for simulation of flow by a path sampling technique;2
■updating the flow only for the modified location and the area downstream from it; and
■performing the simulation using parallel computing.
We consider coupling with dynamic models one of the most interesting and at the same time the most chal-lenging directions in the development of a tangible GIS interface because it might allow us to add a temporal aspect to the current spatial applications. For example, we can observe water running over a dam and try to add model sand bags to stop it while water levels are still ris-ing. We can investigate how fast this needs to occur and with how many bags are needed. Moreover, different users can modify terrain at different locations simulta-neously—for example, one user can break the dam upstream from a city and several others can try to place protection such as models of sand bags or retention walls at critical locations downstream, providing an opportunity to explore complex spatial and temporal interactions. Because users do not need obtrusive equip-ment such as glasses or complex navigation devices, they can communicate face to face in a natural way, without needing special skills such as the knowledge of often complicated GIS interfaces.
We will need to conduct specific usability studies to assess the effectiveness of the system for various types of tasks; however, the system is still evolving in terms of various configurations, control of attribute maps, and interaction with GIS, so it might be too early for such studies.
Exploring Geovisualization
0.0010 0.2500 0.5000 0.7500 1.0000
(a) (b)
kg/ms
3
Significant sediment transport is observed and modeled at the test site: (a) field photo after a storm and (b) simulated pattern of sediment flow rate.2
Elevation surface for the test site: (a) 1:2,000-scale clay model; (b) 1-millimeter-resolution DEM based on a 3D scan of a modified physical model; (c) original 2-meter-resolution DEM used to create the physical model; (d) 2-meter-resolution DEM based on a 2001 airborne lidar scan. The surfaces were visualized in Grass GIS.1993
2001
0 300 meters
(a)
(b)
(c)
(d)
N
Topographic Analysis Coupled with a Tangible
Landscape Model
Grass GIS-supported topographic analysis includes computation of maps and reports representing properties of terrain surface and their relation to natural processes. These properties include
■elevation (contours and color elevation map);
■terrain surface geometry (slope, aspect, curvatures, and so on);
■terrain features (peaks, valleys, ridges, dune crests and slip faces, and so on);
■watershed characteristics (watershed boundaries and stream networks);
■view shed analysis, shadowing, and line of sight; ■solar irradiation pattern and dynamics;
■profiles and routes;
■summary statistics, volumes, areas, and histograms; and ■spatial query (values and attributes at given locations) and
measured distances.
The Illuminated Clay model approach has implemented computation of elevation, contours, slope, aspect, curvature, flow direction, profiles, and shade casting; we are enhancing these computations using methods developed for Grass GIS. Algorithms derived from flow accumulation, such as watershed boundaries and stream networks, are more difficult to implement within the framework of two-way synchronous coupling because the computation requires accumulation of values over the entire modeled region. An approach that shows the result at gradually increasing resolution might hide the delay from the user; currently, two-way asynchronous coupling is used. Visibility and solar irradiation might require a similar approach.
active landscape model with Grass GIS and used this to explore various structure placement and terrain modifi-cation scenarios for sediment control and prevention of local flooding in a small watershed on the North Caroli-na State University experimental farm. The test area is a 25-hectare site at the NCSU Sediment and Erosion Con-trol Research and Education Facility. Various methods for erosion and sediment control are developed and tested at this site and it has a sufficiently complex terrain to demonstrate the tangible interface’s functionality.
We built the 3D clay model (see Figure 2a) for our test landscape using the 0.6-meter (2-feet) elevation contours obtained from the Wake County, North Car-olina GIS. The model’s horizontal scale was 1:2000 with six-times vertical exaggeration. Figure 2b shows a 1-millimeter-resolution DEM based on the scanned modified clay model. For comparison, we have also computed a 2-meter-resolution DEM from the original contours, representing the terrain in the year 1993 (see Figure 2c) and an airborne lidar-based DEM using the data acquired in 2001 (see Figure 2d) to illustrate actu-al changes in topography. Field observations (see Fig-ure 3a) and hydrologic and erosion simulations6 performed in Grass GIS show significant runoff and sed-iment transport through the study site’s center (see Fig-ure 3b) and flooding in the lower parts of terrain where a new road is located (see Figure 2d). We have used the physical model as a tangible interface (see Figure 4a) to explore the changes in topography using various struc-tures, ditches, and basins that could be implemented to minimize the flooding and reduce the excessive sed-iment transport.
We first projected GIS-based landscape characteriza-tion layers—such as soils, land cover, footprints of struc-tures, and roads—onto the physical model surface to
provide information about the modeled landscape’s properties. We performed surface analysis, flow rout-ing, and erosion modeling in Grass GIS for the initial ter-rain to assess the patterns of slope, overland water flow (see Figure 4b), and sediment transport. We then man-ually modified the physical landscape model to explore various approaches for water flow and sediment pollu-tion control (see Figure 5).
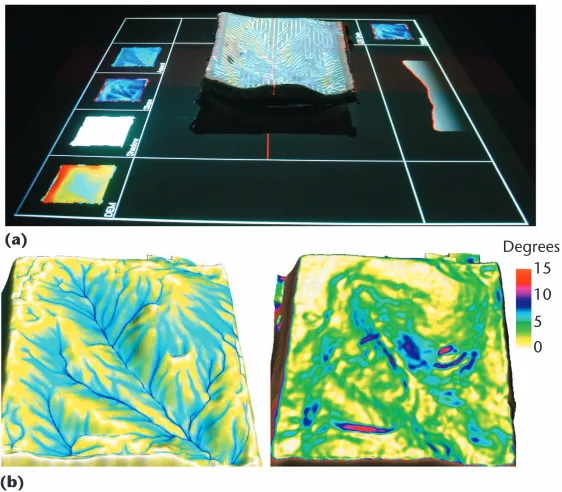
4
Clay model placed in the Illuminated Clay environment: (a) flow direction is projected over the surface while additional parameters (elevation, contours, slope, aspect, and profile) are displayed by smaller 2D images around the worktable; (b) more detailed maps of water flow and slopes are computed for the scanned surface using asynchronous coupling with Grass GIS.(a)
15
0 5 10
(b)
Degrees
(b)
5
Users modify the physical landscape model by (a) creating depressions or (b) adding a check dam. Simultaneously, the impact of the modification on the spatial pattern of flow direction and slope value (represented by color) is projected over the model surface, while changes in other parameters appear in the smaller 2D images around the worktable.The first set of changes involved manual modification of a convex hill slope into a shallow basin while the flow-direction map was displayed and concurrently updated along with the terrain surface change. We gradually adjusted the basin shape until flow was redirected through this basin into the neighboring forested water-shed, thus reducing the concentrated flow that was causing the flooding and sediment pollution. We then projected a new slope map over the modified surface to check whether the modifications might have introduced unwanted steep slopes that could cause stability prob-lems over the long term. We manually modified slopes that exceeded the critical threshold, such as the red areas in Figure 4b, until the projected slope map showed stable values everywhere. We implemented a similar redirection of flow and slope adjustment on the other side of the valley. We then imported the new DEM into Grass GIS and re-ran the topographic analysis and flow simulation with greater detail. The process-based model allowed us to quantify the proposed change’s impact in terms of water depth and sediment flow rates for a selected design storm.6
A second set of modifications involved the addition of check dams to restrict flow in the main valley. We used small, dam-shaped pieces of clay to approximate these structures (see Figure 5). The tangible environment lets us move a dam up and down along the valley, add a sec-ond and a third structure, and modify the dam’s shape and size while observing the impact on water flow pat-terns in near real time.
The flow direction map showed interruption of flow due to check dams and a reduction in water flow rate through the valley, with the effectiveness dependent on the structure’s location in relation to the rates of lateral inflow. We then imported the modified DEM containing the selected distribution of dams into Grass GIS and per-formed process-based modeling to quantify the resulting water flow depth and sediment flow rates (see Figure 6). The placement of larger structures in the valley’s lower section resulted in a more robust design in terms of a capa-bility to reduce flow rates and to withstand larger storms
than the use of a larger number of smaller structures locat-ed along the entire valley’s length. We have uslocat-ed both two-way synchronous and asynchronous coupling for this case. In addition, this approach let us investigate the flow dynamics and assess the conditions under which the check dams could be overtopped by storm water.
Conclusion
The presented coupling of a tangible physical model and Grass GIS represents a promising first step in an effort to build tangible geospatial modeling environ-ments that will allow users to interact with 3D land-scape data using the natural human ability to work with their hands. We need to further research several areas to better understand the usability and potential for applications. In particular, we need to investigate the range of scales that manual manipulation of a physical landscape model can support and to assess the feasibil-ity of adding zoom-in capabilities at least for the cou-pling with the computer-controlled physical model. A related issue is the merging of the model data with the real-world data and a tradeoff between real-time response and accuracy.
In the future, we envision that large 3D physical models coupled with GIS and numerical simulations and capable of receiving real-time data from satellites and terrestrial sensors will form the heart of the land-use management technology at different levels of government and within the military installation man-agement community. These kinds of systems will not only help us solve day-to-day land management prob-lems, but also improve response to natural disasters
and emergencies. ■
Acknowledgments
We gratefully acknowledge the US Army Research Office Terrestrial Sciences Program’s support of this research. We obtained the data used for the model from the Wake County, North Carolina GIS and the North Carolina flood mapping program. The site photo is cour-tesy of Richard McLaughlin, NCSU. We thank Ondrej Exploring Geovisualization
0.001 0.005 0.01 0.05 0.1 0.5 Meters
N
0 200 meters
(a) (b)
in one way or another to this research, in particular Eran Ben-Joseph, Assaf Biderman, Dennis Frenchman, Bill Mitchell, Ben Piper, Cecilia Yu, and Yao Wang.
References
1. N.R. Hedley et al., “Explorations in the Use of Augmented Reality for Geographic Visualization,” Presence, vol. 11, no. 2, 2002, pp. 119-133.
2. L. Mitas, W.M. Brown, and H. Mitasova, “Role of Dynam-ic Cartography in Simulations of Landscape Processes Based on Multi-Variate Fields,” Computers and Geosciences, vol. 23, no. 4, 1997, pp. 437-446.
3. A.M. MacEachren and I. Brewer, “Developing a Conceptu-al Framework for VisuConceptu-ally-Enabled Geocollaboration,” Int’l J. Geographical Information Science, vol. 18, no. 1, 2004, pp. 1-34.
4. M. Neteler and H. Mitasova, Open Source GIS: A Grass GIS Approach, 2nd ed., Kluwer/Springer, 2004.
5. C. Ratti et al., “Tangible User Interfaces (TUIs): A Novel Par-adigm for GIS,” Trans. GIS, vol. 8, no. 4, 2004, pp. 407-421. 6. L. Mitas and H. Mitasova, “Distributed Erosion Modeling for Effective Erosion Prevention,” Water Resources Research, vol. 34, no. 3, 1998, pp. 505-516.
Helena Mitasova is a researcher in the Department of Marine, Earth, and Atmospheric Sciences, North Caroli-na State University. Her research interests include GIS, environmental modeling, and geovisualization. Mitasova has a PhD in geodesy-car-tography from Slovak Technical Uni-versity, Bratislava. She received the Excellence in Development award from the Open-GIS Foundation and is a member of the Transactions in GISeditorial board. Con-tact her at [email protected].
Lubos Mitasis a professor in the Department of Physics, NCSU. His research interests include computa-tional methods for quantum systems and methods for spatial interpolation, and process-based simulation of land-scape fluxes. Mitas has a PhD in physics from the Institute of Physics, Bratislava, Slovakia. Contact him at [email protected].
interests focus on how technology is changing the way we live and work in cities. Ratti graduated in civil struc-tural engineering from the Politecni-co di Torino, Turin, Italy and the EPolitecni-cole Nationale des Ponts et Chaussées, Paris. He also has a PhD in architecture from the University of Cambridge. Contact him at [email protected].
Hiroshi Ishiiis a tenured associate professor of media arts and sciences at the MIT Media Lab where he founded and directs the Tangible Media Group. His research interests include the design of seamless interfaces between humans, digital information, and the physical environment. Ishii has a PhD in computer engineering from Hokkaido University, Japan. Contact him at [email protected].
Jason Alonsois a technical assis-tant at the MIT Media Lab, Tangible Media Group. His research interests include human–computer interac-tion. Alonso has a BS in computer sci-ence and computer engineering from Massachusetts Institute of Technolo-gy. Contact him at jalonso@media. mit.edu.
Russell S. Harmonis a senior pro-gram manager at the Army Research Office. His research interests include terrestrial sciences, landmine detec-tion, and environmental quality. Har-mon has a BA in geology from the University of Texas, an MS in geo-chemistry from the Pennsylvania State University, and a PhD in geology from McMaster University. Contact him at [email protected].