Seismic response evaluation of safety related nuclear structure with yielding
Dampers using Linearization Techniques.
Y. M. Parulekar
1, G.R. Reddy
1, K.K. Vaze
1, A.K. Ghosh
1, H.S. Kushwaha
1, R.
Ramesh babu
21
Bhabha Atomic Research Centre, Mumbai-400085, India
2
Central Power Research Institute, Bangalore, India
Keywords: Earthquake, Yielding, dampers, Testing, analysis, shake table
1. ABSTRACT
Passive energy dissipating devices like Elasto-plastic dampers (EPDs) can be used for retrofitting of structures subjected to seismic loads. A model of RCC structure is tested on shake table with and without EPDs attached in its frames. Using a finite element model of the structure, linear and nonlinear time history analysis is carried out using Newmark’s time integration technique. However, the most viable approach used by designers is response spectrum approach. Hence Equivalent linearization techniques are used to address the nonlinearity of dampers and iterative response spectrum method is used for evaluating the response of the structure using equivalent damping and stiffness. The analytical maximum storey response of the structure is compared with experimental values and time history analysis values. It has been concluded that, iterative response spectrum technique using equivalent linearization techniques is simple and results in reasonably acceptable response of the structures retrofitted with energy dissipaters.
2. INTRODUCTION
Old safety related structures of nuclear facilities were designed for seismic criteria less rigorous than the present. To meet the current seismic safety requirements, detailed re-evaluation of structures need to be performed. Some of the structures may need retrofitting to meet the present demand. There are various methods of retrofitting such as, steel jacketing, concrete jacketing, fiber wrapping, using passive control devices such as dampers etc. The passive response control technology has gained acceptance over five decades and has been successfully used in structures and piping systems. Several such devices namely visco-elastic dampers, yielding dampers, friction dampers, tuned mass dampers and tuned liquid dampers are reported in literature (
P. Mahmoodi, 1969; Kelly and Skinner, 1972; Pall,1980; McNamara, 1987;
Welt and Modi, 1987
) . However yielding type of dampers are more common as they are effective, cheap and can be easily attached to the structure or piping system.In the present paper the iterative response spectrum (IRS) method is used to evaluate response of RCC structure with yielding dampers. A small size reinforced concrete framed model representing a safety related nuclear structure is made and tested on shake table with and without dampers under design response spectrum compatible time histories. Linearization techniques using secant stiffness and Caughy’s stiffness are used. Also increase in damping due to triangular plates is modeled using hysteretic method and Caughy’s method. The results of the IRS analysis are compared with those obtained by time history analysis. In this paper, the effect of change in height of the triangular plate on the response reduction is also studied.
3. SHAKE TABLE TESTS.
Shake table tests were conducted on a model of RCC structure as shown in Fig. 1. The model was subjected to 3 directional excitation.
3.1 Structural model
The model to be tested is a three storey, two-bay, Reinforced Concrete (R.C.) framed structure. The grade of concrete to be used for the model is M25 and grade of steel is Fe415. There is no column in the top storey in the center of the structure. The floor to floor height of the model is 0.9 m and each bay width is 1.35 m. Thus total height of model is 3.5m and width is 2.7 m. The size of beams and columns is 100 mm x 75 mm and thickness of slab is 60 mm. Total mass of Building model is 7 tons including 1.5 tons as footing mass. The model has asbestos roofing and glass panels are mounted in the frame of the top storey as shown in the Fig.1. Asbestos sheeting is connected to the portal beams of the roof using angle sections (similar to purlins). There are hinges in three central columns of the frame as shown in the Figure 1. The isolated footings of the building were bolted to the table. There are slabs in first two storeys and due to higher masses of the slabs the frequency of model lies in the peak of Response spectrum
.
The frame is tested with in fill brick walls and glass panels. Suitable openings in the frame are kept for entry. The frame with brick walls is also tested with 3 mm thick triangular plate Dampers shown in the Fig. 2.The dampers were attached to the beams and columns using steel box sections made of 2ISA 40 x 40 x 6.3.2. Sweep sine tests
Sine sweep tests were conducted to evaluate frequencies and damping along X-direction, Y direction and Z direction of the building. Sweep sine excitation tests were conducted with 0.06 g peak in the frequency band of 2 to 30 Hz with a constant linear sweep rate 2 octave/min. During this process acceleration responses were collected at various locations. At 0.06g excitation, the frequency with wall stiffness was observed as 10.75 Hz and damping was obtained as 3.5%. The tests were then conducted at various levels from 0.06g peak to 0.4g peak. It was observed that at 0.25g the wall beam joints sheared and the frequency came down and the frequency without stiffness of the wall was observed as 6.15 Hz. Damping ratio obtained from the tests was about 3.5 %.Sine sweep tests were also conducted for the structure with dampers The frequency of the test model without dampers is obtained as 6.16 Hz in X direction and 5 Hz in Z
Fig. 1 Shake table test setup
40 mm
a=80 mm b=80 mm
t=3 mm
0 5 10 15 20 25 30 35 0.00
0.05 0.10 0.15 0.20 0.25 0.30 0.35 0.40
A
c
c
e
le
ra
ti
o
n
(
g
)
Freq(Hz)
Required Response Spectra Test Response Spectra
Fig. 3 Acceleration response Spectra (5 % damping) Fig. 4 First mode shape of the Building with Dampers (Freq=6.175 Hz)
direction while that with dampers is obtained as 6.6 Hz in X direction and 5.4 Hz. in Z direction. The storey accelerations were observed in each test. It was observed that there was about 30 % reduction in response displacement and acceleration of the building model when dampers were attached in the frames.
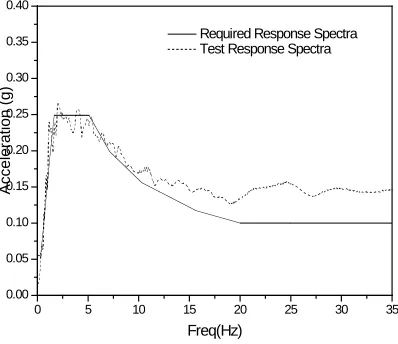
3.3 Design Seismic Wave Tests
The spectrum compatible acceleration time history was obtained from the 5 % damped Required Response Spectrum (RRS) shown in Fig. 3. This seismic wave was applied to the structure in all three directions simultaneously with vertical acceleration 2/3rd of horizontal acceleration. Tests were carried out on the R.C.C. model with and without dampers for the random seismic wave with peak acceleration 0.1g, 0.2g, 0.3g, 0.4g for each case. The acceleration and displacement responses were collected at each of the storeys in X, and Z directions.
4. DYNAMIC ANALYSIS OF THE STRUCTURE
Finite element model of the building model was made without and with Elasto-plastic dampers. RCC beams and columns were modeled as 3D beam element, the slabs were modeled as SHELL4 element and the roof masses and the wall masses were lumped on the beams as MASS elements. Nonlinear truss element was used for EPDs. The material characteristics of the EPD were given in the form of stress-strain relationship. The nonlinearity of the damper is modeled using Vonmises Kinematic hardening.
The Force displacement curve for the 3 mm thick steel plate is obtained from experiments by Satish kumar et al. (2002). The stress strain curve is derived from this force displacement curve and a yield stress of 280 Mpa is obtained. The stiffness, k, Yield force, Fy, yield displacement, dy of 3mm thick triangular plate is 140 N/mm, 420 N and 2.98 mm respectively.
Free vibration analysis is carried out and the frequencies and the modal mass participations of the structure with and without EPDs are obtained. The first mode shape of the RCC building with dampers in X direction is shown in Fig. 4. It is observed from the mode shape that the relative storey displacement between 1st and 2nd storey is more than that between the 2nd and 3rd storey. The same is also observed from the tests. The frequencies and the modal mass participations of the building with dampers for the dominant vibration modes are listed in Table 1. It is observed from the table that the test and analysis frequencies are in good agreement.
Table 1 : Frequencies and modal participations of RCC building model
Pre-dominant Mode
Freq Analysis
(Hz)
Freq Test (Hz)
Direction: X mass Participation
%age
Direction: Y mass Participation
%age
Direction: Z mass Participation
%age
Case I: Piping system without Damper
1 Z 5.01 6.0 0 0 90.7
2 X 6.135 6.175 89.5 0 0
0 1 2 3 4 5 6 7 8 9 10 -50 -40 -30 -20 -10 0 10 20 30 40 50 Top Storey X dir accln (m/s 2 ) Top Storey X dir accln (m/s 2 ) Time (Secs) 0.3g base accln (Without damper)
0 1 2 3 4 5 6 7 8 9 10
-50 -40 -30 -20 -10 0 10 20 30 40 50 Time (Secs) 0.3g base accln(With damper)
-0.012 -0.008 -0.004 0.000 0.004 0.008 0.012 -500 -400 -300 -200 -100 0 100 200 300 400 500 Force (N) Displacement (m) Element 446
0.3g base acceleration
-0.012 -0.008 -0.004 0.000 0.004 0.008 0.012 -500 -400 -300 -200 -100 0 100 200 300 400 500 Force (N) Displacement (m) Element 442 0.3g base acceleration
Fig. 5(a) Response acceleration time history with and without damper for top storey for 0.3g peak sine sweep excitation
Fig. 5(b) Force displacement loop at damper locations for 0.3g peak sine sweep excitation Linear and nonlinear time history (TH) analysis is performed for the structure subjected to sine wave loading and spectrum compatible time history loading using Newmark-β time integration technique. The time history analysis results, for the structure subjected to sine wave loading with constant acceleration of 0.3g is shown Fig. 5. It is observed from the results that the energy dissipated in the dampers situated in first floor is higher than that of top floor. The maximum response of the top floor accelerations obtained from analysis for sine sweep excitation, are compared with the test results as shown in Fig. 6. There is 30 % reduction in response of the structure with dampers subjected to sine wave load.
However designers often use response spectrum method instead of laborious time history analysis procedures for designing structures. Hence seismic response of the structure with EPD is also determined using iterative response spectrum (IRS) method where in the stiffness and damping of the yielding members are evaluated using Caughey’s Linearization Technique. In the present work, stiffness of the yielding dampers is also obtained using secant stiffness and the damping is evaluated using hysteresis energy.
5. ITERATIVE RESPONSE SPECTRUM METHOD
IRS method is used to evaluate the response of the structure with EPDs. Initially a linear system without EPDs is considered and the response is obtained using response spectrum method for structural damping alone. The damping considered for the structure is 3.5% as obtained from the tests. The displacements
0.0 0.1 0.2 0.3 0.4 0.5 0 10 20 30 40 50 60 70
Analysis without damper (Top Storey) Tests without damper (Top Storey)
Anal with Damper (Top Storey) Tests with damper(Top Storey)
X d ir e c ti o n a c c e le ra ti o n m /s 2
base acceleration in g
Fig. 6 Comparison of tests and analysis top floor accelerations.
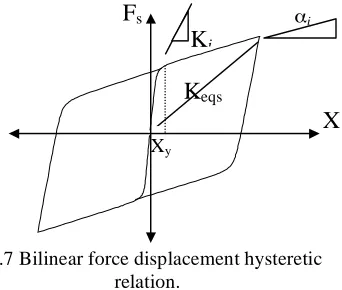
obtained at the location of EPDs are taken as displacements of EPDs for the first iteration. The equivalent stiffness and damping (Caughey, 1960) for a bilinear hysteretic characteristics of single degree of freedom system as shown in Fig. 7 is given as a function of the amplitude of the relative displacement as follows:
Keq = ci ; Ceq = -si/ω (1)
( )
ii i i K s
!
"
#
2 sin ) 1( $ 2
$
=
where
The foregoing functions were also used by Park and Hofmayer (1995) to represent yielding type of energy absorber. The subscript ‘i ’ denotes EPD springs and the, Ki and i are the initial stiffness and
bilinear hardening of the EPDs. In the present case the stiffness Kiand bilinear hardening i = 0.03 of the
plate is obtained from experiments (Satish kumar et. al. , 2002). i is the ductility ratio defined as the ratio of relative displacement at the EPD ends to the yield displacement of the EPD. ω is the natural frequency of the structure with EPD as given in table 1. Using these values the equivalent damping Ceq defined in Eq. (1) can be evaluated, and then the equivalent viscous damping ratio ςi of the EPD can be determined using the
following equation
where m is the modal mass of the structure.
Similarly secant stiffness shown in Fig.7, can be obtained by the following equations where xy is the yield displacement of the damper.
(
)
!
"
#
$
%
&
+
'
=
'
+
=
i i i i eqs y i y y i i i y i eqsK
K
x
x
x
K
x
K
K
µ
µ
(
µ
µ
(
1
1
)
(
Damping ratio is obtained from the hysteretic energy dissipated per cycle (Jennings, 1968) in the inelastic deformations as ) 4 / 1 ( /
!
"
=EH Et #Where EH= Hysteretic energy dissipated in one cycle and Et= total strain energy per cycle of loading. Therefore damping due to hysterics energy dissipation can be given by the following equations.
2 2 2 2 2 2
)
1
(
2
)
4
/
1
(
2
1
)
1
(
4
i i i ih y i i y i ihm
K
x
m
x
K
µ
!
"
µ
#
"
µ
!
µ
#
$
=
%
$
=
The initial stiffness value of a triangular plate shown in Fig. 2 is given by
3 3
6
a
Ebt
K
i=
(
)
! " # $ % & ' ' + '= sin(2 )
2 ) 1 ( 1 i i i i i i i K
c ) ( )* ) (
* for > 1 (2)
f
o
r
≤
1
(
2
)
for > 1 (5)
)
2
1
(
cos
1 i iµ
!
=
""
i
i
K
c
=
for µ≤ 1 (3)for µ> 1 (4)
Fig. 8(a) Variation in stiffness of triangular plate with relative displacement
0 1 2 3 4 5 6 7 8 9 10
0 1x10⁶ 2x10⁶ 3x10⁶ 4x10⁶ 5x10⁶ 6x10⁶ 7x10⁶ 8x10⁶
8 no. of plates with a= 40 mm, b= 40 mm Caughy's method
Hysterisis energy method
8 no. of plates with a= 80 mm, b= 80 mm Caughy's method
Hysterisis energy method
Equivalent
Stiffness
N/m
Displacement (mm)
0 2 4 6 8 10
0.00 0.01 0.02 0.03 0.04 0.05 0.06 0.07 0.08
8 no. of plates with a= 40 mm, b= 40 mm
Caughy's method Hysterisis energy method
8 no. of plates with a= 80 mm, b= 80 mm
Caughy's method Hysterisis energy method
Damping
Ratio
!
Displacement (mm)
Fig. 9 Flow chart of Iterative Response Spectrum Method
δ=0
δ
iCalculate fundamental modal properties of the structure
Using structure damping (ζs) alone calculate Rel. displacement (δi) at EPD location using RS*
Using total damping and linear springs of equivalent stiffness at damper location carryout response spectrum
analysis and obtain rel. Displ. at EPD locations, (δ)
δi=δ check (δ-δi)/δ≤0.01
Response displacement = δ
No
Yes Yes
s
No If δi < Xy i.e. yield
displacement of EPD
δ
i
No
Calculate EPD damping (ζi) as per the Eq.6 or 10 and then total damping (ζi+ζs)
Calculate EPD equivalent stiffness as per Eq.2 or Eq. 8
Fig. 8(b) Variation in damping of triangular plate with relative displacement
Where E is the Young’s modulus of steel=2 x 10⁵N/mm2 and t is the thickness of the plate= 3mm. The Caughy’s stiffness and secant stiffness values for two types of triangular plates i.e. one having a=80 mm and b= 80 mm and the other having a=40 mm and b= 40 mm are evaluated from Eqs. (2) and (8) respectively. Damping ratios are also evaluated for these plates obtained from Caughy’s relationship and hysteretic energy expression from Eqns. (6) and (10) respectively. Total 8 nos (2 at each location) of dampers plates are attached at each storey of the structure in X direction. The stiffness and the damping ratios thus obtained for the 8 nos of 40 mm pales and 8 nos. of 80 mm plates considering frequency of structure as 6.15 Hz are plotted as a function of relative displacement at EPD ends as shown in Fig. 8. It is observed that the Caughy’s stiffness and secant stiffness closely matches with each other. The damping evaluated by the hysterisis method is also in close agreement with Caughy’s Damping. It is observed from Fig. 8 that use of Caughy’s damping and stiffness will give slightly higher response of the structure than hysteretic damping and secant stiffness. Thus use of secant stiffness and hysteretic damping will give more accurate results (i.e. closer to time history analysis) and use of Caughy’s stiffness and damping will be more conservative . It is observed that plate with a= 40 mm and b=40 mm is more stiffer and the damping ratio of this plate is also higher than the plate with a=80 mm and b=80 mm.
The total damping of the structure with Elasto-plastic Damper is obtained as follows:
ς = ςs + ςi (12)
where ςs is the damping ratio (0.035) of the structure without damper.
Fig. 11 Response spectra for various Damping values.
Fig. 10 Variation of total damping values with base acceleration.
0 3 6 9 12 15 18 21 24 27 30 33 0.0
0.5 1.0 1.5 2.0 2.5 3.0 3.5
A
c
c
e
le
ra
ti
o
n
i
n
m
/s
2
Frequency in Hz.
3.5 % damping 4.0 % damping 5.0 % damping 6.0 % damping 7.0 % damping 8.0 % damping 9.0 % damping 10.0 % damping 11.5 % damping
0.0 0.2 0.4 0.6 0.8 1.0 1.2
0 2 4 6 8 10 12 14 16 18 20
Plates with a=40 mm ,b=40 mm Plates with a=80 mm ,b=80 mm
Damping
(
%
age)
Acceleration in (g)
(ASCE 4-98). The displacements obtained at the EPDs using response spectrum at that equivalent damping are again used to obtain modified Caughey’s / secant stiffness and damping of the EPDs. This process is repeated until the difference of the displacements in the successive iteration is 1 % or less. The flow chart of IRS method is given in Fig. 9.
6. DISCUSSION OF THE RESULTS
IRS method is applied to the structure with two damper plates at each location. Analysis is carried out for two cases one with plates having a=40 mm and b=40mm and other with plates having a=80 mm and b=80 mm. The plates have same yield force of 420 N however the yield displacement of plate with a=40 and b=40 is 0.8mm while that of plate with a=80 and b=80 is 2.9 mm. Analysis is carried out for increasing values of base acceleration from 0.1g to 1g. The equivalent stiffness values and damping values are obtained for the plates from Fig. 8 for different relative displacements. At each storey there are 8 no. of plates acting in X direction hence the damping and stiffness values are given for 8 plates. Total damping given by the plates is obtained corresponding to relative displacement of the storey from Fig. 8(b). Damping obtained from plates (Fig. 8) is added to initial damping of the structure as stated in Eq. 12. For 0.6g the relative displacement between top storey and 2nd storey is 2.4 mm which corresponds to 4.5 % damping ( Fig. 8(b)) and relative displacement between 2nd storey and first storey is 4.95 mm which corresponds to 2.5 % damping (Fig. 8(b)). Hence total damping given by 16 nos of plates (a=40 mm) attached to the structure in X direction is 10.5 % ( inclusive of initial damping of 3.5 %). The variation damping ratios with base acceleration in X direction obtained after first iteration for the structure is shown in Fig. 10. It is seen that damping ratio obtained for the structure with 40 mm plate is higher that that with 80 mm plate. This is due to the fact that the yield displacement of the damper with height 40 mm is less than the damper with height 80
0.0 0.2 0.4 0.6 0.8 1.0 0
3 6 9 12 15 18 21 24
Top Storey
Ti-Hi Analysis without damper
Ti-Hi Analysis with EPD (size 80 mm) Ti-Hi Analysis with EPD (size 40 mm) IRS Analysis with EPD(Size 80 mm) IRS Analysis with EPD (Size 40 mm)
X
Direction
Displacement
(mm)
Base acceleration in g
0.0 0.2 0.4 0.6 0.8 1.0
0 2 4 6 8 10 12 14 16 18
2nd Storey
X
Direction
Displacement
(mm)
Base Acceleration in g
0.0 0.2 0.4 0.6 0.8 1.0
0 2 4 6 8 10
X
Direction
Displacement
(mm)
Base acceleration in g
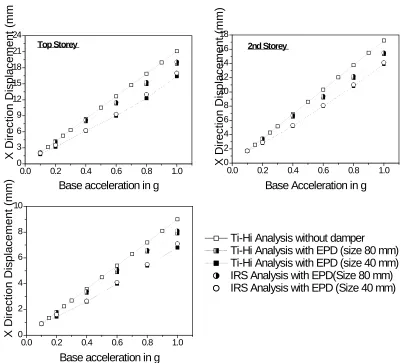
Fig. 12 Comparison of response of structure using IRS technique and time history analysis
It is observed from the figures that IRS method evaluates conservative displacement compared to time history analysis. Hence IRS method can be used for design purposes. It is also observed that due to addition of EPD plates to the structure, there is 30 % reduction in the response of the structure with 40 mm plates and 15 % reduction in the response with 80 mm plates. The shift in the natural frequency of the structure due to addition of damper is less than 10 %. Hence the elasto-plastic damper can be effectively used to reduce the response of the structure without affecting the flexibility of the structure.
7. CONCLUSIONS
An experimental and analytical study of reducing the seismic response of RCC structure with yielding dampers is presented in the paper. In order to avoid time consuming time history analysis method, a simple response spectrum method with linearization techniques is discussed. It is shown that IRS method is a simple and conservative method which can be effectively used by designers to evaluate response of structures with dampers. Use of Caughy’s damping and stiffness will give slightly higher response of the structure than use of hysteretic damping and secant stiffness. The effect of change in height of damper plate on the response quantities of structure is also studied. It is shown that triangular plates having lesser a (height of EPD) will dissipate more energy and give more reduction in response. It is also observed that plates with lesser height increases the frequency of the structure however it should be checked that the change in fundamental frequency of the system is less than 10 %. Significant reduction in response of RCC structure is obtained when yielding damper plates were attached in the frames of the structure.
REFERENCES
2. Bakre, S.V., Jangid, R.S., Reddy, G.R. 2006 . Optimum Xplate dampers for seimic response control of piping systems. J Pressure vessels and Piping, 83 , 672-685.
3. Caughey, T.K. 1960. Sinusoidal Excitation of a system with Bilinear Hysterisis. ASME Journal of Applied Mechanics. 27, 640-643.
4. Chen.,Z. , Ge,H., Kasai, A. , Usami,T. 2007. Simplified seismic design approach for steel portal frame piers with hysteretic dampers. Earthquake Engng Struct. Dyn., 36 ,541–562
5. Chiba,T., Kobayashi,H., Yokoi,R., Suzuki,K., Mitsumori,T.,Shimizu,N.,Ogawa,N., and Minowa,c. , 1992. An experimental study of Seismic Response of piping System with the friction: Part 2- Simplified Method Focused on the reduction effect of the friction. Seismic Engineering Conference Proceedings . ASME PVP . 237, 243-248
6. Jennings, P.C., 1968. Equivalent Viscous Damping For Yielding Structures, Journal of Engineering Mechanics Division, ASCE, Vol. 94 , 103-116.
7. Kelly, J.M., Skinner, R.I., Heine, A.J. 1972. Mechanisms of Energy Absorption In Special Devices for use in Earthquake Resistant Structures. Bull NZ Soc Earthquake Engng, 5 (3), 63-73.
8. Mahmoodi, P.,1969, Structural Dampers. J. Struct. Div., ASCE, 95, 1661-1672.
9. McNamara, R.J., 1977, Tuned mass dampers for buildings, J Struct. Div, ASCE, 103, 1985–98.
10. Modi, V.J. and Welt,F. Vibration control using notation dampers. 1987. Proc. Int. Conf. on Flow Induced Vibrations, Brighton, UK 369–76.
11. Pall, A.S., Marsh, C., and Fazio,P. 1980. Friction Joints for Seismic Control of Large Panel Structures, J Prestressed Concrete Institute, 6, 38-61.
12. Park, Y.J., and Hofmayer, C.H., 1995. Practical Application of Equivalent Linearization Approaches to Nonlinear Piping Systems. Seismic Engineering Conference Proceedings. ASME PVP . 312, 187-200
13. Parulekar, Y.M., Reddy, G.R., Vaze, K.K., and Kushwaha, H.S. 2004. Lead extrusion dampers for reducing seismic response of coolant channel assembly, Nuclear Engineering and Design, 227, 175–183.
14. Reddy, G.R., Suzuki, K., Watanabe ,T. 1999. Linearization techniques for seismic analysis of piping system on friction support. J Pressure Vessel Technology. 121 , 103-108..
15. Scholl, R.E., Design criteria for yielding and friction energy dissipaters. Proc., ATC 17-1 on seismic isolation, Energy Dissipation and Active control, Vol. 2, 485-495.
16. Satish Kumar, K., Muthumani, K., Gopalakrishnan, N., Sivarama Sarma, B., Reddy, G.R., Parulekar ,Y.M. ,2002 . Seismic Response reduction of structure using Elasto-plastic Passive Energy Dissipation Indian Society for Earthquake Technology Journal, Vol.39 No. 3, pp-85-94.
17. Stoneking, J.E. and Boresi, A.P., 1970. A theory for free vibration of orthotropic shells of revolution. Nucl. Eng. Des. 14, 271-285.
18. Tsai, K.C., Chen, H.W., Hong, C.P., Su, Y.F. 1993. Design of steel triangular plate energy absorbers for seismic-resistant construction. Earthquake Spectra 9(3) 505-528.