Reliability and Security Analysis of Open Source Software
Prasanth Anbalagan
1Mladen Vouk
2Department of Computer Science , North Carolina State University, Raleigh, NC 27695, USA
1[email protected] 2[email protected]
Abstract
Existing reliability prediction and security assessment of open source software systems seem to focus on analysis based primarily on the number of faults reported against the software. Since information like problem reports, soft-ware usage level, and project’s behavior in terms of time taken to fix a problem report are publicly available, it is ad-vantageous to also consider these factors in analyzing open source projects. We study the characteristics of FEDORA (a popular open source project) problem reports for differ-ent releases and show that traditional reliability models can be utilized for prediction of problem rates across releases. Also, we estimate the risk exposure due to security problem reports, a subset of the total problem reports. We discuss metrics that could help end-users assess the trustworthiness of open source projects.
Keywords: Software reliability, Open-source software, trust, risk analysis.
1
Introduction
Current trend in widespread usage of open source soft-ware systems invites the need to analyze the behavior, char-acteristics, and quality of open source projects. Much of the existing analyses on quality of open source projects are limited to qualitative discussions e.g., [15], process level de-cisions based on statistical analysis e.g., [25], analyses in terms of the design attributes e.g., [7], analyses in terms of source code metrics e.g., [33], etc. Much less attention has been given to analyses from the perspectives of field usage of the software, project’s behavior in terms of time taken to report the faults and time taken to fix the faults.
Software reliability is an important characteristic of soft-ware quality [9, 20]. It helps provide a quantitative assess-ment of the software quality from the perspective of field usage of the software. Existing reliability analyses of open source software focus on models based only on the number of faults reported against the software i.e., fault count data e.g., [40, 41, 35]. Publicly available information like
soft-ware usage level in terms of number of users and project’s behavior in terms of the time taken to report the faults, and time taken to fix the faults, have not been considered in these analyses. We believe that it is necessary to take in to account all this information in order to gain a compre-hensive view of open source projects.
Similar to the general category of faults, security assess-ment i.e., analyses on security faults, have either been lim-ited to fault count data e.g., [1, 23] or are primarily qualita-tive e.g., [32, 16, 5]. Risk analysis is one of the important aspects of security assessment [8]. Often work on risk is done from the perspective of software proprietors i.e., in terms of cost impact on the software proprietors [4, 14, 19]. But for an open source project, the end-user is also a part of the development community. Hence security risk assess-ment for open source projects needs to be done not only quantitatively, but also from the perspective of an end-user. From the perspective of an end-user, trust is another fac-tor that is given importance in the open source community e.g., [6]. Existing research on analysis of trust in open source software has been primarily qualitative [6, 17]. Trust is closely tied to vulnerabilities [17], therefore analysis on the security trends observed with open source projects can help an end-user assess the trustworthiness of open source projects.
The objectives of this study is to
1. Study the characteristics of FEDORA project in terms of time taken to report and correct problems.
2. Study problem report and correction patterns across re-leases and compare trends in security and non-security problem reports.
3. Assess whether traditional reliability models can be used for prediction of problem rates across releases for both security and non-security problems.
4. Discuss possible end-user perceptions of security risk, in relation to security problem report rate and mean time taken to fix a security problem report.
6. Discuss an end-user’s perception of trust, in relation to security problem report and correction rates.
The rest of the paper is organized as follows. In Section 2, we discuss elements of software quality: software relia-bility, security risk and trust. In Section 3, we discuss the data used for our analysis. In Section 4, we discuss the pat-terns observed with the problem reports for eight FEDORA releases. In Section 5, we discuss the metrics estimated in our analyses. In Section 6, we discuss prediction of prob-lem rates per release and across releases. In Section 7, we discuss the security risk analysis. In Section 8, we discuss trust analysis. In Section 9, we discuss related work and Section 10 concludes the paper and looks at future work.
2
Quality
Quantitative assessment of software quality requires defining a set of characteristics important for the software, studying the behavior of the software, developing metrics and evaluating them against the defined characteristic [9]. Software reliability [12, 29, 26, 27] is one such key charac-teristic of software quality [9, 20].
2.1
Software reliability
Software reliability is defined as the probability of fail-ure free operation of the software system in a given time and in a specified operational environment [29]. In order to estimate the reliability of a project [22], it is necessary to prepare or collect data required for the analysis. While data regarding the field failures and the operational environ-ment are required, factors like the severity of failures, fault removal process, and similar are also recommended [22]. With open-source system, it may be difficult to track fail-ures in operational environments, but may be possible to estimate this data from public records.
2.2
Security Risk
Security failures and security faults are a subset of the general category of software failures and faults [29]. We call a weakness or a fault in a software system that can be exploited by a malicious user a security problem or vulner-ability [39, 24]. We call an action or an attempt to exploit this vulnerability, with intention or by accident, an attack. We define a security risk as the probability (P) that an at-tack occurs and succeeds multiplied by the damage or cost that exploitation of the vulnerability entails [8], i.e.,
Risk=P[successf ul attack]×Cost (1)
Cost may include different types of losses both qualita-tive and quantitaqualita-tive, both real and perceived. This means
that we need to collect information that tells us how often a product may fail in the field, how many latent faults there may be in the product, how many of those may be security vulnerabilities, how many materialize in practice as security failures, and how prompt and diligent software developers are in mitigating such issues. Of course information about the cost of all these failures is also needed, as is informa-tion about the operainforma-tional profile of the product [28]. Con-structing the latter requires, among other things, informa-tion about the usage level of the product in the field [28, 12]
2.3
Open Vs Closed Source System
Security-risk analysis has been applied to both open-source and closed-open-source software systems by a number of researchers e.g., [11]. Also, a number of security risk mod-els have been proposed [4, 14, 19]. Many of these modmod-els focus on metrics such as annual loss expectancy, savings, benefits, return of investment, etc. In addition to the above metrics, the models also deal with the estimation and pre-diction of the number of vulnerabilities in a software sys-tem [1, 13, 23, 3]. This is further discussed in section 9.
With closed-source software systems, information about vulnerabilities is often made available only after the prob-lem has been resolved and a fix has been released1. There
is a reason for this. The argument is that releasing infor-mation about a security problem may increase the risk for end-users since it makes a larger number of potential hack-ers aware of it, and until a fix is available, this increases the exposure of the end-users to danger. A counter-argument is that hackers probably already know about the problem, and not releasing information about a vulnerability imme-diately prevents end-users from taking precautions and also erodes the trust of the end-users. For example, how many of the problems have they not told us about? Since the proprietor may not release information regarding develop-ers activities, security-risk analysis on closed-source sys-tems is often restricted to the count of vulnerabilities. Even in the cases where the software proprietor makes informa-tion available to individual researchers, analyses have been primarily targeted toward metrics such as loss in terms of investment [4, 14, 19]. This should be contrasted with re-porting of non-security faults and failures by vendors. Ven-dors have been much more open about that and a number of data suites and reports exist that discuss and model fail-ures, faults, availability, reliability, and in general problem related costs of commercial software [29, 22].
With Open-source software systems, much of the project behavior is visible to an end-user. Problem reports or faults against the vulnerabilities are tracked through open bug tracking systems. These problem reports maintain infor-mation from the time the problem was reported until the
problem is resolved. This allows us to estimate problem reporting rates, problem correction rates, and probable du-ration of exposure of the end-users to the described security problems or vulnerabilities.
2.4
Trust
”Trust is defined as the degree of confidence that exists that the software will be acceptable for one’s needs” [17]. With open source software, a weakness in a system can be identified either by a user or developer, who would fix it, or by a cyber criminal who would exploit the weakness. There is always a race between the ”‘good guys” and the criminals as to who can spot the weakness first [18]. The degree of confidence with which a user may view open source soft-ware might depend on factors such as how quickly the de-veloper fixes a vulnerability, how difficult it is to exploit a vulnerability, the impact due to such exploits, etc.
3
Data
Some existing reliability studies of open source projects e.g., [40, 41] concentrate on projects from SourceForge2.
The size of the projects are relatively small with the total number of faults reaching approximately 500 . Tamura et al. [35] provide numerical illustrations based on FEDORA release 6. But their data included only the number of faults reported against FEDORA version 6, those until October 2006. This is even smaller than the number of faults in small scale projects used by other studies e.g., [40, 41]. Alhazmi et al. [1, 23] focus their analyses on the number of vulnera-bilities found in REDHAT3operating system (version 6.2). This work does not consider the project’s behavior on the faults or problem reports associated with the vulnerabilities like the time taken to fix a fault. Considering the factors of popularity, significant size in terms of number of faults reported, complete information about the project’s behavior on the faults etc., we selected FEDORA as the subject for our analyses.
Fedora4is a free and open source linux based operating
system developed and maintained by the the open-source community Fedora Project5. FEDORA is sponsored by
REDHAT.
3.1
Problem Reports
FEDORA problem reports are tracked through RED-HAT’s bug-tracking system6. The Common Vulnerability
2http://sourceforge.net/ 3http://www.redhat.com/ 4http://fedoraproject.org 5http://fedoraproject.org/wiki/ 6http://bugzilla.redhat.com/
Exposure7 database and National Vulnerability Database8 maintain a list of publicly known security vulnerabili-ties and exposures. The security vulnerabilivulnerabili-ties logged in against FEDORA have a mapping or link to reports in RED-HAT’s bug-tracking system. This helped us identify the se-curity problem reports for each release of FEDORA.
Table 1 shows the problem report and registration statis-tics collected for FEDORA releases 1 to 8. The table shows the total number of security and non-security problem re-ports for each release of FEDORA. Also, the number of in-stallations or registrations for FEDORA releases 6, 7 and 8 are as shown. From the table, we find that security problem reports account for roughly 1% to 2% of the total problem reports. This is consistent with the rates reported by other researchers [1, 23]. Based on this percentage, we could assume that analysis on non-security problem reports may hold true for the total subset of problem reports as well.
3.2
System Usage
Ideally, we would have liked to collect the usage infor-mation of every system running FEDORA release. Usage information like the total number of systems in operation during a given time, the total operation time as well as downtime for each FEDORA releases. Due to the limited availability of information, we had to restrict our attention to the download statistics maintained by FEDORA project. Based on some assumptions and download statistics from FEDORA project, we were able to approximate the system usage for FEDORA.
We assume that the number of downloads or installations or unique IP addresses represent the total number of oper-ational systems. This may not be true since not all down-loads or installations may be actually operational. Based on this we can calculate the inservice time i.e., product of total number of systems and the time they have been operational. The FEDORA download statistics is only available from FEDORA release 6. Therefore our analysis has been done on FEDORA releases Zod (Release 6),Moonshine (Release 7), and Werewolf (Release 8).
Figure 1 shows the number of installations(actually registrations) for Zod(for 26 weeks from its release date),Moonshine(for 23 weeks from its release date), and Werewolf(for 26 weeks from its release date). The down-load statistics are collected only for a certain period after each release date. The data have been collected by the de-velopers only to observe if the number of downloads have reached a count of 2 million. Beyond that the data was not available. That obviously limits the range of analyses we can perform.
Table 1. FEDORA Statistics
Statistics FEDORA 1 FEDORA 2 FEDORA 3 FEDORA 4 FEDORA 5 FEDORA 6 FEDORA 7 FEDORA 8
No of security 31 82 128 154 201 194 92 26
problem reports(P Rs)
No of non-security 3141 4124 7528 7644 7805 7877 5468 4490
problem reports(P Rns)
Total no of 3172 4206 7656 7798 8006 8071 5560 4516
problem reports(P Rt)
Percentage ofP Rs 0.98 1.95 1.67 1.97 2.51 2.4 1.65 0.58
Registered users - - - 2864875 1920667 2152583
Figure 1. Number of installations Vs Calendar Time
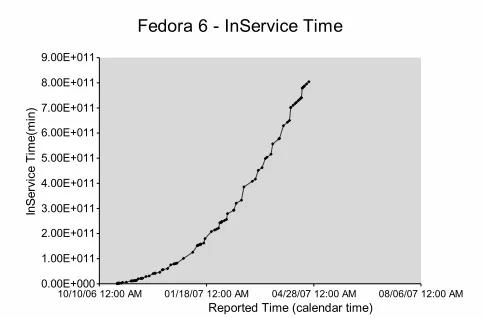
The calendar time or the operating time is defined as the cumulative sum of time after release of the software [29]. The inservice time refers to cumulative sum of the execution time of software [29, 12]. In our case, an upper bound on the inservice time can be estimated as
Inservice time(t) =
t X
i=1
∆ti×ni (2)
∆ti=ti−ti−1 (3)
where∆tiis time interval at i, andni is the total
num-ber of installations(registrations) in time interval i. In our analysis, the inservice time has been calculated from the point the software was released until the time for which the usage statistics were available. Growth of inservice time for FEDORA 6 is illustrated in Figure 2 vs Calendar time(Reported time).
Figure 2. InService Time
4
Problem Report Events and Patterns
Figures 3 and 4 show the Time-to-Problem-Report (TTPR) and Time-to-Problem-Correction (TTPC) for FE-DORA 6 non-security problems. The figures also show the calendar time when FEDORA 6 and FEDORA 7 were re-leased. The horizontal axis shows calendar time at which the problems were reported, and the vertical axis shows the time in minutes between successive problem reports (TTPR) and the time to corrections(TTPC) from the time a problem was reported. In this section, we discuss the pat-terns with problem report and corrections by dividing the total observation period in to three distinct regions: burn-in period (time period during which the software is developed and is not yet officially released i.e., time period before the official release of the software), the actual period (time pe-riod between release of current version of the software and the next version), the after period (time period after official release of the next version).
devel-Figure 3. Time To Problem Report
Figure 5. Problem correction activity in after period
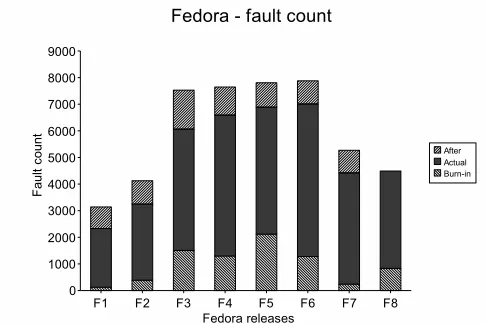
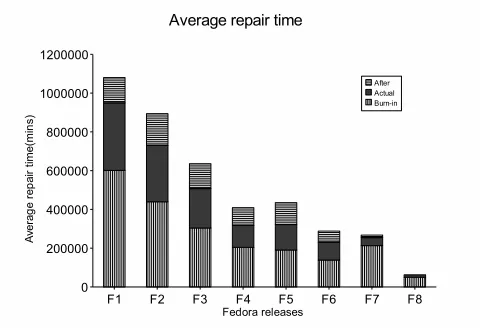
opment of FEDORA 6. The actual period is the time pe-riod between official releases of FEDORA 6(current ver-sion) and FEDORA 7(next verver-sion). The after period is the time period after release of FEDORA 7. Also, the release dates for test versions of FEDORA 6 are marked as T1, T2, and T3, T1 being the first test release and T3 being the last test release. Figure 5 shows the total number of days spent in correcting problem reports for a particular release during its after period. Figure 6 shows the total number of faults during each of the three periods. Figure 7 and 8 show the average repair and report time during each period. The av-erage repair and report time is defined as the avav-erage repair
Figure 6. Fault count during each period
and report time of all problem reports found during each of the three periods.
From figure 3, we see that as the project progresses from the burn-in period into the release date, the time interval be-tween problem reports appears to keep decreasing. The de-crease become more prominent soon after the release of test versions. More number of problems are being reported dur-ing the actual period (from figure 6). This may be caused by an increased number of users using the software after the official release of the product and finding more faults. This is also evident from figure 8 which shows that the average time to report reduces significantly when compared to the burn-in period average.
ac-Figure 4. Time To Problem Correction
tual period, we observe that after several months in to the release, there is an increase in time interval between prob-lem reports, possibly indicating that product is getting better (provided the old problems have been fixed). The trend con-tinues until the next release is made, and even for a small period after the next release. The average time to report increases from actual period to the after period. Figure 6 shows that the number of faults reported during the after period is less. This may be due to the fact that users may be moving to the new version.
The time to problem correction during the burn-in pe-riod is longer compared to that of the actual and after peri-ods. Similar to the trend with problem reporting, the time to problem correction reduces as the project progresses to-ward the test release and official release of the software. The number of problems reported during the burn-in period is very less. This may be because more time is spent on development of features rather than testing activity.
Soon after release of the first test version, we find that the time to problem correction decreases more intensely. Since more problems are reported during the actual period, devel-opers may tend to fix it quickly. Also, we observe the trend continues in to the after period. From Figure 5, we find that the number of days spent in correction activity during after period reduces as the project progresses through the eight releases. Based on this, we can note that the calendar time by when all problem reports for an older release is resolved moves closer to the release date of the new version. This may be because any time constraint by which the develop-ment team have to resolve all problem reports of the older release decreases as the project progresses over releases, or developers may move the problem reports to the newer
re-lease i.e., close the problem reports for the older rere-lease and provide the fix in the newer release, or developers may prefer to resolve the problem reports for the older release quickly so that they can concentrate more on the problem reports for the new release.
Figure 7. Average Time to Repair)
4.1
Non-security
Vs
Security
Problem
Reports
Figure 8. Average Time to Report
or not. Here we focus on the interdependence between se-curity and non-sese-curity problem reports.
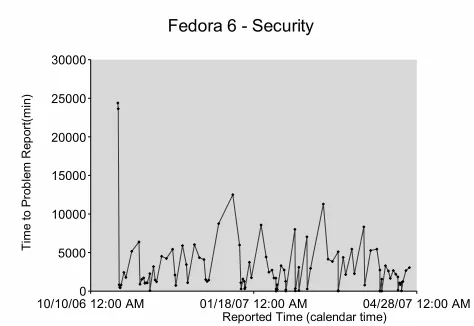
Figure 9. Time To Problem Report
Figures 9, and 10 show TTPR and TTPC respectively for security problem reports for FEDORA release 6. Fig-ures 11, and 12 show the comparison of average time to re-pair and average time to report for non-security and security problem reports. From Figure 9, we find that the TTPR for security problems are relatively constant. Security problem reports do not seem to be influenced by the occurrence of non-security problems. Figure 12 also confirms this trend where the average time to report is constant in comparison with varying values for non-security problem reports across all releases.
From figure 11, we find that average time to repair a se-curity problem remains almost constant for all releases. In contrast to this, the average time to repair for non security
Figure 10. Time To Problem Correction
Figure 11. Non security Vs Security (Average Time to Repair)
problem reports shows a gradual decrease from FEDORA release 1 to 8. This may indicate that developers may be concentrating more on non security problem reports due to its large volume and no extra priority is given to resolving security related issues.
5
Problem Report Rates and Correction
Rates
5.1
MTTPR
mean-Figure 12. Non security Vs Security (Average Time to Report)
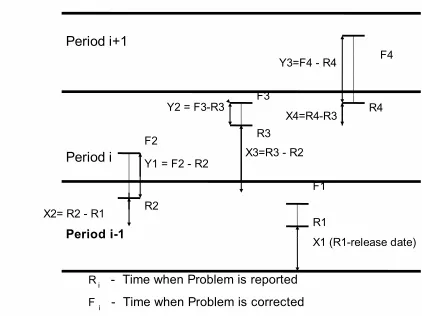
time-to-failure. Figure 13 shows a sample window of two periods consisting of four problem reports marked with the time when the problems were reported and corrected.
Figure 13. Problem Report and Correction Time Intervals
In the period i-1, the Mean Time to Problem Report would be estimated as the average of X1 and X2.
5.2
MTTPC
Mean Time To Problem Correction(MTTPC) is defined as the average time taken to correct problem reports [29]. It is a considerably more meaningful metric in the context of this paper. Once the problem is reported, on the average, it might take that long to apply a fix and terminate exposure to
that particular problem. For period i+1 in figure 13, Y2 and Y3 indicate the correction time spent for problem reports 3 and 4. The total correction time spent in the period i is given by the sum of time periods Y2 and Y3. The Mean Time to Problem Correction is given by the total correction time divided by the number of problems reported in a period. For period i, the Mean Time to Problem Correction is the total correction time divided by two (since only problems 3 and 4 were reported in that period). Figure 14 shows, for FEDORA 6, this particular way of assigning Mean Time To Problem Correction. Vertical axis is MTTPC in minutes, and horizontal axis is inservice time (also in minutes).
There is one thing to note, however. Once a problem is reported, its TTPC may be longer than the next window of interest. In that case, exposure to announced or open problems needs to include not only the problems found in that particular period, but also the ones found earlier and not yet closed.
Figure 14. Mean Time To Problem Correction
6
Problem Report Rate Prediction
In a typical case, it is unlikely that all the problem re-ports logged result in a field failure. Therefore the number of problem reports can be used to perform a worst case anal-ysis. Let the problem report rate in the time interval i (λi)
be estimated by .
λi =
((no)i+ (nf)i)
(ni×∆ti) (4)
where(no)i represents the number of open problem
re-ports from the previous week,(nf)i represents number of
problems reported in time interval ∆ti (e.g., in minutes).
The number of users (ni) in time interval∆tiis very large
((no)i+(nf)i). This is also evident from Table 1. It is worth
noting thatλiis different from the inverse of theM T T P Ri.
The latter reflects arrival time of unique problem reports in the calendar time frame, while the former reflects the num-ber of open reports with respect to the inservice time during time period i. We may wish to useλwhen discussing the quality of the system as a whole, and MTTPR in the con-text of calendar-based problem resolution rate. The problem correction rate can be estimated through the inverse of the Mean Time To Problem Correction (MTTPC), where this time refers to problem reports in time frame i.
µi=
1
M T T P Ci
(5)
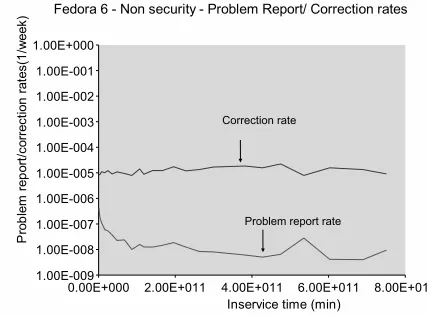
Figure 15 shows the weekly problem reporting and cor-rection rates for FEDORA 6. Under our assumptions, these rates exhibit behavior and consistency typical of low fail-ure rate systems for which we have actual total failfail-ure data e.g. failure and correction rates of telecommunication sys-tems [12]. Problem repair rate appears to be relatively con-stant, and several orders of magnitude larger than the re-porting rate for unique problems. The problem rere-porting rate appears to be a decreasing function of inservice time.
Figure 15. Problem Report and Correction rates
Since the FEDORA releases exhibit the same character-istic with respect to problem report and corrections, we ob-served the parameters estimated for a particular release of the software can be applied to the next release as well. This may be useful in assessing the system’s possible availabil-ity and vulnerabilavailabil-ity, as well as in planning when to make a transition to a new system. Musa’s Logarithmic Pois-son Execution Time (LPET) model [30] was applied to FE-DORA 6 data to model the problem report rate. Figures 16 and 18 show the LPET fit for FEDORA 6 security and non-security problem report rates. Figures 17 and 19 show the fit for FEDORA 7 problem report rate using parameters
Figure 16. Problem report rate and LPET fit
Figure 17. Fedora 7 - Fit from Fedora 6
from FEDORA 6 release. Similar results were obtained for FEDORA 7 and FEDORA 8, and both security and non-security categories.
7
Security Model
In this section, we discuss possible end-user perceptions of security risks. Some of the questions an end-user may ask are: What is my risk exposure today, and what might it be three weeks from now? What is the probability that 6 weeks from now, my system will not experience security problems? What is the effect of the possible security faults on the availability of my system?
as-Figure 18. LPET fit for Problem report rate
Figure 19. Fedora 7 fit using Fedora 6
sume that during the time a problem report associated with a vulnerability is being fixed, an end-user may be attacked. Although problems in most cases would have existed from the beginning, the perception of an end-user about an in-creased security risk may heighten only when the problem is reported and not yet fixed.
At the start of the paper, we have assumed that security risk is proportional to the probability of a successful attack. However if we assumeλis the attack or problem exposure rate and MTTPC is the exposure time during a week, then risk can also be approximated as
Risk∝λ×M T T P C×Cost (6)
For an end-user, cost is best related to the impact of an attack in terms of system availability, workarounds for the problems, extent of damage, etc. We used the severity of problem reports as defined by REDHAT to define cost associated with an attack. We considered four categories
Figure 20. Problem report and Correction rates
of problem reports namely low, medium, high and urgent, based on severity classification from REDHAT’s bug track-ing system. Low severity indicates that it is a minor prob-lem and workaround is available. Medium severity indi-cates that the problem is a bug and has to be fixed. No workaround is available in this case. High severity indicates temporary system unavailability e.g. problems like crash, memory leak, etc. Urgent severity indicates total system un-availability e.g. system does not boot. In our illustrations, we used a linear cost model, specifically numbers from 1 to 4 for levels low to urgent to quantify cost. But cost could be any appropriate number. For example, logarithmic scale could be used to assign numbers to cost perhaps 1, 10, 100, 1000, or actual dollar costs, etc.
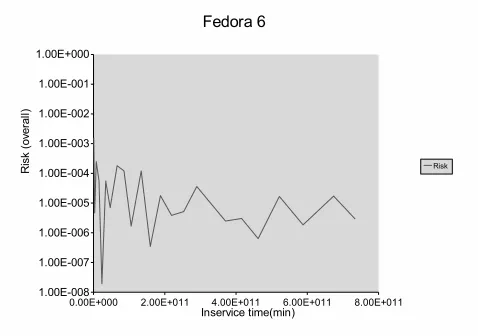
Figure 21. Risk
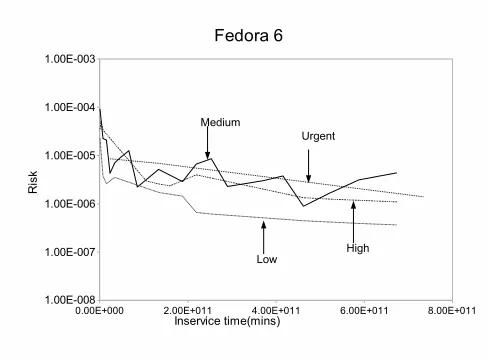
Figure 22. Risk
for FEDORA 6 security problems. Figure 21 shows the overall risk calculated using equation (6) and Figure 22 shows the risk calculated using equation (6) for the four in-dividual categories of severity of problem reports. In this case the cost is an average of the reported severity numbers. From the figure, we see that the risk due to medium severity problem reports is higher than the risk due to high severity problem reports. As the project progresses, we find that risk due to medium severity problem reports is higher than that of urgent severity problem reports as well. But considering the overall trend, risk decreases as the project progresses.
7.1
Model
When a problem report is tagged as a security problem, it is possible that the problem could be unexploitable i.e., the problem could be hidden in the source code such that it is not accessible to any attacker. Also, the degree with which a security problem can be exploited depends on the environment in which the end-user is operating. In order to completely describe a system that captures an end-user’s security risk, it is necessary to study how many of these se-curity problem reports actually lead to field failures. Unfor-tunately, this information is not always available. However, earlier discussed data indicate that our estimated vulnerabil-ity exposure rate appears to be a relatively slowly changing function of time, as does individual system risk level.
In general, the problem is a multi-state multi-transition problem, but we believe that in the first approximation a simple two-state model may be able to capture most of the end-user’s security transitions over time.
Since the problem report rates and problem correction rates vary with time, a non-homogeneous Markov chain model would be appropriate. Consider a continuous-time stochastic process X(t) (X(t),t∈R+). Let X(t) represents
the system being in state ’Safe’ or state ’Attacked’. Figure 15 shows the model
Figure 23. Security Risk Model
Letλ(t) be the problem report rate andµ(t) be the prob-lem correction rate (i.e., exposure that leads to an attack). From Figure 23 we find thatλ(t) dt is the transition prob-ability from system safe state to the risk state. µ(t) dt is the transition probability from system risk state to the safe state. For each state, the probability of remaining in the same state is given by 1-λ(t) dt and 1-µ(t) dt for safe or attacked state respectively. Of special interest is the prob-ability of remaining in the safe state. This is equivalent to reliability, i.e., the probability of not being attacked during inservice time which runs from t=0 to t=W.
PN ot Attacked(0to W) = W Y
i=0
(1−λi∆ti) (7)
Where in our case time increments are in weeks and ∆ti
is the inservice time during a particular week. This is a discrete time approximation.
In the case only the final state is of interest (e.g., as in the availability at time t) one can, following [12], form the transition probability matrix as follows:
P =
1−λ(t)dt λ(t)dt
µ(t)dt 1−µ(t)dt
(8)
Then solve for a particular state out of n transition peri-ods, for example, numerically e.g. [34, 38, 12].
Figure 24. Safe state probability
probability of a successful attack exponentially decreases over time i.e., the chances of a successful attack is high ini-tially, but reduces exponentially over time since attackers stop attacking after a certain period of time. In such a case, problem exposure is not constant. But we assume prob-lem exposure to be constant due to unavailability of such data for FEDORA. Figure 24, based on equation 7, shows a conservative estimate of the probability that FEDORA sys-tem remains unexposed over its inservice time (shown in minutes). The span of the horizontal axis is over about 23 weeks.
8
Establishing Trust
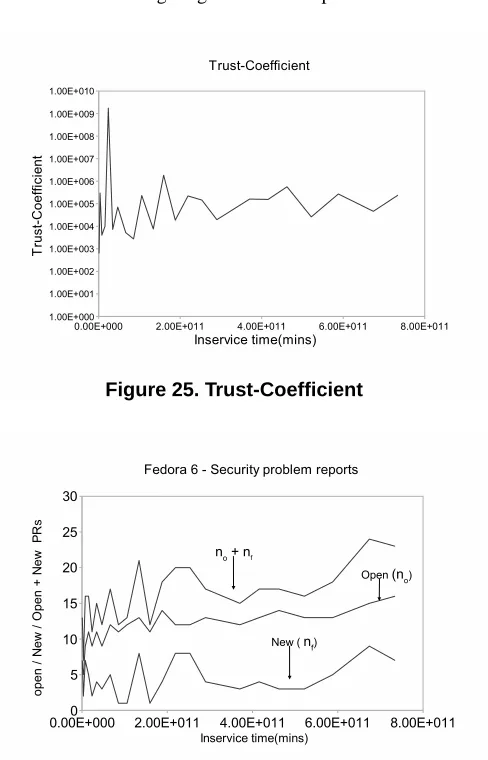
It is reasonable to assume that from an end-user perspec-tive the degree of confidence a user might have in a soft-ware product would be related to the number of problems reported about the product given how long it has been in the field and how quickly the problems are resolved. We define trust-coefficient (Tc) to be inversely proportional to the rate
at which the problems are reported and directly proportional to the rate at which the problems are repaired.
Tc ∝
µi
λi
(9)
From Figure 25, we see thatTc is a relatively constant,
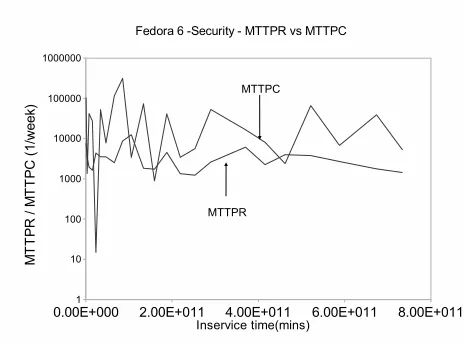
perhaps slightly increasing function of inservice time. Fig-ure 26 shows the plot for(no)i,(nf)i and(no)i + (nf)i.
Figure 27 shows the MTTPR and MTTPC for FEDORA 6 security problems. From the figures, we can observe that the MTTPR is roughly of the same order as MTTPC with both having considerable variance, and the overall number of open problem reports appears to be growing. This in-dicates that there is at least some backlog. In addition to the system facing latent problem exposure, it faces
back-log problems as well. This might indicate that the potential for a security breach may be getting worse since there are more problems that can be used to attack an individual sys-tem. On the other hand, sinceλ(and MTTPR as well) is a slightly decreasing function of inservice time, the overall security profile of the system is probably be getting better since it is now taking longer to find new problems.
Figure 25. Trust-Coefficient
Figure 26. Fedora 6-Security problem reports
8.1
Exploitability
Exploitability score identifies the level of difficulty for an attacker (in terms of access, complexity, and authentica-tion) to exploit a vulnerability. Impact score identifies the impact (in terms of confidentiality, integrity, and availabil-ity) when such a vulnerability is exploited. Both factors have been extracted from the Base metric group proposed by the Common Vulnerability Scoring System9.
Figure 27. Fedora 6 - MTTPR vs MTTPC
The exploitability score is formed using three compo-nents namely access vector, access complexity, and authen-tication vector. The access vector tells about the location of the attacker in terms of being present at the machine lo-cally, or in adjacent network or in a remote network. The access complexity tells the complexity level(high, medium or low) involved in exploiting the vulnerability. Authentica-tion vector tells how many times(multiple,single or none) an attacker has to authenticate in order to attack a user. Sim-ilarly, the impact score is composed of confidentiality, in-tegrity, and availability impacts. All three components can have values of None, Partial and Complete with respect to loss of Confidentiality, Integrity, and Availability. This im-pact score could also be used as the cost factor in computing the risk curve.
Letλcbe the problem report rates estimated for each of
the four categories of problem reports. Both impact and ex-ploitability scores are in the range of 1 to 10. Exex-ploitability and Impact can be estimated as follows
Exploitability = λc×Exploitability score (10)
Impact = λc×Impact score (11)
From Figure 28 and 29, we find that until week 10-13, users were not subject to total system unavailability. Also minor problems appear to cause higher impact than other categories. Week 10-13 shows low chances of total system unavailability. Toward end of week 17-20, irrespective of the severity of the problems as well as the difficulty with which problems could be exploited, the impact appears to have remained the same. Week 24-26 shows a different trend. Though the chances of all categories of problems increase, the impact due to such problem reports appear to decrease. This suggests that even though users may see an increase in the problem reports and possibly failures due to
Figure 28. Exploitability
Figure 29. Impact
exploitation of the reports, the consequences would be less than those observed during earlier periods. Interestingly, this is consistent with the overallλtrend. Overall we can observe that as the project progresses, the problem report trend and impact due to security problems decrease which is a good sign for the project as well as the user. The data shown in this paper are for Fedora 6. Similar trends were observed for Fedora 7 and 8.
9
Related Work
we mean the rates at which problems are exposed for end-users.
Tamura et al. [36] combine neural networks and software reliability approach to estimate reliability, considering the effect of each software component. The authors associate weight parameters to the interaction among components. Reliability equation is modeled using the weight parame-ters and failure intensity function. Based on the fault count data, the failure parameters are estimated. In our paper, we consider the software as a black box and analyse the prob-lem report process.
Paul et al. [21] empirically test their hypothesis that weibull model is better compared to other reliability mod-els for predicting faults in multiple releases of a software. In our paper, we show that using traditional reliability models like LPET, one can predict problems for future release using parameters estimated for the current release of the software. Martin et al. [25] present a statistical analysis on the defect reports of Debian Linux system. The authors study the accumulation of open bug reports and correlate the trend with defect removal rate. Further they study the impacts on defect removal process due to bursts of activity (to study if defects are removed in bursts rather being a gradual removal process), influence of popularity or importance of software packages, importance of modifications and uploads of new versions of the software, maintenance of the software pack-age by one person or a team. In complement to their hy-pothesis about the trends in problem reports and problem correction, we present a study of security trends in open source software and extend it for risk and trust analysis.
Zhou et al. [40] study the bug reports for popular open source projects from Sourceforge. They observe bug report-ing patterns across the projects and also identify that open source projects exhibit similar reliability growth compared to closed source projects. The authors study the applica-bility of Weibull distribution model to explain the failure process data. Also, they study the correlation of page views and downloads with bug arrival rate. While their approach focuses on only newly opened bugs per month, we take in to account the problem report rate, problem correction rate, as well as the software usage level in our analyses.
Cramp et al. [12] study the unavailability of large soft-ware based telecommunication system. The authors study the failure and recovery rates across various releases and present a simple two state markov model to approximate the unavailability of the system. In our analysis of FEDORA, we find that the problem report and correction rates exhibit behavior and consistency typical of low failure rate systems like the software based telecommunication system studied by Cramp et al.
Alhazmi et al. [2] experiment their vulnerability discov-ery model on Redhat linux, another popular open source software, along with other major operating systems and
evaluate the accuracy of the model in predicting long term and short term number of vulnerabilities. Their experimen-tation with REDHAT focuses on the number of vulnerabil-ities reported against the operating system. In addition to the number of vulnerabilities, we take in to account sys-tem usage level and project characteristics in terms of time taken to report and correct problems to analyse the security trends.
10
Conclusions and Future Work
We have studied the problem reports for FEDORA oper-ating system and identified trends with problem report and problem correction across releases. Based on the informa-tion available through the bug tracking system, we have pro-vided security risk and trust analysis of FEDORA using tra-ditional reliability techniques. We find that the non security problems do not have any influence on security problems based on the behavior that security problems have a constant time to report while that of non security problems change over time. It is shown that ”classical” reliability models could be applied to the data to provide satisfactory estimates of future risk exposure, and that a more complex Markov-based model could be used to account for more complex transitions and states. Examination of the security problem report trends and other security metrics provide useful infor-mation about the project’s behavior. Thus we can propose that such quantitative results, coupled with qualitative dis-cussion, would help understand and evaluate open source projects better, and thereby establish one’s level of trust in the software.
Existing studies are mostly based on faults. Faults only represent the unique number of problems present in the sys-tem. It is necessary to base reliability analysis not only on the number of faults but also on the actual failures caused by such faults. Since information about failures is not read-ily available for open source projects, one of the open issues lie in relating faults to failures. As an initial step, we have showed that existing reliability models can be used in es-timating problem report rates. Next direction would be to collect data on failures, relate faults to failures, study the application of existing reliability models, and develop mod-els to quantitatively estimate quality factors like risk and trust for open source projects.
One other open issue lies in analysing the effects of publicly disclosing such information about problem reports i.e., compare it against the policy of closed source systems where such information are not disclosed. Although in-formation about closed source systems are not available in the form of problem reports, the closest we could get to is through security threat reports10 about the average time
taken to provide fix to problem reports. If we could get further data on the failures (which still remains a open is-sue), we would be able to compare selected open source and closed projects quantitatively.
References
[1] O. H. Alhazmi and Y. K. Malaiya. Modeling the vulnera-bility discovery process. In ISSRE ’05: Proceedings of the
16th IEEE International Symposium on Software Reliability Engineering, pages 129–138, Washington, DC, USA, 2005.
IEEE Computer Society.
[2] O. H. Alhazmi and Y. K. Malaiya. Application of vulnerabil-ity discovery models to major operating systems. Reliabilvulnerabil-ity,
IEEE Transactions on, 57(1):14–22, March 2008.
[3] O. H. Alhazmi, Y. K. Malaiya, and I. Ray. Measuring, an-alyzing and predicting security vulnerabilities in software systems. Computers & Security, 26(3):219–228, 2007. [4] A. M. Anderson. Comparing risk analysis methodologies.
In David T. Lindsay and Wyn L. Price, editors, Proceedings
of the IFIP TC11, Seventh International Conference on In-formation Security, IFIP/Sec 91, IFIP Transactions, pages
301–311, May 1991.
[5] R. Anderson. Security in open versus closed systems the dance of boltzmann, coase and moore. In In Conference on
Open Source Software Economics, pages 1–15. MIT Press,
2002.
[6] M. Antikainen, T. Aaltonen, and J. V¨ais¨anen. The role of trust in oss communities - case linux kernel community. In
OSS, pages 223–228, 2007.
[7] V. R. Basili, L. Bri, and W. L. Melo. A validation of object-oriented design metrics as quality indicators. IEEE
Trans-actions on Software Engineering, 22:751–761, 1996.
[8] B. W. Boehm, editor. Software risk management. IEEE Press, Piscataway, NJ, USA, 1989.
[9] B. W. Boehm, J. R. Brown, and M. Lipow. Quantitative evaluation of software quality. In ICSE ’76: Proceedings
of the 2nd international conference on Software engineer-ing, pages 592–605, Los Alamitos, CA, USA, 1976. IEEE
Computer Society Press.
[10] L. Carin, G. Cybenko, and J. Hughes. Cybersecurity strate-gies: The queries methodology. Computer, 41(8):20–26, 2008.
[11] S. Comino and F. M. Manenti. Open source vs closed source software: Public policies in the software market. Industrial Organization 0306001, EconWPA, June 2003.
[12] R. Cramp, M. Vouk, and W. Jones. On operational availabil-ity of a large software-based telecommunications system. In
Proc. Third Intl. Symposium on Software Reliability Engi-neering, pages 358–366, 1992.
[13] K. Goeva-Popstojanova, F. Wang, R. Wang, F. Gong, K. Vaidyanathan, K. Trivedi, and B. Muthusamy. Char-acterizing intrusion tolerant systems using a state transi-tion model. In DISCEX II: DARPA Informatransi-tion
Survivabil-ity Conference and Exposition, volume 2, pages 211–221,
2001.
[14] L. A. Gordon and M. P. Loeb. The economics of information security investment. In ACM Transactions on Information
and System Security, page 438457, November 2002.
[15] G. Gousios, V. Karakoidas, K. Stroggylos, P. Louridas, V. Vlachos, and D. Spinellis. Software quality assessment of open source software. In T. S. Papatheodorou, D. N. Christodoulakis, and N. N. Karanikolas, editors, Current
Trends in Informatics: 11th Panhellenic Conference on In-formatics, PCI 2007, volume A, pages 303–315, Athens,
May 2007. New Technologies Publications.
[16] J. henk Hoepman and B. Jacobs. Increased security through open source. Communications of the ACM, 50:79–83, 2007. [17] S. A. Hissam, D. Plakosh, and C. B. Weinstock. Trust and vulnerability in open source software. IEE Proceedings
-Software, 149(1):47–51, 2002.
[18] S. A. Hissam, D. Plakosh, and C. B. Weinstock. Trust and vulnerability in open source software. IEE Proceedings
-Software, 149(1):47–51, 2002.
[19] K. J. S. Hoo, A. W. Sudbury, and A. R. Jaquith. Tangible roi through secure software engineering. In Secure Business
Quarterly: Special Issue on Return on Security Investment.
@stake, 2001.
[20] ISO/IEC-9126. Software engineering product quality part 1: Quality model. In International Organization for
Stan-dardization, Geneva, Switzerland. ISO/IEC 9126-1:2001,
2001.
[21] P. L. Li, M. Shaw, J. Herbsleb, B. Ray, and P. Santhanam. Empirical evaluation of defect projection models for widely-deployed production software systems. SIGSOFT Softw. Eng. Notes, 29(6):263–272, 2004.
[22] M. R. Lyu, editor. Handbook of software reliability and
sys-tem reliability. McGraw-Hill, Inc., Hightstown, NJ, USA,
1996.
[23] Y. Malaiya, A. von Mayrhauser, and P. Srimani. An ex-amination of fault exposure ratio. In IEEE Transactions on
Software Engineering, pages vol. 19, no. 11, pp. 1087–1094,
Nov 1993.
[24] G. McGraw. Software Security: Building Security In.
Addison-Wesley, New York, NY, USA, 2006.
[25] M. Michlmayr and A. Senyard. A Statistical Analysis of
De-fects in Debian and Strategies for Improving Quality in Free Software Projects. Elsevier B.V., 2006.
[26] J. D. Musa. A theory of software reliability and its appli-cation. In IEEE Transactions on Software
Engineering,SE-1(3), pages 312–327, September 1975.
[27] J. D. Musa. Validity of execution-time theory of software. In IEEE Transactions of Software Reliability, volume R-28,no.3, pages 941–946, 1979.
[28] J. D. Musa. Operational profiles in software reliability en-gineering. In IEEE Software, volume 10,no.2, pages 14–32, March 1993.
[29] J. D. Musa, A. Iannino, and K. Okumoto. Software
relia-bility: measurement, prediction, application. McGraw-Hill,
Inc., New York, NY, USA, 1987.
[30] J. D. Musa and K. Okumoto. A logarithmic poisson exe-cution time model for software reliability measurement. In
ICSE ’84: Proceedings of the 7th international conference on Software engineering, pages 230–238, Piscataway, NJ,
[31] N. F. Schneidewind. Reliability - security model. In ICECCS
’06: Proceedings of the 11th IEEE International Conference on Engineering of Complex Computer Systems, pages 279–
288, Washington, DC, USA, 2006. IEEE Computer Society. [32] J. M. Smith, M. B. Greenwald, S. Ioannidis, A. D. Keromytis, B. Laurie, D. Maughan, D. Rahn, and J. Wright. Experiences enhancing open source security in the posse project. In S. Koch, editor, Free/Open Source Software
De-velopment, pages 242–257, Hershey, PA, 2004. Idea Group
Publishing.
[33] D. Spinellis. Code Quality: The Open Source Perspective
(Effective Software Development Series). Addison-Wesley
Professional, 2006.
[34] W. J. Stewart. Introduction to the Numerical Solution of
Markov Chains. Princeton University Press, 1994.
[35] Y. Tamura and S. Yamada. Comparison of software reliabil-ity assessment methods for open source software. volume 2, pages 488–492 Vol. 2, July 2005.
[36] Y. Tamura and S. Yamada. Software reliability assessment and optimal version-upgrade problem for open source soft-ware. Systems, Man and Cybernetics, 2007. ISIC. IEEE
In-ternational Conference on, pages 1333–1338, Oct. 2007.
[37] Y. Tamura and S. Yamada. Software reliability growth model based on stochastic differential equations for open source software. Mechatronics, ICM2007 4th IEEE
Inter-national Conference on, pages 1–6, May 2007.
[38] K. S. Trivedi. Probability and statistics with reliability, queuing and computer science applications. John Wiley and
Sons Ltd., Chichester, UK, UK, 2002.
[39] J. Viega and G. McGraw. Building Secure Software.
Addison-Wesley, 2001.
[40] Y. Zhou and J. Davis. Open source software reliability model: an empirical approach. SIGSOFT Softw. Eng. Notes, 30(4):1–6, 2005.
[41] F. Zou and J. Davis. Analyzing and modeling open source software bug report data. In Australian Software