Abstract
MATA, LUIS ALEXANDER. Sedimentation of Pervious Concrete Pavement Systems. (Under the direction of Michael L. Leming).
Pervious concrete pavement systems (PCPS) are a unique and effective means to address important environmental issues and support green, sustainable growth, by capturing stormwater and allowing it to infiltrate into the underlying soil. Sedimentation leading to clogging is a potential problem in serviceability of PCPS. The sedimentation rates of pervious concrete with 20% porosity were examined with three different soil types: sand, clayey silt, and clayey silty sand. Pervious concrete beam and cylinder specimens were exposed to sediments mixed in water to simulate runoff with heavy and typical load of soil sediments. Falling head permeability tests were performed in the specimens before and after exposure. Results show that storage capacity will be minimally affected by sediment. Exfiltration rate, however, can be affected by sediment characteristics in some situations. A simple, economical test for estimating exfiltration rates of the system in these situations was also developed. The results of this study were used to develop design guidelines that complement the hydrological design of PCPS considering the effects of sedimentation of the system at end of service.
subjected to freezing and thawing cycles using a unique and innovative test that considers realistic, slow freezing rates of partially saturated, pervious concrete disk specimens. Results confirmed previously published reports that sand must be included in the mixture to be frost
Sedimentation of Pervious Concrete
Pavement Systems
by
Luis Alexander Mata
A dissertation submitted to the Graduate Faculty of North Carolina State University
in partial fulfillment of the requirements for the Degree of
Doctor of Philosophy
Civil Engineering
Raleigh, North Carolina 2008
APPROVED BY:
_______________________ _______________________
Michael L. Leming David W. Johnston
(Chair of Advisory Committee)
_______________________ _______________________
Biography
Luis Alexander Mata was born in Caracas, Venezuela. He graduated from San Ignacio de Loyola School in 1993. He received his BS (2002) from the Department of Civil Engineering at Universidad Católica Andrés Bello, Caracas, Venezuela.
In January of 2003, he enrolled in graduate program in the Department of Civil, Construction and Environmental studying Construction Engineering and Management and started taking classes towards his Master of Science degree. He worked in the research project Implementation of Self-Consolidating Concrete (SCC) for Prestressed Concrete Girders (NCDOT Project 8.1170903), and his thesis was based on the data obtained from this study.
Acknowledgments
I would like to specially thank Dr. Mike Leming for serving as my advisor during my Master and PhD studies. His advice, guidance and encouragement during these years are invaluable. I also wish to thank Mr. Roberto Nuñez for all his help and advice throughout my years at North Carolina State University. I also would like to thank Dr. David Johnston, Dr. Robert Borden, and Dr. Bill Hunt for serving as members of my committee; and to Dr. Matt Evans for his help during the preliminary examination.
I would like to thank the Portland Cement Association Education Foundation for sponsoring this study and the Ready Mixed Concrete Company in Raleigh, North Carolina, for their help in producing the concrete batches. Special thanks are extended to Ken Vickers and David Emery, and the other personnel working at the Ready Mixed Concrete Company laboratory for their professional help, suggestions, and encouragement.
I would like to thank my friends Juan José Recalde, Oscar Fabricio Montesdeoca, José Antonio Zubillaga, César Octavio León, and Nicolas Souchon for their help in fabricating and testing the concrete specimens, and in other laboratory tasks that were essential to the completion of the study. Their unconditional help was truly invaluable.
Table of Contents
List of Tables ...xi
List of Figures...xiv
Chapter 1. Introduction ...1
1.1. Background ...1
1.2. Problem Statements ...4
1.3. Objectives...5
1.4. Methodology ...5
Chapter 2. Literature Review...7
2.1 Pervious Concrete Pavement systems (PCPS)...7
2.2 System Definition...8
2.3. Pervious Concrete Materials ...11
2.4. Fresh and Hardened Properties of Pervious Concrete...13
2.4.1. Density and Porosity...14
2.4.2. Permeability...16
2.4.3. Frost Durability ...19
2.4.4. Flexural Strength and Dynamic Modulus of Elasticity ...22
2.4.4. Compressive Strength ...22
2.5 Construction and Consolidation Effects of PCPS...23
2.6 Compaction Gradients in Pervious Concrete...24
2.7.1. The NRCS Curve Number Method ...29
2.8 Structural Design of PCPS...30
2.9 Sedimentation Effects of PCPS...31
2.9.1. Volume of Sediments...33
2.9.1.1. General Estimation of Sediment Production ...33
2.9.1.2. Universal Soil Loss Equation (USLE)...34
2.9.1.3. Sediment for Urban Land Use...39
2.9.2. Hypotheses on the Effects of Different Type of Sediments...43
2.9.2.1. Sand Sediments...44
2.9.2.2. Fine Grained Sediments ...46
2.9.2.3. Combined Sediments ...48
2.9.3. Layers and Multiple Soil Horizons...49
2.9.4. Sediment Deposition Pattern...50
2.9.4.1 Settling Velocities of Discrete Particles...54
2.9.5. Sensitivity Analysis ...58
Chapter 3. Experimental Research Methodology...63
3.1. Introduction...63
3.2. Overview of Experimental Tests...64
3.2.1. Volumes of Sediment and Runoff ...65
3.2.2. Phase I: High Sediment Load with Low Runoff Volume...65
3.2.3. Phase II: Typical Sediment Load with High and Low Runoff Volume ...66
3.3 Materials and Concrete Mixtures ...69
3.3.1. Mixing Procedures...70
3.3.2. Fabrication and Curing of Specimens...72
3.4. Test Methods...76
3.4.1. Mechanical Properties...76
3.4.2. Hydrologic Properties ...79
3.4.2.1. Porosity ...79
3.4.2.2. Permeability...82
3.5. Sedimentation Test ...88
3.5.1 Sediment Loads ...88
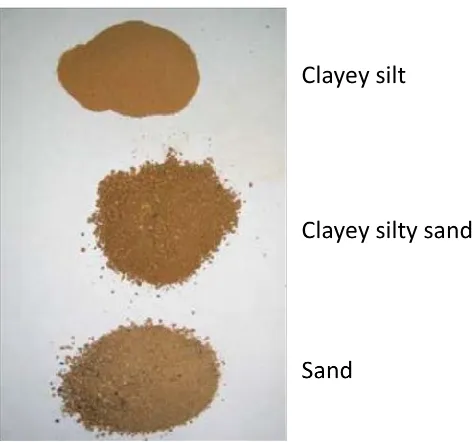
3.5.2 Soil Sediment Characteristics...89
3.5.3 Low Flow with High Sediment Load Test...92
3.5.4. High and Low Flow with Typical Sediment Load ...95
3.6. Sediment Permeability Tests...98
3.7. Frost Durability ...100
Chapter 4. Sedimentation Results and Discussion...104
4.1. General...104
4.2. Hydrological Properties of the Pervious Concrete ...105
4.2.2. Porosity ...105
4.2.3. Permeability...111
4.3. Sedimentation...113
4.3.1.1. Sand Sediments...118
4.3.1.2. Clayey Silty Sediments ...125
4.3.1.3. Clayey Silty Sand Sediments...131
4.3.2. Phase II: High and Low Flow with Typical Sediment Load...139
4.3.2.1. Sand Sediments...147
4.3.2.2. Clayey Silty Sediments ...150
4.3.2.3. Clayey Silty Sand Sediments...157
4.3.3. Discussion of the Sedimentation Tests ...163
4.4. Implications of Sedimentation Effects on PCPS...164
4.4.1. Sedimentation Effects of Sand Sediments on PCPS...164
4.4.2. Sedimentation Effects of Clayey Silty Sediments...166
4.4.3. Sedimentation Effects of Clayey Silty Sand Sediments ...168
4.5. Sediment Permeability Tests...170
4.5.1. Overview and Description...170
4.5.2. Procedure for Exfiltration Test...170
4.5.3. Results of the Exfiltration Test...172
Chapter 5. Design Guidelines ...174
5.1. General...174
5.2. Estimates of Sediment Volume...176
5.3. Design Considerations for PCPS Subjected to Sand Sediments...178
5.4. Design Considerations for PCPS Subjected to Clayey Silty Sediments ...179
5.4.2. Changes in Storage Capacity with Sedimentation...184
5.4.3. Maintenance for Clayey Silty Sediments...184
5.5. Design Considerations for PCPS Subjected to Clayey, Silty Sand Sediments...185
5.5.1. Changes in Exfiltration with Sedimentation ...185
5.5.2. Changes in Storage Capacity with Sedimentation...186
5.5.3. Maintenance Procedures ...186
5.6. Examples and Discussion – Hydrological Performance at EOS...187
5.6.1. Soil and Sediment Characteristics ...187
5.6.2. Site Characteristics ...188
5.6.3. Results and Analysis...191
5.6.3.1. Sand Sediment – Effects on hydrological Performance...192
5.6.3.2. Clayey Silty Sediment – Effect on Hydrological Performance...193
5.6.3.3. Clayey Silty Sand Sediment – Effect on Hydrological Performance ...194
5.6.3.4. Effective Default Values: Clayey Silty Sands...196
5.7. Effect of Erosion Control...197
5.8. Effect of Changes in Exfiltration Rate During Service ...198
5.8.1. Effects on Hydrological Performance: Clayey Silt ...200
5.8.2. Effects on Hydrological Performance: Clayey Silty Sand...200
5.9. Conclusions and Recommendations...201
Chapter 6. Frost Durability Results and Discussions ...203
6.1. General...203
6.2.1. Dynamic Elastic (Young’s) Modulus and Mass...204
6.2.2. Air Void Evaluation...215
6.3. Freezing and Thawing Resistance with Sand Sediments ...218
6.4. Conclusions – Frost Resistance...219
6.5. Recommendations ...220
7. Conclusions and Recommendations ...222
7.1. Conclusions...222
7.1.1. Phase I and Phase II Conclusions ...222
7.1.2 Phase III Conclusions ...224
7.2. Recommendations ...226
8. List of References ...228
Appendices ...238
Appendix A. Mechanical Properties...239
Appendix B. Pervious Concrete Apparent Permeability Test (P-CAP Test)...242
List of Tables
Table 2.1. Recommended Infiltration Rates for Preliminary Design of PCPS...11
Table 2.2 Typical Ranges of Materials Proportions in Pervious Concrete...11
Table 2.3. Pervious Concrete Pavement Depths for Type of Traffic...31
Table 2.4. Typical Pollutants Loadings from Runoff by Urban Land Use...34
Table 2.5. USLE K Factor Based on Soil Types...36
Table 2.6. Values of C in USLE for Different Land Covers ...38
Table 2.7. Runoff for Different Exfiltration Rates at the Beginning and End of Service ...60
Table 2.8. Equivalent Curve Numbers for Different Exfiltration Rates at the Beginning and End of Service...60
Table 2.9. Storage recovery for Different Exfiltration Rates at the Beginning and End of Service ...60
Table 3.1. Test Matrix for the Three Phases of the Study ...68
Table 3.2. Pervious Concrete Mixture Proportions...71
Table 4.1. Dry Density, Porosity, and Hydraulic Conductivity Coefficient for Mixture 1 and Mixture 2 Cylinder Specimens ...107
Table 4.2. Dry Density, Porosity, and Hydraulic Conductivity for Mixture 1 and Mixture 2 Beam Specimens ...108
Table 4.12. Flow Rate of Phase II Cylinder Specimens Subjected to Sedimentation with
Clayey Silty Soil and the Layer of Sediment in Exfiltration Test ...173
Table 5.1. Initial Estimates of Infiltration Rate ...188
Table 5.2. Estimates of Pre-Development Runoff for Example Case...190
Table 5.3. Estimates of Post-Development Runoff for Example Case, initial ...191
Table 5.4. Estimates of Post-Development Equivalent CN for Example Case, initial ...191
Table 5.5. Recovery Time After 5 days for Example Case, initial ...191
Table 5.6. Selected Estimate Values of Exfiltration Rate and Depth of Layer Based on Sediment Load ...196
Table 5.7. Initial Estimates of Infiltration Rate ...199
Table 5.8. Estimates of Post-Development Runoff in Example of Section 5.8...199
Table 5.9. Estimates of Post-Development Runoff for Example 5.8...199
Table 6.1. Dry density, Mass, and Dynamic Elastic (Young’s) Modulus of Mixture 1 and Mixture 2 Disk Specimens...205
Table 6.2. Dry Density and Porosity of Mixture 4 and Mixture 5 Disk Specimens ...205
Table 6.3. Initial and Remaining Mass Every 10 Cycles of Disk Specimens Mixture 4 and Mixture 5 ...210
Table 6.4. Initial and Remaining Ed Every 10 Cycles of Disk Specimens Mixture 4 and Mixture 5 ...210
Table A.1. Flexural and Dynamic Elastic (Young’s) Modulus for Beam Specimens ...240
List of Figures
Figure 2.1. Pervious Concrete Pavement System Definition ...9
Figure 2.2. PCPS Exfiltration Mechanism ...10
Figure 2.3. Falling Head Permeameters for Pervious Concrete. ...18
Figure 2.6 Dimensionless Topographic Factor LS for USLE ...37
Figure 2.7. General Developed Commercial Site Using PCPS as the Parking Lot. ...41
Figure 2.8. Recommended Parking Per 1,000 Square Foot of Building Area...41
Figure 2.9. Built Cover in Contemporary Urban Land Uses...42
Figure 2.10. Average Zone Distribution for a General Developed Commercial Site...43
Figure 2.11. Different Cases of Sediment Deposition in Pervious Concrete Pavements Depending on Soil Type ...45
Figure 2.12. Effective Permeability of a PCPS Affected by the Depth and Permeability of a Layer of Sediment ...52
Figure 2.14. Settling and Riding Velocities of Discrete Spherical Particles in Quiescent Water ...57
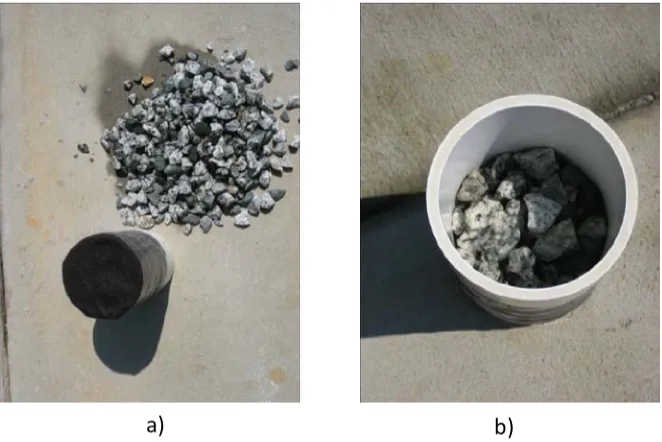
Figure 3.1. Coarse Aggregate Characteristics ...71
Figure 3.2. Fabrication of Cylinder Specimens Using the Proctor Hammer...73
Figure 3.3 Fabrication of Beam Specimens Using Steel Cylinders for Compaction...74
Figure 3.4. Fabrication of Beam Specimens Using Steel Cylinders for Compaction...74
in Phase II...74
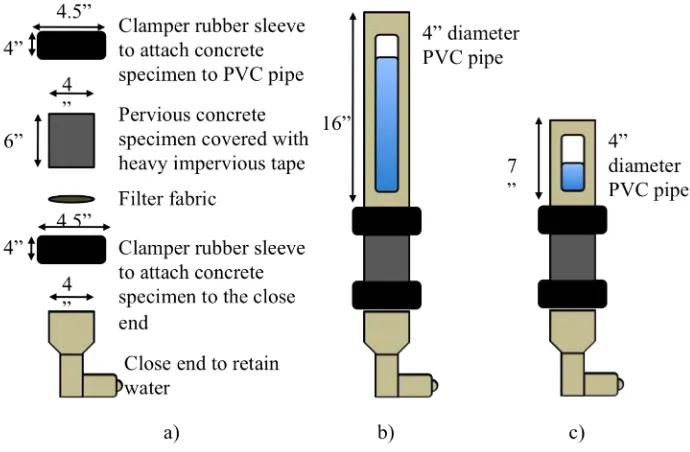
Figure 3.6 Basic Schematics of Permeameters Used in Phase I and Phase II...86
Figure 3.7. Preparation of Cylinder and Beam Specimens for Sedimentation Tests...86
Figure 3.8. Test Setup to Determine Permeability of Cylinder Specimens...87
Figure 3.9. Falling Head Single Ring Test to Determine Water Flow of Beam Specimens ..87
Figure 3.10 Soil Sediment: Clayey Silt, Clayey Silty Sand, and Sand ...91
Figure 3.11. Low Flow Sedimentation Test in Phase I ...94
Figure 3.12. Sedimentation Test in Phase II...97
Figure 3.13. Sediment Hydraulic Conductivity Test Setup...98
Figure 3.14. Test Setup for Frost Durability Test...103
Figure 4.1. Remaining Coefficient of Permeability of Cylinder Specimens Subjected to Sand Sediments in Phase I...119
Figure 4.2. Cylinder Specimen Exposed to Sand Sediments in Phase I ...120
Figure 4.3. Cylinder Specimen After Exposure to Sand ...120
Figure 4.4. Remaining Flow Rate of Beam Specimens Subjected to Sand Sediments in Phase I ...123
Figure 4.5. Beam Specimens After Exposure to Sand ...124
Figure 4.6. Remaining Coefficient of Permeability of Cylinder Specimens Subjected to Clayey Silty Sediments in Phase I...127
Figure 4.7. Cylinder Specimen Exposed to Clayey Silty Sediments in Phase I...128
Figure 4.8. Cylinder Specimen After Exposure to Clayey Silt...128
Figure 4.25. Cylinder Specimens Exposed to Clayey Silty Sand...160
Figure 4.25. Cylinder Specimens After Exposure to Clayey Silty Sand...160
Figure 4.23. Remaining Flow Rate of Beam Specimens Subjected to Clayey Silty Sand Sediments at Different Stages...161
Figure 4.24. Beam Specimen After Exposure to Clayey Silty Sand...162
Figure 4.25. Exfiltrometer Testing Device Setup to Estimated Exfiltration Rate ...171
in PCPS at EOS...171
Figure 5.1. Site Layout Section 5.6.2...189
Figure 6.1. Mixture 1 and 2 Disk Specimens After Eight Freezing and Thawing Cycles ...207
Figure 6.2. Mixture 1 and 2 Disk Specimens After Eight Freezing and Thawing Cycles ...208
Figure 6.3. Mixture 4 and Mixture 5 Disk Specimens After 40 Freezing and Thawing Cycles ...209
Figure 6.4. Mass Loss for Mixture 4 Specimens After Every 10 Cycles...211
Figure 6.5. Mass Loss for Mixture 5 Specimens After Every 10 Cycles...212
Figure 6.6. Dynamic Elastic (Young’s) Modulus Loss for Mixture 4 Specimens After Every 10 Cycles ...213
Figure 6.7. Dynamic Elastic (Young’s) Modulus Loss for Mixture 5 Specimens After Every 10 cycles ...214
Figure 6.8. Microscopic Photograph of Mixture 4 disk (50x)...216
Figure 6.9. Microscopic Photograph of Mixture 5 disk (50x)...217
Figure C.1. USLE Sand Production in tons/ac⋅yr. for Regions with R = 100 (ft⋅
tons⋅in)/(ac⋅hr⋅yr)...250 Figure C.2. USLE Sand Production in tons/ac⋅yr. for Regions with R = 150 (ft⋅ tons⋅in)/(ac⋅hr⋅yr)...251 Figure C.3. USLE Sand Production in tons/ac⋅yr. for Regions with R = 200 (ft⋅
tons⋅in)/(ac⋅hr⋅yr)...252 Figure C.4. USLE Sand Production in tons/ac⋅yr. for Regions with R = 250 (ft⋅
tons⋅in)/(ac⋅hr⋅yr)...253 Figure C.5. USLE Sand Production in tons/ac⋅yr. for Regions with R = 300 (ft⋅
tons⋅in)/(ac⋅hr⋅yr)...254 Figure C.6. USLE Sand Production in tons/ac⋅yr. for Regions with R = 350 (ft⋅ tons⋅in)/(ac⋅hr⋅yr)...255 Figure C.7. USLE Clayey Silt Production in tons/ac⋅yr. for Regions with R = 100 (ft⋅
tons⋅in)/(ac⋅hr⋅yr)...256 Figure C.8. USLE Clayey Silt Production in tons/ac⋅yr. for Regions with R = 150 (ft⋅
tons⋅in)/(ac⋅hr⋅yr)...257 Figure C.9. USLE Clayey Silt Production in tons/ac⋅yr. for Regions with R = 200 (ft⋅
tons⋅in)/(ac⋅hr⋅yr)...258 Figure C.10. USLE Clayey Silt Production in tons/ac⋅yr. for Regions with R = 250 (ft⋅
Figure C.11. USLE Clayey Silt Production in tons/ac⋅yr. for Regions with R = 300 (ft⋅
tons⋅in)/(ac⋅hr⋅yr)...260 Figure C.12. USLE Clayey Silt Production in tons/ac⋅yr. for Regions with R = 350 (ft⋅ tons⋅in)/(ac⋅hr⋅yr)...261 Figure C.13. USLE Clayey Silty Sand Production in tons/ac⋅yr. for Regions with R = 100 (ft⋅ tons⋅in)/(ac⋅hr⋅yr) ...262 Figure C.14. USLE Clayey Silty Sand Production in tons/ac⋅yr. for Regions with R = 150 (ft⋅ tons⋅in)/(ac⋅hr⋅yr) ...263 Figure C.15. USLE Clayey Silty Sand Production in tons/ac⋅yr. for Regions with R = 200
(ft⋅ tons⋅in)/(ac⋅hr⋅yr) ...264 Figure C.17. USLE Clayey Silty Sand Production in tons/ac⋅yr. for Regions with R = 300 (ft⋅ tons⋅in)/(ac⋅hr⋅yr) ...266 Figure C.18. USLE Clayey Silty Sand Production in tons/ac⋅yr. for Regions with R = 350
Chapter 1. Introduction
1.1. Background
Pervious Concrete Pavement Systems (PCPS) have rapidly gained popularity with designers, owners, developers, and permitting agencies. Reasons include amendments to the Clean Water Act (US EPA 1999), which require both mitigation of the quantity of stormwater runoff and maintenance of water quality. Both of these requirements can be achieved by the use of pervious concrete pavements.
The hydrological performance of PCPS is usually the characteristic of most interest to agencies granting permission-to-build permits. Traditional structural Best Management Practices (BMPs) addressed by the Environmental Protection Agency (EPA) and permitting agencies such as the North Carolina Department of Environmental and Natural Resources (NCDENR) include wet detention basins, extended detention wetlands, pocket wetlands, sand filters, bioretention areas, grassed swales, extended dry detention, filter strips and infiltration devices (US EPA 1999, NCDENR 2007). Both EPA and NCDENR consider PCPS to be a structural BMP infiltration system to capture a volume of runoff and infiltrate it into the ground (US EPA 1999, NCDENR 2007).
North Carolina passed new laws that affect sustainable building requirements in 2007. These laws include water use limitations, capture and consumption requirements, and elimination of potable water for irrigation (NC Session Law 2007-546), and limitation of impervious surfaces for developed North Carolina owned or administered sites (NC Session Law 2007-323).
Procedures to establish pavement and base depths appropriate for both load carrying and hydrologic design needs have been established reasonably well at this point (Meininger 1998, Ferguson 2005, Tennis, Leming, and Akers 2004, Leming Malcom and Tennis, 2007). Several concerns exist, however, in four primary areas: (1) blockage of the pores by sediments (sedimentation), resulting in loss of storage, or reduction in permeability or exfiltration, (2) selection of design exfiltration values particularly as they may change in service, (3) frost resistance due to sedimentation, and (4) standards for the fabrication of specimens for testing, although consensus standards are currently in development.
PCPS often exposed to freezing and thawing cycles and must be frost resistant. Current research reports that the addition of 7% sand by weight as replacement for coarse aggregate increases the freeze-thaw resistance (Kevern, Schaefer, Wang and Suleiman, 2008). Most of this research, however, focuses on rapid freezing and thawing tests that does not reflect realistic situations to which a PCPS is subjected in the field, and do not include the effects of sedimentation.
The most critical aspect of sedimentation may be the formation of a layer of fine-entrained material on the bottom of the PCPS. This layer could significantly compromise hydrological behavior of the PCPS by reducing the effective exfiltration rate of the system over time. A significant reduction in the ability to drain captured runoff could result in either additional runoff or excessive recovery time, that is, the time required to return to full capacity, or both. This possibility was noted in PCA EB 303 (Leming, Malcom and Tennis, 2007) but no experimental data or published guidelines exist to provide the Designer-of-Record with a rigorous methodology or appropriate design values.
1.2. Problem Statements
1.3. Objectives
This study is concerned primarily with sedimentation issues, including the related problem of establishing appropriate design exfiltration values for the life of the pavement structure. This study has two primary objectives:
1. Identify and analyze the effects of sediment deposition and segregation, and the effects of sediment transport within the PCPS to develop appropriate design guidelines for storage capacity analysis including the effect of changes in exfiltration rate. This analysis can also be useful in selecting appropriate maintenance strategies. 2. Examine the effects of realistic freezing rates on frost resistance of pervious concrete,
including the effects of sedimentation.
1.4. Methodology
Chapter 2. Literature Review
2.1 Pervious Concrete Pavement systems (PCPS)
Pervious Concrete Pavement Systems (PCPS) have been used in some areas for decades, however, recent interest in sustainable development and recognition of PCPS as a best management practice (BMP) for stormwater management has increased the interest and use in the U.S. as described in Portland Cement Association (PCA) Engineering Bulletin (EB) 303 (Leming, Malcom, and Tennis, 2007). PCPS support sustainable development initiatives such as EPA Heat Island Reduction Initiative (USEPA 2008a) and Low Impact Development (USEPA 2008b) and provides several credits in the LEED (Leadership in Energy and Environmental Design) rating system for sustainable building construction (US Green Building Council 2005).
2.2 System Definition
Pervious concrete is typically described as open-graded material consisting of portland cement, coarse aggregate, little or no fine aggregate, admixtures and water. The combination of these components produce a hardened material with interconnected pores, ranging in size from 0.08 to 0.32 in. (2 to 8 mm), that allow water to pass through easily (ACI 522, 2006).
Figure 2.1. Pervious Concrete Pavement System Definition
Table 2.1. Recommended Infiltration Rates for Preliminary Design of PCPS General Soil Type Infiltration rate, in./h (cm/h)
Sandy soils 0.5 to 1 (1.3 to 2.5)
Silty soils 0.1 (0.3)
Clayey soils 0.01 (0.03)
2.3. Pervious Concrete Materials
Pervious concrete uses the same materials as conventional concrete, with the exceptions that the fine aggregate is nearly or entirely eliminated, and the coarse aggregate is typically more uniform (ACI 522, 2006; Tennis, Leming, and Akers 2004). Mixture proportions for pervious concrete are usually less forgiving than conventional concrete mixtures and tight controls are usually required in order to provide the required characteristics (Tennis, Leming, and Akers 2004). Mixture proportions will vary depending on local concrete materials. Trial batching and experience is required to develop acceptable mixtures, however, typical ranges of materials proportions are shown in Table 2.2.
Table 2.2 Typical Ranges of Materials Proportions in Pervious Concrete
Materials Proportions
Cementitious materials, lb/yd3 (kg/m3) 450 to 700 (270 to 415)
Aggregate 2,000 to 2,500 (1,190 to 1,480)
The aggregate-cement factor, and water cementitious materials ratio (w/c) are the two most important factors in the mixture that affect the mechanical characteristics (ACI 522, 2006). Water to cementitious materials ratios (w/c) between 0.30 and 0.40 have been used successfully in pervious concrete mixtures (ACI 522, 2006; Tennis, Leming, and Akers 2004). Chemical admixtures are usually used to influence workability and setting time of mixtures (Tennis, Leming, and Akers 2004; ACI 522, 2006).
Cementitious Materials
Portland cement conforming with ASTM C 150 is used as the main binder (ACI 522, 2006). Blended cements conforming with ASTM C 595 and C 1157 may also be used in pervious concrete (Tennis, Leming, and Akers 2004). Supplementary cementitious materials such as fly ash, slag cement, and silica fume conforming with ASTM C 618, ASTM C 989, and C 1240 respectively, can also be used. (ACI 522, 2006; Tennis, Leming, and Akers, 2004).
Aggregate
Admixtures
Chemical admixtures are used in pervious concrete for the same reasons as in conventional concrete. Due to the rapid setting time in pervious concrete mixtures, retarders or hydration-stabilizing admixtures are commonly used (Tennis, Leming, and Akers 2004). High range water reducers admixtures or medium range water reducers are commonly used depending on the w/cm (ACI 522, 2006). These admixtures should meet the requirements of ASTM C 494. Air-entraining admixtures in accordance with ASTM C 260 can be used in environments susceptible to freezing and thawing (Tennis, Leming, and Akers 2004).
2.4. Fresh and Hardened Properties of Pervious Concrete
Fresh pervious concrete is typically stiff, with low workability compared to conventional concrete. Slump values are usually less than 3/4 in. (20 mm) [ACI 522, 2006, Tennis, Leming, and Akers 2004]. The slump is rarely a useful or appropriate method to determine mixture consistency. ACI 522 (2008) recommends fresh density as the preferred measurement for quality control or quality assurance purposes.
Due to unique characteristics, current standards in fabricating specimens and testing materials for conventional concrete do not apply for pervious concrete. ASTM standards for the fabrication of pervious concrete specimens, compressive and flexural strength are currently in development. ASTM Committee C09.49, focused on pervious concrete, is currently working on the development on consolidation techniques and also in the evaluation of tests methods to be incorporated into ASTM standards (ASTM 2007).
2.4.1. Density and Porosity
The density and porosity of pervious concrete are a function of the mixture proportions and the consolidation of the mixture. In-place densities of 100 lb/ft2 to 125 lb/ft2 (1,600 kg/m2 to 2,000 kg/m2) are common (Tennis, Leming, and Akers 2004).
Porosity affects compressive and flexural strength, and is the property that controls the storage capacity of pervious concrete. Low porosity is considered to be less than 15% voids, while high porosity estimated to be around 30% voids. A reasonable average value for preliminary structural and hydrological design is 20% (Tennis, Leming, and Akers 2004).
methods of consolidating include roller-compacted concrete in cylinder molds as described in ASTM C 1176 and ASTM C 1435 (Obla, 2008).
ACI specifications for pervious concrete (ACI 522, 2008) call for the use of ASTM C138 following the jigging consolidation procedure described in ASTM C 29 to determine the density of fresh concrete. The density of the concrete, however, is likely to be higher in service.
The effective porosity can be obtained using ASTM C 140, Standard Test Methods for Sampling and Testing Concrete Masonry Units and Related Units, or ASTM D 7063, Standard Test Method for Effective Porosity and Effective Air Voids of Compacted Bituminous Paving Mixture Samples. Using ASTM D 7063. Concrete specimens are dried to a constant mass at a temperature that does not exceed 40 °C (104 °F). The specimens are then placed into a plastic bag, the air is evacuated from the sample and the bag sealed. The mass of the sample and bag submerged in water is determined. The plastic bag is then cut, allowing the water to saturate the sample, and the mass of the saturated sample is determined. The effective porosity is then calculated as described in ASTM D 7063.
!
Vr= 1"W2"W1 #wVol $
% &
' (
) *100 (2.1)
where
Vr = total void ratio, %,
W1= weight immersed (lbs or kg), W2= dry weight (lbs or kg),
Vol = nominal sample volume based on dimensions of the sample (ft3 or m3), and
ρW= density of water (lbs/ft3 or kg/m3).
ASTM D 7063 uses the difference of the density of the specimen, obtained by a water displaced method, with an apparent maximum density obtained by the saturated weight of the specimen to determine the fraction of total number of voids that are accessible to water. This effective porosity can be used as storage capacity in the PCPS and can be considered as the preferred method to evaluate the hydrological performance of the system.
2.4.2. Permeability
Bidelspach (2007a) reported field permeability rates of pervious concrete pavements from 240 in./hr (600 cm/hr) to 2,760 in./hr (7,000 cm/hr).
Permeability of pervious concrete can be measured in the laboratory by several means. A falling head permeameter is commonly used for convenience. The cylindrical sample is prepared such that no water flows along the side of the specimens and water flows from top to bottom of the specimen. Water is added to the graduated cylinder to fill the specimen and the drain pipe, up to the initial head level, with the valve closed. The valve is then opened and the time required for water to fall from an initial head to a final head is measured (Figure 2.3) [Neithalath, Weiss and Olek, 2003; Kevern, Schaefer, Wang and Suleiman, 2008]. The average coefficient of permeability (k) is determined using equation 2.2, based on Darcy’s law principle of flow in homogeneous porous material.
!
k=aL Atln h1 h2 " # $ % & ' (2.2) where
k = coefficient of permeability, in./s or cm/s, a = cross-sectional area of the pipe, in2 or cm2, L = Length of sample, in. or cm,
A = cross-sectional area of the sample, in2 or cm2, t = time for water to drop from h1 to h2, s,
a) b)
Figure 2.3. Falling Head Permeameters for Pervious Concrete.
2.4.3. Frost Durability
Frost durability of concrete is typically evaluated using two standard methods, which assess durability for two different phenomena, rapid freezing and thawing resistance to deicer salt scaling. ASTM C 666 involves rapid freezing and thawing cycles in the presence of water. Frost durability determined using ASTM C 666 Resistance of Concrete to Rapid Freezing and Thawing primarily measures the effectiveness of the air void system for concrete with frost durability aggregate. ASTM C 666 may not be the recommended method to evaluate resistance to freezing and thawing since it does not reflect the performance of the pavement in the field. The deicer salt test described in ASTM C 672 may be better suited for evaluation of durability of concrete in paving applications because it involves slower, more realistic freezing cycles in the presence of a deicing salt solution and attempts to more realistically simulate frost exposure conditions in a pavement (Dilek and Leming, 2007).
deterioration of aggregate, as well as paste deterioration. They also reported that deterioration of the paste appeared to depend on the aggregate type and size.
Korhonen and Bayer (1989) reported that samples of pervious concrete without air entrainement showed some resistance to freezing and thawing in a damp condition but not in a ponded condition. Pervious concrete beams with dimensions of 3 in. by 3 in. by 15 in. (76 mm by 76 mm by 381 mm) and cylinders with dimensions of 4 in. by 8 in. (102 mm by 203 mm) subjected to freezing in air and thawing in air, or freezing in air and thawing in water, or freezing in water and thawing sustained over 160 freeze-thaw cycles when damp or in air, but failed within 45 freeze-thaw cycles when submerged in water.
Schaefer, Wang, Suleiman and Kevern (2006) reported that pervious concrete mixtures containing sand showed better freezing and thawing resistance that those without sand. Tests were performed in accordance with ASTM C 666. The same study showed that a mixture containing sand and an air entraining admixture suffered only 2% mass loss after 300 freeze-thaw cycles.
Kevern, Schaefer, Wang and Suleiman (2008) reported that the addition of 7% sand by weight as replacement for coarse aggregate increases the freeze-thaw resistance of pervious concrete tested in accordance with ASTM C 666. Mixtures with sand and air entraining admixture were also found to have better freeze-thaw resistance than those with sand only. The addition of class C fly ash to mixtures with sand, however, decreased freeze-thaw durability (Kevern, Wang and Schaefer 2008).
2.4.4. Flexural Strength and Dynamic Modulus of Elasticity
Flexural strength and dynamic modulus of elasticity are important for the structural behavior of pavements. Flexural strength of pervious concrete generally ranges between 150 psi (1.0 MPa) and 550 psi (3.8 MPa) [Tennis, Leming, and Akers 2004]. Flexural strength is influenced by many factors, especially the degree of compaction and porosity. A relationship between compressive strength and flexural strength can be established (ACI 522, 2006), however the lack of standards in specimen fabrication and testing limit wide acceptance. Flexural strength in pervious concrete can be determined in accordance with ASTM C 78. Dynamic modulus of elasticity can be measured non-destructible using beam specimens as described in ASTM C 215. Beam specimens used for both tests permit compaction comparable to the compaction applied in the field.
2.4.4. Compressive Strength
Compressive strength is typically used for quality control purposes simply for convenience, however, it has little practical use. Compressive strength will most likely be determined using specimens compacted with a standard Proctor hammer (Obla, 2008). Review of methodologies are under way by ASTM in order to determine the specimen size and specimen preparation for testing, including capping requirements.
2.5 Construction and Consolidation Effects of PCPS
As with conventional pavement, a uniform subgrade at the correct elevation is essential in the construction of the PCPS. The subgrade should be moistened before placing the concrete in order to prevent water from being removed from the lower part of the concrete too soon (Tennis, Leming, and Akers 2004). For consistent subgrade support, it is recommended that a minimum compaction of 90% to 95% of theoretical density be attained in accordance with AASHTO T 180. Increasing the subgrade density decreases the permeability of the soil (Tennis, Leming, and Akers 2004), however, and some concern has been expressed about compaction needs in areas with light traffic (Ferguson, 2005).
compacting the concrete to the height of the forms after removing the wood spacing strip (Tennis, Leming, and Akers 2004). The compaction of the concrete is recommended to be performed with enough weight to provide a minimum of 10 psi vertical stress. Other consolidation methods include either slip forms or a revolving steel cylinder that combines strike-off and compaction.
2.6 Compaction Gradients in Pervious Concrete
The pervious concrete in the system is denser on the surface due to compaction techniques used to place the concrete. Haselbach and Freeman (2006) report that porosity increased significantly from top to bottom in pervious concrete slabs 6 in. (15 cm) in height and placed with a surface compaction provided by a static roller after removal of the spacer strip.
20, and 25 cm), respectively. This pressure gradient is generally consistent with the density gradient reported by Haselbach and Freeman (2006). This implies that since pervious concrete will have a much denser surface larger sediment particles will tend to be trapped in the surface or near surface region of a PCPS. This in turn implies that surface washing and vacuum sweeping may significantly reduce clogging of PCPS, which is consistent with the findings reported by Haselbach and Valavala (2006).
2.7 Hydrological Design of the PCPS
The most important characteristic of the PCPS is the capacity to capture and store all or some significant part of anticipated runoff in a given design storm. A PCPS can be designed as a “passive” or an “active” mitigation system. Passive mitigation is used only to reduce the quantity impervious surfaces by replacing it with pervious surfaces. Active mitigation is designed to capture not only the rain falling directly on the pavement, but also part, or all, of the stormwater runoff originated from adjacent zones (EB 3030 [Leming, Malcom and Tennis, 2007]). Active mitigation systems may be more susceptible to sedimentation due to the stormwater runoff from adjacent vegetated or bare areas.
Two critical factors in the hydrological design of PCPS are the amount of runoff anticipated from the site and the infiltration rate of the soil. These two characteristics are related since runoff will depend in part on the type of soil. Areas with clayey soils will tend to produce more runoff due to low infiltration; sandy soils will likely produce less runoff because of relatively high infiltration and less soil erodibility (Wurbs and James, 2000; ASCE, 2006). Recommended infiltration rates from EB 303 (Leming, Malcom and Tennis 2007) for preliminary design are shown in Table 2.1.
underlying soil. The exfiltration rate of captured runoff from the PCPS into the underlying soil is controlled by the soil infiltration (EB 303 [Leming, Malcom and Tennis 2007]).
Storage capacity in the PCPS is determined by the depths and effective porosities of the pervious concrete and the aggregate base. Pervious concrete typically has a porosity from 15% to 30%, and an aggregate base produced from a # 57 or # 67 stone usually has a design porosity of 40% (EB 303 [Leming, Malcom and Tennis 2007]). Runoff stored in the system will drain through the underlying soil to restore some part of the capacity during the storm, and to remove the water captured by the system once the storm has passed (EB 303 [Leming, Malcom and Tennis 2007]).
2.7.1. The NRCS Curve Number Method
The Curve Number method includes the use of coefficients (the “Curve Numbers”) to estimate runoff based on types of soil and cover conditions. Adjustments to coefficients, based on the amount of impervious surface and how much of that impervious area is connected, are also possible. This method utilizes a 24-h design storm. This design approach considers the significant effects of infiltration and long term storage capacity of the PCPS, and it also incorporates the effects of both impervious surfaces and other surfaces (EB 303 [Leming, Malcom and Tennis 2007]) on PCPS behavior.
In general, the Curve Number method consists of mathematically applying the hourly distribution of rainfall for the design storm to the various surfaces of the site that discharge onto the pervious concrete pavement system. For an active mitigation system, this can include impervious surfaces such as building footprint, paved islands, and bus or truck lanes, and surfaces with natural cover such as planted traffic islands, vegetated areas on site, and adjacent properties that drain naturally onto the site under design. For a passive mitigation system, this would typically include only the surface of the pervious concrete pavement, but may also include border features associated with the pavements, such as curbs or impervious decorative borders (EB 303 [Leming, Malcom and Tennis 2007])
Overland flow occurs very rapidly for small sites, so no adjustment is made for travel times for contiguous areas. This is both computationally convenient and conservative. This process continues until the rainfall of all of the 24 hourly increments has been applied or until the storage capacity of the system has been exceeded, in which case the remaining rainfall is considered to be excess surface runoff (EB 303 [Leming, Malcom and Tennis 2007])
Infiltration maintains some fraction of the effective storage capacity of the pervious concrete pavement system by removing some of the captured runoff over time. The effect of infiltration on storage capacity, and therefore excess surface runoff, is a critical element in the analysis. Infiltration continues until the pervious concrete system is emptied and the storage capacity returned to its original value. The total recovery or drawdown time, the time until 100% of the storage capacity has been recovered, is also an important performance factor and should not exceed 5 days (EB 303 [Leming, Malcom and Tennis 2007])
2.8 Structural Design of PCPS
Table 2.3. Pervious Concrete Pavement Depths for Type of Traffic Depth of pavement, in. (cm) Traffic
4 (10) Cars and light trucks
6 (15) No heavy trucks, residential driveways 8 (20) Acceptable for low truck volumes
2.9 Sedimentation Effects of PCPS
The storage capacity of a pervious concrete or aggregate base is the effective porosity, that is the available void content per unit volume, times the volume of the pervious concrete or aggregate base (EB 303 [Leming, Malcom and Tennis 2007]). Significant changes in porosity of either the pervious concrete or the aggregate base can affect the hydrological behavior of PCPS in three ways: (1) clogging can reduce storage capacity, (2) clogging can reduce surface permeability of the system and (3) clogging can affect the infiltration rate into the subgrade, that is, exfiltration from the PCPS to the underlying soil.
Leming, Malcom and Tennis (EB 303, 2007) report that fine grained sediments deposited in the pavement will most likely occupy less than 1/2 in. (12 mm) of the depth of the aggregate base in 20 years of service, resulting in only a few percent loss in storage capacity assuming typical but conservative deposition rates, but the analysis was based on simple assumptions not confirmed with experimental data. An extra inch (25 mm) of aggregate base is most likely more than adequate to supply sufficient storage capacity for those cases in which sedimentation of fine grained particles are estimated to be high (EB 303 [Leming, Malcom and Tennis 2007]); the marginal cost of the 1 in. (25 mm) of base is minimal. For sites with depositions estimated to be 1,000 lbs/ac/yr (1,125 kg/ha/yr) or higher, and additional inch (25 mm) of aggregate base was suggested as a standard design feature.
accumulation at the base of the PCPS could reduce the exfiltration of the system if the layer of sediment is fundamentally different from the underlying soil.
2.9.1. Volume of Sediments
2.9.1.1. General Estimation of Sediment Production
The specific effects of sedimentation on the PCPS will depend on the volume of sediment. Precise estimation of the quantity of sediment is very difficult, if not impossible, due to the numerous factors involved in the process such as climate, soil properties, soil surface conditions, topography, and human activities (ASCE, 2006; Wurbs and James, 2001). Modeling erosion and sedimentation processes is highly approximate and necessary empirical, being based mainly on field observation rather than on theoretical considerations (Wurbs and James, 2001).
Table 2.4. Typical Pollutants Loadings from Runoff by Urban Land Use.
Land Use Total Suspended Solids (TSS), lbs/acre-yr (Kg/ha-yr)
Commercial 1,000 (1,125)
Parking Lot 400 (450)
High Density Residential 420 (473) Medium Density Residential 190 (214)
Low Density Residential 10 (11)
Industrial 860 (968)
Construction 6,000 (6,750)
2.9.1.2. Universal Soil Loss Equation (USLE)
The Universal Soil Loss Equation (USLE) is a commonly used technique that provides a more site specific estimate of erosion and sedimentation quantities. The USLE is used to predict the most likely average annual soil loss in specific situations, and has been used for more than 40 years, although mostly for agricultural practices (Renard, Foster, Weesies, McCool, and Yoder, 1997; Wurbs and James, 2001). Advantages of the USLE includes:
1. The use of a single number to represent each factor;
2. Estimation is based on hydrological, soil, or erosion research data for each location, and
3. It is free from any geographically oriented base.
The USLE is given as:
E =A R K L S C P (2.3)
where
E = annual soil loss in tons/yr, A = area in acres
R = rainfall-runoff erosivity in (ft·tons·in.)/(ac·hr·yr), K = soil erodibility in tons/ac,
L = flow length (dimensionless when used as LS factor), S = slope (dimensionless when used as LS factor), C = surface cover (dimensionless), and
P = erosion control practice (dimensionless).
The value of R reflects the climate factor in the USLE and will depend on the selected region. General values for the rainfall and runoff erosivity index R for the continental U.S. in (ft⋅tons⋅in)/(ac⋅hr⋅yr) are provided in Figure 2.5 (Wurbs and James, 2001).
Figure 2.5 The Rainfall and Runoff Erosivity Index R in Hundreds of (ft⋅tons⋅in)/(ac⋅hr⋅yr)
Table 2.5. USLE K Factor Based on Soil Types
Soil Soil erodibility (k)
Sand and gravel 0.1
Loamy coarse sand, sand and fine sand 0.15
Loamy find sand and loamy sand 0.17
Fine sandy loam and sandy loam 0.22
Loam, clay loam and sandy clay loam 0.3
Silt-loam and silty clay loam 0.34
subsoil 0.43
Clay and silty clay
<50% clay 0.32
The topography effect is incorporated in the USLE by the flow length and slope factors, usually represented as a dimensionless topographic factor LS (Figure 2.6). The slope length L is measured from the point where surface flow originates to the downslope point where the deposition begins.
Land cover factor C is a dimensionless ratio of soil loss from a given combination of vegetative cover and management practices to the soil loss resulting from tilled, continuously fallow earth. Values of C for different land covers are shown in Table 2.6.
Table 2.6. Values of C in USLE for Different Land Covers
Land Cover C
Continuous fallow 1
Undisturbed forest land
100-75% canopy cover, 100-90% duff cover 0.0001-0.001 70-45% canopy cover, 85-75% duff cover 0.002-0.004 35-20% canopy cover, 70-40% duff cover 0.003-0.009
Permanent pasture and brush cover
0% canopy, 80% ground cover
Grass 0.013
Weeds 0.043
50% brush, 80% grass cover 0.012
Bare soil
Undisturbed except sraped 0.66-1.30
Compacted, smooth 1.00-1.40
Compacted, root racked 0.90-1.20
Disk tillage, fresh 1
Disk tillage, after one rain 0.89
Straw mulch, 0.5 tons/acre 0.3
Straw mulch, 1.0 tons/acre 0.18
Straw mulch, 2.0 tons/acre 0.09
The erosion control practice factor P is the dimensionless ratio of soil loss under a certain erosion control practice such as contouring and terracing. Specific values for most of the USLE factors can be found in the U.S. Department of Agriculture (USDA) Handbook 703 (Renard, Foster, Weesies, McCool, and Yoder, 1997; Wurbs and James, 2001).
2.9.1.3. Sediment for Urban Land Use
The sedimentation effects of PCPS will depend partially on the volume of sediments, especially those produced in the adjacent areas that will drain into the system. For a developed site, the sediment yield will depend on the area of the vegetated zones, which produce the sediments that will be deposited on the pavement as shown in Figure 2.7.
The relation between the vegetated zone areas with the PCPS area can be defined in Equation 2.4.
!
AVZ APCPS
=RVP (2.4)
where
AVZ = Area of continuous vegetated zones draining onto PCPS, APCPS = Area of PCPS, and
RVP = ratio of vegetated area to PCPS area, all in consistent units.
With Equation 2.4, Equation 2.3 can also be written in function of the PCPS area as
or
E =RVP APCPS A (2.6)
where
E = annual soil loss in tons/yr,
RVP = ratio of vegetated area to PCPS area APCPS = area of PCPS in acres, and
A = average annual soil loss per unit of area in tons/ac/yr.
Parking lots are usually the main application of PCPS (Tennis, Leming, and Akers 2004), therefore parking lots for commercial sites can be used to estimate the production and deposition and the effect they would have when deposited in a PCPS.
Figure 2.7. General Developed Commercial Site Using PCPS as the Parking Lot.
Based on data from Arnold and Gibbons (1996), Cappiella and Brown (2001), and Wells (1994), Ferguson (2005) determined the average percent of land area covered with roofs and pavements based on the land use in urban developments (Figure 2.9). The pavement areas were classified as streets, sidewalks or parking areas. Using estimates from PCA (2002) and Ferguson (2005) industrial, commercial, or shopping center sites will average about 25% impervious zones, such as roofs and sidewalks, 60% pavements, including streets and parking, and 15% vegetated zones, which are usually responsible of producing the soil sediments coming from erosion (Figure 2.10). These average percentages can be used with Equation 2.6 to estimate the production of sediments for a general site with a PCPS using a value of 0.25 for RVP.
Figure 2.10. Average Zone Distribution for a General Developed Commercial Site.
2.9.2. Hypotheses on the Effects of Different Type of Sediments
2.9.2.1. Sand Sediments
Sandy sediments or at least the coarser particles, are likely to be deposited for the most part on the surface and in the top inch or so of the pervious concrete, not going completely through the PCPS to be deposited at the bottom (Figure 2.11-a).
2.9.2.2. Fine Grained Sediments
If the PCPS is placed over a silty soil, fine grained sediments transported by the stormwater
are small enough to be washed to the bottom of the PCPS, and retained on the filter fabric of
the pavement system (Figure 2.11-b) typically placed under the stone base to prevent
intrusion of fine grained subgrade material into the base.
Exfiltration of stored runoff from a PCPS will not likely be significantly changed for a
system over a silt subgrade. The potential layer of silt sediments that may deposited at the
bottom of the PCPS between the stone sub base and the filter fabric would not be as
compacted as the underlying soil. The permeability of the sediment layer, therefore, will
probably be significantly higher than that of the compacted silt subgrade and the infiltration
rate of the compacted subgrade, that is, the underlying soil, will still control system behavior
as in the original design of the PCPS. Loss of storage capacity must still be checked,
however. In order to evaluate the likely effects of such a layer, the depth and the permeability
of the deposit must be estimated. The depth may be estimated based on volume of deposits
and likely density. This value is also useful in estimating the storage capacity loss.
The permeability of fine grain soils is functionally related to the void ratio, which is also a
function of density as compacted. A practical relationship for estimating the permeability for
clayey-silty soils is obtained from the relationship between infiltration rates of the same
!
log k=log ko"#o"#
Ck
(2.7)
where:
k = permeability at a void ratio ε,
k0 = in situ permeability at a void ratio εo, and
Ck = conductivity change index.
Since
!
Ck "0.5#o for fine grained soils (Braja, 2007);
!
logk=logko"
2#o #o +2# #o (2.8) !
logk=logko"2+2 #
#o $ % & ' (
) (2.9)
If the void ratio of clayey silt sediments is estimated to be at least 10% higher than the
underlying soil
!
" "o
= "sed "insitu
#1.1
1 (2.10)
and,
!
logk=logko"2+2
1.1 1 # $ % &
'
( (2.11)
or
!
logk"logko+0.2 (2.12)
or
k ko
=100.2 =1.68 (2.13)
bottom of the PCPS should not affect exfiltration with silty subgrade.
2.9.2.3. Combined Sediments
A combination of these two phenomena may occur in a pavement placed over a silty sandy
soil. Sediments would be “filtered” with the coarser sand fraction deposited on top or in the
surface of the pavement while the silt fraction would accumulate at the bottom of the PCPS
(Figure 2.11-c). A significant difference in design exfiltration values may occur in service in
a PCPS placed over a clayey sand, a silty sand or a clayey silty sand, and will be exposed to
runoff carrying both clay or silt or both, and sand. The infiltration of a silty sand is moderate,
often about 0.5 in./hr (1.3 cm/hr) [Leming, Malcom, and Tennis, 2007]. The coarser particles
of sediment may become trapped in the near surface region of the pervious concrete and the
fine grained silty material can be deposited on the filter fabric, forming a layer of
unconsolidated but very fine grained material between the PCPS and the moderately draining
silty sand. The presence of a silt layer, even if un-compacted, over the filter fabric at the
bottom of the PCPS may result in substantially lower exfiltration rates from the PCPS
(Figure 2.11-c). The presence of even relatively small amount of clay could clearly affect
exfiltration significantly. Precise effects are not known at this time, however, another of the
primary objectives of this study was to evaluate the effects experimentally and provide
2.9.3. Layers and Multiple Soil Horizons
The effective permeability of two or more layers of soil can be estimated when the
permeability and the depth for each layer is known. Permeability in horizontal and vertical
directions is calculated using Equations 2.14 and 2.15 (Cervica, 1995). Both equations
assume flow to a normal, cross section and a constant hydrostatic head for each layer, which
are reasonable conditions for a PCPS.
!
kxe =
kxH
(
)
"
nHn
"
(2.14)!
kye =
H
( )
"
nH ky
(
)n
"
(2.15)where
kxe = equivalent infiltration in the horizontal direction,
kye = equivalent infiltration in the vertical direction,
kx = horizontal infiltration,
ky = vertical infiltration,
H = depth of the nth layer, and
n = number of layers.
In order to evaluate the effect this layer of sediments can produce in the hydraulic
performance of the system, a family of curves was plotted using Equation 2.15 with different
effective permeability of the system, and therefore, the exfiltration rate, will be affected by
the permeability and he depth of this new layer of sediments.
The hydrological behavior of the PCPS must be evaluated at the end of service using a
different value of exfiltration to estimate total runoff, peak runoff and recovery time. It is
important to develop a method for estimating the exfiltration rate of the system including a
layer of fines deposited at the bottom of the system. This need was examined in this study
and is addressed in Chapters 3, 4, and 5, and reviewed theoretically in Section 2.9.4.
The effective exfiltration of the subgrade can be estimated using Equation 2.15 when a
relatively shallow fill with a higher infiltration rate than the existing material is used in the
system. This approach could also be used to determine needed soil characteristics in fill
sections or when investigating potential improvement options in a marginal site.
2.9.4. Sediment Deposition Pattern
The presence of silt or clay sediments may also affect exfiltration depending upon the
deposition patters at the bottom of the PCPS. These fine grained soil sediments may have one
of at least two different patterns of deposition: (1) sediments may be located close to the
point of runoff entering the system, or (2) more or less uniformly distributed as a layer
deposited between the stone sub-base and the filter fabric (Figure 2.13). The first case will
most likely result in the localized loss of some area of exfiltration, while the second case
particles will be washed horizontally through the system or be deposited close to the point of
entry of the stormwater runoff to the PCPS has not been established. Analysis of particle
size, settling velocities and typical stormwater runoff velocities in the PCPS indicates
2.9.4.1 Settling Velocities of Discrete Particles
A discrete particle is defined as one that, in settling, is not altered in size, shape, or weight. In
falling freely through a quiescent fluid, such a particle accelerates until the frictional
resistance, or drag, of the fluid equals the weight of the particle in the suspending fluid (Fair,
Geyer, and Okum 1971). Therefore, the particle will settle at a uniform, or terminal velocity
according to
!
FI =
(
"s#")
gV (2.16)where
FI = impelling force,
g = gravity constant,
V = volume of the particle,
ρs = density of the particle, and
ρ = density of the fluid, all in consistent units.
The drag force FD of the fluid is a function of the dynamic viscosity µ and mass viscosity ρ of
the fluid, and the velocity vs, and a characteristic diameter d of the particle (Fair, Geyer, and
Okum 1971). The relationship for the frictional drag can be expressed as:
!
FD=
CDAc"vs2
2 (2.17)
where,
CD = Newton’s drag coefficient,
ρ = density of the fluid, and
vs = velocity of the particle, all in consistent units.
Equations 2.16 and 2.17 can be combined to establish a general relationship for the settling
of free and discrete spherical particles as follows (Fair, Geyer, and Okum 1971):
!
vs" 4
3
g CD
ss#1
(
)
d$ % & ' ( ) 1/ 2 (2.18) where
vs = velocity of the particle,
g = gravity constant,
CD = Newton’s drag coefficient,
ss = specific gravity of the particle, and
d = diameter of the particle.
For viscous resistance at low Reynolds numbers (R < 0.5), CD = 24/R, and Equation 2.18 is
known as Stoke’s law (Fair, Geyer, and Okum 1971):
!
vs " g 18
ss#1
(
)
v d
2 (2.19)
Where,
vs = velocity of the particle,
g = gravity constant,
d = diameter of the particle, and
ν = kinematic viscosity, all in consistent units.
Figure 2.14 shows curves of settling velocities of discrete spherical particles that span the
region between the Stokes range and the turbulent range (Fair, Geyer, and Okum 1971).
Settling velocities of coarse particles such as medium to fine sand, with an average a
diameter of 0.04 in. (0.1 cm) are in the range of 91,000 in./hr (231,000 cm/hr), settling
almost immediately.
For finer particles passing the #200 sieve size (75 µm), settling velocities will be lower than
9.0 in./hr (23 cm/hr). Water through pervious concrete has been reported to flow at speed
ranging from 290 in./hr (740 cm/hr) to 770 in./hr (1,960 cm/hr) [Tennis, Leming, and Akers,
2004], and from 240 in./hr (600 cm/hr) to 2,760 in./hr (7,000 cm/hr) [Bean, Hunt and
Bidelspach, 2007a]. Since the flow of the water in the pervious concrete is higher than the
settling velocities, it will be very likely that these finer particles will not settle until the flow
through the pervious concrete stops. If all flow is vertical, a more or less uniformly
distributed layer of sediments will be deposited at the bottom of the pervious concrete or
between the stone sub-base and the filter fabric if used.
If flow is horizontal, sediments will be deposited where horizontal flow stops, typically at a
boundary or possibly at an internal check dam such as those used in some PCPS in sloped
considered in sloping PCPS with internal check dams. EB 303 (Leming, Malcom and Tennis,
2007) show an example of this type of construction, which is apparently rarely used.
Figure 2.14. Settling and Riding Velocities of Discrete Spherical Particles in Quiescent
Most flows will be vertical but if sediment is carried from off-site onto the PCPS, it is not
clear how the sediment may be distributed. This study examined both vertical and horizontal
flow characteristics of sediment through pervious concrete.
2.9.5. Sensitivity Analysis
In order to determine the impact that a layer of fine grained sediments deposited uniformly at
the bottom of a system would have on the performance of the PCPS placed in a clayey silty
sand, a scenario of a single developed site with a PCPS was analyzed.
The proposed development consists of 300,000 ft2 (27,870 m2) of a PCPS parking lot, onto
which the runoff of 125,000 ft2 (11,600 m2) of impervious roof and impervious pavement
structures drain. Vegetated islands, side slopes occupying 75,000 ft2 (6,970 m2) will also
drain into the pervious concrete pavement system. The islands and slopes will be landscaped
with grass and some bushes.
A pavement depth of 6 in. (150 mm) will be used in this example. The design porosity of the
pervious concrete in the example is 20% and the PCPS is assumed to be level. The effects of
base course are examined by using 4 in. (100 mm) of clean stone. A compacted aggregate
base consisting of size #57 or #67 stone has a design porosity of 40%. The levels of
precipitation used in this analysis are relatively conservative for temperate areas away from a