ABSTRACT
KOC, HICRAN. Sensory Texture of Model Foods Based on Oral Processing and Food Material Properties Considerations. (Under the direction of Dr. E. Allen Foegeding.)
Food structure design, for specific textural properties, can only be achieved by understanding how food structure is transformed into the cognitive representation of food texture by oral processing. Different structural properties in biopolymer gels can be obtained by changing polymer concentration, solution conditions (i.e., pH, salt), and process
conditions (time, temperature, shear). Another way to alter structure is by forming
multicomponent gels. To understand transformation of food structure in texture perception by oral processing, polysaccharide based soft solid gels were used as model foods. The response of human senses to food structure was investigated via assessments of material properties (rheological/fracture characteristics), sensory perception and oral processing. Initially, fundamental mechanical properties (fracture stress and fracture strain) of agar and κ-carrageenan-locust bean gum gels varied by changing polymer concentrations. When model foods became stronger and more deformable, more chewing cycles and
relatively greater muscle activity were required to prepare samples for swallowing. Chewing frequency remained the same, indicating a consistent rhythmic jaw movement. Model foods showed differences in sensory perception of hardness, deformability, size of breakdown particles, rate of breakdown, particle mouthcoating and number of chews. Hardness, fracture stress, stress intensity factor, and muscle activities are closely associated and are the best indicators of number of chews. Moreover, fracture strain, fracture surface energy,
material properties and oral processing were established by model foods with well defined physical properties.
In the next phase of study, emulsion filled gels were used as model foods to
understand textural changes in foods by fat reduction. Agar gels had a brittle fracture pattern while κ-carrageenan-locust bean gum gels displayed elasto-plastic (ductile) fracture based on fracture mechanics considerations. Agar gels and κ-carrageenan-locust bean gum gels, at similar strengths but different deformability, were filled with various phase volumes of corn oil. Corn oil droplets (approximately 1 µm) were stabilized by surfactants that had no charge (Tween 20), negative (β-lactoglobulin) or positive (lactoferrin) charge at neutral pH.
Increasing the phase volume of oil droplets decreased fracture stress and stress intensity factor of both filled gels, while the main effect on fracture strain was observed for the highly deformable κ-carrageenan gels. The key factor determining physical properties of filled gels were filler-network interactions and relative mechanical properties of filler droplets
compared to the gel network. Oil droplets stabilized with β-lactoglobulin reduced sensory springiness, increased adhesiveness and cohesiveness of agar gels but not κ -carrageenan-locust bean gum gels. Increased adhesiveness and cohesiveness coincided with a greater degree of coalescence of oil droplets during compression. Sensory hardness of both networks was significantly reduced by oil droplets, while deformability decreased only for the κ-carrageenan-locust bean gum gels. The number of chews and muscle activities were mastication parameters affected by textural changes caused by oil droplets, while jaw movements mainly reflected the type of gel. Sensory adhesiveness and particle
polysaccharide gels and that this may be related to the fracture pattern of the networks and combined effect of mechanical properties.
Sensory Texture of Model Foods Based on Oral Processing and Food Material Properties Considerations
by Hicran Koc
A dissertation submitted to the Graduate Faculty of North Carolina State University
in partial fulfillment of the requirements for the degree of
Doctor of Philosophy
Food Science
Raleigh, North Carolina 2012
APPROVED BY:
_______________________________ ______________________________ Dr. E.Allen Foegeding Dr. Chris R. Daubert
Committee Chair
______________________________ ______________________________ Dr. MaryAnne Drake Dr. Saad Khan
ii DEDICATION
Dedicated to the most beautiful people in my life; My parents- Orhan and Nekariye Koc
My siblings- Imran, Gokhan, and Kubra Koc
And dedicated to the memories of our science teacher in the middle school; Fikret Caglar
In Turkish:
Doktora tezim, haklarını asla ödeyemeyeceğim, her şeyden çok sevdiğim, canım annem ve babam, Nekariye ve Orhan Koç’a ve canım kardeşlerim İmran’a, Gökhan’a ve Kübra’ya adanmıştır. Aynı zamanda, hayata çok erken veda eden ortaokul fen bilgisi öğretmenim sevgili Fikret Çağlar’ın anısına adanmıştır.
iii BIOGRAPHY
Hicran was born in Eregli-Konya, Turkey in August 1st, 1981. She was raised in Istanbul where she has been in love with and where her family and friends live. She received her B.S. degree in Food Engineering from Istanbul Technical University (2004) and M.S. degree in Grain Science & Industry from Kansas State University (2007). She has used near-infrared chemical imaging and mid-infrared microspectroscopy techniques to study wheat
germination in Microbeam Molecular Spectroscopy Laboratory at K-State. In 2008, she moved from Little Apple (Manhattan, KS) to Raleigh and started her Ph.D. in the Department of Food, Bioprocessing and Nutrition Sciences at North Carolina State
University. Her current research focuses on food materials science approach to understand sensory texture perception of foods by examining food structure, mechanical properties and oral processing.
iv ACKNOWLEDGEMENTS
I would like to thank to my advisor Dr. Allen Foegeding for his invaluable support and guidance, his patience and time throughout my progress in graduate school. I gratefully appreciate all the opportunities he provided me. It has been a great pleasure working with him, thank you Dr. Foegeding for everything!
I greatly appreciate contributions of Dr. MaryAnne Drake, Dr. Christopher Daubert, Dr. Saad Khan, Dr. Chris Vinyard and Dr. Gregory Essick for serving in my committee, and their help, motivation and support. None of this work would be possible without them! I convey my thanks to Dr. K.P. Sandeep, Dr. Tyre Lanier, and Dr. Jack Davis for their support, helping me to improve myself and their friendliness. Thanks to Sharon Ramsey, Chris Pernell and Helen Melito for their assistance in rheology lab, to Eva Johannes for her help in confocal microscopy and Michelle Yates for the assistance in sensory panels. Also I am so thankful to Wenjie Liu, JoAnna Foegeding, Karl Hedrick and Bernard Eckhardt for their unlimited support and being always so nice and friendly. Thanks to all other friends in NCSU Food Science family and to the mastication study panelists.
v I would like to thank to my dear roommate/sister Funda Ogut for everything! We have shared all good and bad moments of our lives and supported each other for all those years. Many thanks to Nin for her great friendship, support, care and love; I always
appreciate her generosity, sincerity and thoughtfulness. My dear friends- Maggie Schneider, Allison Smathers, Kurt Selle; thanks for all your care and love; I am so happy to know you and thanks for all encouragement and motivation. Dear Turkish friends in Raleigh; Atilla Altay Yavuz, Mehmet Erdem Ince, Alper & Rana Gurarslan, Zeynep Yurtseven and Esra Cakir, thanks for your all support, share and good friendship.
Heartily thanks to my lovely friends in Turkey; Aysegul Annakkaya, Asli Ceren Yildiz, Sema Kont, Sevil Aybar, Bilgin Dogan, Volkan Koseoglu, Banu Bayram, to my dear cousin Erhan Arac, to my siblings Imran, Kubra, Gokhan, Ulku and my parents. I am the luckiest person in the world just because of you. I cannot thank you enough for your
unconditional love, care, and endless support. It would not be possible without you. You are
always in my hearth!
Thanks for incorporating into my life structure like oil droplets, and reducing stress and toughness of Ph.D. (Doctor of Philosophy) life and making it more flavorful. With all your support, I was not very brittle against difficulties and know how to fracture the hurdles and deform things. I will use oral processing, rheology and sensory knowledge gained here to produce your desired “food texture” and make you happier…
vi TABLE OF CONTENTS
LIST OF TABLES ... ix
LIST OF FIGURES ... xii
CHAPTER 1. Literature Review: Understanding Texture of Soft Solids by Oral Processing, Sensory Analysis, and Rheological Characteristics ...1
1. Introduction ...2
2. Food Texture ...3
3. Creating and Modifying Texture ...4
3.1. Gelation of Biopolymers ...5
3.2. Agar Gels and Carrageenan Gels ...8
3.3. Multicomponent Gels (Composite Food Gels) ...10
3.4. Food Structure ...12
4. Oral Processing and Food Breakdown ...14
5. Oral Processing Analysis of Texture ...17
6. Sensory Analysis of Texture ...21
6.1. Descriptive Analysis ...21
6.2. Descriptive Analysis Combination with Time-Intensity Methods ...23
7. Rheological Analysis of Texture (Material Properties) ...27
7.1. Experimental Techniques ...28
7.1.1. Fundamental Rheological Methods ...30
8. Relationship among Rheology, Sensory, Oral processing ...44
8.1. Sensory and Rheology ...45
8.2. Sensory and Oral Processing ...54
9. Conclusion ...56
References ...57
CHAPTER 2. Alteration of Oral Processing with Increased Fracture Stress and Fracture Strain of Model Foods ...85
Abstract ...86
Practical Applications ...87
1. Introduction ...88
2. Materials and Methods ...92
2.1. Model Foods ...92
2.2. Large Deformation Rheological Tests ...94
2.3. Subject Selection ...98
2.4. Masticatory Recordings ...98
2.5. Data Anaysis ...100
2.6. Statistical Analysis ...102
3. Results ...102
3.1. Rheological Measurements of Gels ...102
vii
4. Discussion ...109
5. Conclusions ...111
References ...114
CHAPTER 3. Sensory Texture of Model Foods Based on Large Deformation Rheological Properties and Oral Processing ...131
Abstract ...132
1. Introduction ...133
2. Materials and Methods ...136
2.1. Materials ...136
2.2. Sample Preparation ...136
2.3. Large Deformation Rheological Tests ...137
2.3. Masticatory Recordings and Data Analysis ...138
2.4. Descriptive Sensory Analysis ...138
2.5. Statistical Analysis ...139
3. Results ...139
3.1. Descriptive Sensory Analysis ...139
3.2. Sensory Texture Related to Large Deformation Rheological Properties ...142
3.3. Sensory Texture in Relation to Oral Processing ...144
4. Discussion ...146
5. Conclusions ...148
References ...150
CHAPTER 4. Effect of Filler Type and Concentration on Small and Large Strain Rheological Properties of Emulsion Filled Polysaccharide Gels ...165
Abstract ...166
1. Introduction ...167
2. Materials and Methods ...171
2.1. Materials ...171
2.2. Sample Preparation ...172
2.2.1. Emulsion formation and particle size analysis ...172
2.2.2. Gel preparation ...173
2.3. Small Strain Rheology ...174
2.4. Large Strain Rheology ...174
2.5. Confocal Scanning Laser Microscopy ...175
3. Results and Discussion ...176
3.1. Emulsion Stability and Droplet size ...176
3.2. Small Strain Rheology ...177
3.3. Large Strain Rheology ...180
4. Conclusions ...185
viii CHAPTER 5. Sensory Texture of Emulsion Filled Polysaccharide Gels Explained by
Microrheology and Oral Processing ...203
Abstract ...204
1. Introduction ...205
2. Materials and Methods ...208
2.1. Materials ...208
2.2. Sample Preparation ...208
2.3. Descriptive Sensory Analysis ...209
2.4. Microrheology...210
2.5. Oral Processing ...210
2.6. Statistical Analysis ...211
3. Results and Discussion ...211
3.1. Descriptive Sensory Analysis ...211
3.2. Microrheology...217
3.3. Oral Processing ...218
4. Conclusions ...219
ix LIST OF TABLES
CHAPTER 1
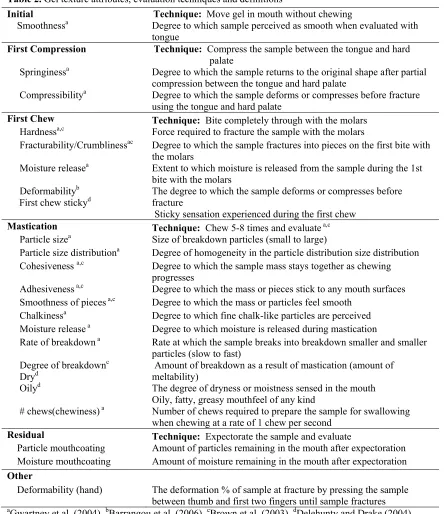
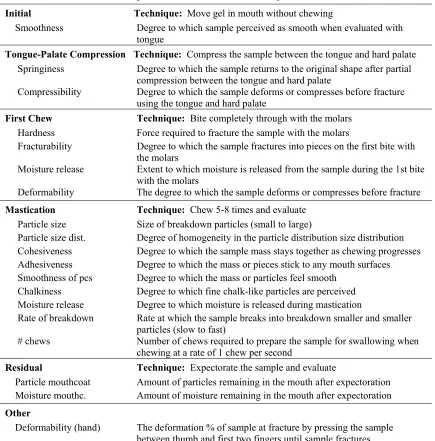
Table 1. Early classification of textural parameters (adopted from Szczesniak (1963)a, Civelle and Szczesniak (1973)b ...72 Table 2. Gel texture attributes, evaluation techniques and definitions ...73
CHAPTER 2
Table 1. Mastication parameters extracted from oral processing analysis and their
definitions ...119 Table 2. Correlation coefficients between rheological parameters ...120 Table 3. Minimum and maximum mean values obtained from all subjects while 3% (w/w) agar gels were chewed ...121 Table 4. Effects of increased fracture stress of agar gels on mastication parameters. Mean values for the treatments and standard error (SE) are presented together with the results of ANOVA and Tukey mean separation test (p<0.05). Different letters in the same row showed that treatments were different effects on parameters. Mean values were calculated from the data of 14 subjects chewing 3 replicates of each treatment in a single session (n= 42 for each level of hardness) ...122 Table 5. Effects of increased deformability of κ-carrageenan –locust bean gum gels on
x CHAPTER 3
Table 1. Evaluation techniques and definitions of sensory texture attributes ...153
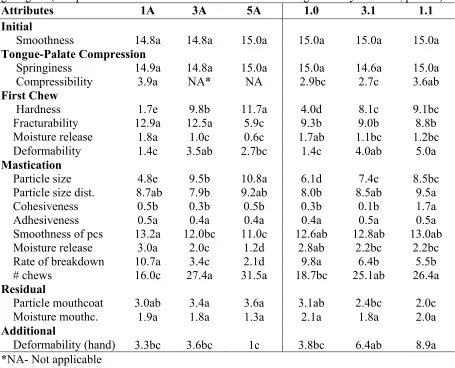
Table 2. Mean values of sensory texture attributes of agar gels and κ-carrageenan-locust bean gum gels. (Samples with the same letter within a row are not significantly different,
p<0.05) ...154 Table 3. Correlation coefficients among sensory attributes (p<0.05) ...155 Table 4. Fracture properties of agar (1A, 3A, 5A) and κ-carrageenan-locust bean gum gels (1C, 3.1C, 1.1C) (data from Koc et al., 2012a). Each data point is the average of minimum eight samples ...156 Table 5. Correlation coefficients between sensory attributes and rheological parameters ....157 Table 6. Significant correlation coefficients between rheological and mastication parameters averaged over a complete chewing cycle (p<0.05). Significant correlation coefficients in parenthesis are between first compression sensory attributes and average mastication
parameters for initial phase of chewing (first three cycles) (p<0.05) ...158 Table 7. Significant correlation coefficients between rheological and mastication parameters averaged over a complete chewing cycle (p<0.05). Significant correlation coefficients in parenthesis are between mastication sensory attributes and average mastication parameters for middle phase of chewing (middle three cycles) (p<0.05) ...159 Table 8. Significant correlation coefficients between rheological and mastication parameters averaged over a complete chewing cycle (p<0.05). Significant correlation coefficients in parenthesis are between residual sensory attributes and average mastication parameters for last phase of chewing (last three cycles) (p<0.05) ...160
CHAPTER 4
xi CHAPTER 5
Table 1. Gel texture attributes, evaluation techniques and definitions for filled gels ...223 Table 2. Mean values of sensory texture attributes of agar gels and κ-carrageenan-locust bean gum gels. (Samples with the same letter within a row are not significantly different,
p<0.05) ...224 Table 3. Significant correlation coefficients between sensory attributes (p<0.05)...225 Table 4. Significant correlation coefficients between sensory attributes and rheological
xii LIST OF FIGURES
CHAPTER 1
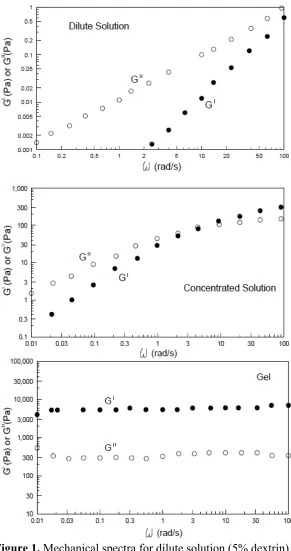
Figure 1. Mechanical spectra for dilute solution (5% dextrin), concentrated solution (5%
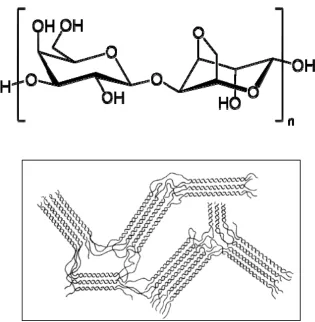
λ-carrageenan) and gel (1% agar) (reprinted from Steffe (1996)-drawn based on data from Ross-Murphy (1988)-Small deformation measurements, In: Food Structure-Its creation and evaluation)...74 Figure 2. Structure of agarose polymer (top) (reprinted from Wikipedia) and model for
agarose gelation (bottom) (showing double helices and assocation of double helices into junction zones (reprinted from Clark and Ross Murphy(1987)) ...75 Figure 3. Structure of κ-carrageenan (top) (reprinted from Wikipedia) and model for its gelation (reprinted from Morris et al. (1980)) ...76 Figure 4. Behaviors of proteins and polysaccharides when they are mixed (reprinted from de Kruif and Tuinier (2001)) ...77 Figure 5. Model for in mouth processing of food (reprinted from Hutchings and Lillford (1988))...78 Figure 6. Mandibular movement during a complete feeding sequence (reprinted from Okada et al. (2007)) ...79 Figure 7. An example of stress-strain plot showing three regions of deformation: Linear, nonlinear and fracture. Solid line represents strain-hardening behavior, dotted line represents strain-weaking behavior (reprinted from Foegeding (2006)) ...80 Figure 8. General Foods texturometer curve (reprinted from Friedman et al. (1963)) showing force versus time curve for double compression. A1- first compression A2- second
compression ...81 Figure 9. Different fracture modes in compression (top) and in torsion (bottom) testing
xiii Figure 11. a. Schematic showing fracture process zone and plastic deformation zone in a notched tension test (reprinted from Hashemi (1997)), b. Schematic showing brittle fracture (top) and elasto-plastic (bottom) fractures (reprinted from Zhang et al.(2006)) ...84
CHAPTER 2
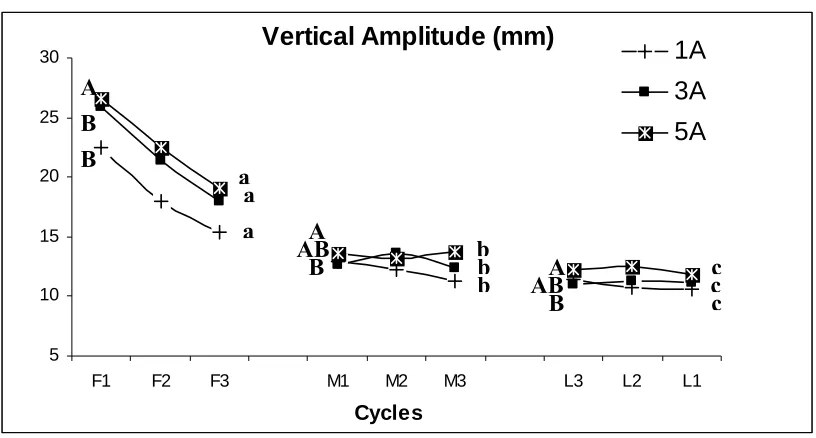
Figure1. Fracture properties of agar (1A, 3A, 5A) and κ-carrageenan-locust bean gum gels (1C, 3.1C, 1.1C). Each data point is the average of eight samples ...126 Figure 2. Example of a chewing sequence showing changes through the sequence. Interpose swallow (in circle), and clearance and swallowing section (in rectangle), C:Close, O:Open, A:Anterior, P:Posterior, R:right, L:left ...127 Figure 3. Mean values obtained for muscle activities for agar gels ...128 Figure 4. Mean values obtained for muscle activities for κ-carrageenan-locust bean gum gels ...128 Figure 5. Changes in muscle activities along the chewing sequence. (A) Agar gels (B)
κ-Carrageenan-locust bean gum gels. Mean values for 14 subjects and 3 replicates were used. Changes along the sequence were represented with first 3 cycles (F1-F3), middle 3 (M1-M3) and last 3 cycles (L1-L3) of the sequence. Upper case letters indicates differences among different level of treatments, while lower case letters show differences among first, middle, and last sections of same hardness ...129 Figure 6. Changes in vertical movements along the chewing sequence. (A) Agar gels (B)
κ-Carrageenan-locust bean gum gels. Mean values for 14 subjects and 3 replicates were used. Changes along the sequence were represented with first 3 cycles (F1-F3), middle 3 (M1-M3) and last 3 cycles (L1-L3) of the sequence. Upper case letters indicates differences among different level of treatments, while lower case letters show differences among first, middle, and last sections of same hardness ...130
CHAPTER 3
Figure 1.Sensory scores of hardness, deformability, particle size and rate of breakdown for agar gels (a) and κ-carrageenan-locust bean gum gels (b) ...161 Figure 2. (a)Number of chews and chewing time for agar (filled squares) and κ -carrageenan-locust bean gum gels (unfilled squares) (b) Chewing frequency for agar (filled squares) and
xiv Figure 3. Mean values obtained for muscle activities for agar gels and κ-carrageenan-locust bean gum gels. Significant differences (p<0.05) among treatments for each muscle are
showed with letters ...163 Figure 4. Mean values observed for three dimensional movements of mandibular for agar and
κ-carrageenan-locust bean gum gels ...164
CHAPTER 4
Figure 1. Agar gels (top images) and κ-carrageenan-locust bean gum gels (bottom images) with 20% oil droplets stabilized by Tween 20, β-lactoglobulin, lactoferrin
(from left to right) ...191 Figure 2. a. Storage and loss modulus of agar gels without oil and with 25% oil.
Legend: A-Agar, AT-Agar with Tween 20 stabilized fillers, AB-Agar with β-lactoglobulin stabilized fillers, AL-with lactoferrin stabilized fillers, b. Relative changes in storage modulus of agar gels at 1 Hz at different oil concentrations (G′ is storage modulus of filled gel, Gm′ is storage modulus of gel matrix) ...192 Figure 3. a. Storage and loss modulus of κ-carrageenan gels without oil and with 25% oil. C-Agar, CT- κ-carrageenan gels with Tween 20 stabilized fillers, CB- κ-carrageenan gels with
β-lactoglobulin stabilized fillers, CL- κ-carrageenan gels with lactoferrin stabilized fillers, b. Relative change in storage modulus of κ-carrageenan gels at 1 Hz at different oil
concentrations (G′ is storage modulus of filled gel, Gm′ is storage modulus of gel matrix) .193 Figure 4. Change in phase angle of agar gels (top) and κ-carrageenan gels (bottom) at 1 Hz at different oil concentrations ...194 Figure 5. The effect of oil phase fraction on the ratio of storage modulus of filled gel to matrix of agar gels (top) and κ-carrageenan gels (bottom) at 1 Hz at different oil
concentrations. Blue lines show modeling based on van der Poel theory assuming G′f =0, surface tension=6 mN/m and poisson ratio= 0.5 ...195 Figure 6. Change in Young’s modulus with increase oil concentration for agar gels (a) and for κ-carrageenan gels (b), Relation between complex modulus (G*) and Young’s Modulus (E) for all gels (c) ... 196-197 Figure 7. Change in fracture stress with increase oil concentration for agar gels (a) and for
κ-carrageenan gels (b) ...198 Figure 8. Change in fracture strain with increase oil concentration for agar gels (a) and for
xv Figure 9. Change in fracture modulus with increase oil concentration for agar gels (a) and for
κ-carrageenan gels (b) ...200 Figure 10. Change in stress intensity factor with increase oil concentration for agar gels (a) and for κ-carrageenan gels (b) ...201 Figure 11. Change in fracture surface energy with increase oil concentration for agar gels (a) and for κ-carrageenan gels (b) ...202
CHAPTER 5
Figure 1. Sensory results of agar (top), and κ-carrageenan-locust bean gum gels
(bottom)...228 Figure 2. PCA biplot for sensory attributes. Samples were labeled as: 1. Agar , 2. Agar with 10% oil , 3. Agar with 20 % oil, 4. κ-Carrageenan , 5. κ-Carrageenan with 10% oil, 6.
1 CHAPTER 1
Literature Review
2 1. Introduction
Food texture, in harmony with other sensory properties of foods such as appearance, taste and flavor, is one of the most important factors in consumer appreciation and enjoyment of food products. Increased demand to produce foods that are low in fat and salt, high in protein, or targeted for specific diets (gluten free, vegetarian), have led the food industry to use different ingredients and processes to produce traditional products with altered
composition. Many of these attempts resulted in less attractive, low quality products with undesirable textures (Wilkinson et al., 2000; Foegeding et al., 2010). Moreover, consumers have not been willing to compromise on texture of foods for health or other factors (Childs and Drake, 2009). Therefore, companies have been challenged with redesigning products with more appealing textures. These developments in the food industry have brought
researchers to ask the question, “How does food structure translates into perceived texture?” Our hypothesis is that this question can only begin to be answered by understanding how food structure is transformed into the cognitive representation of food texture by the process of oral processing.
Understanding the response of our senses to food structure and its breakdown requires a multidisciplinary approach including physiological and psychological aspects of
3 reviewed. Recent developments in sensory analysis, oral processing and rheological/fracture mechanics of foods, and interrelations of these disciplines, will also be considered for a better understanding of texture perception.
2. Food Texture
Food texture is a cognitive property we assign to a food based on how our senses interact with a food. It is defined as “all the mechanical, geometrical and surface attributes of a product perceptible by means of mechanical, tactile and, where appropriate, visual and auditory responses” (ISO, 1992). The texture of a food can be perceived by one of the senses of sight (visual), touch (tactile) and sound (auditory) or by the combination of these senses (Lawless and Heymann, 2010). Szczesniak (1963), a pioneering publication in texture research, classified textural characteristics in three groups: 1) mechanical characteristics are perceived by the forces on teeth, tongue and roof of the mouth when the food is stressed, 2) geometrical characteristics, are related to size, shape and the arrangements of particles in food, 3) other characteristics which are moisture and fat content of food and mouthfeel attributes (Table 1). This classification of textural properties by the scientists at General Food Corporation led to development of Texture Profile Analysis (TPA) used with
4 designed to measure any fundamental physical properties of foods (e.g., fracture stress or strain) (Foegeding et al., 2011). In addition to developments in sensory and instrumental approaches to texture evaluation, another important part of the texture puzzle, oral
processing, was brought into attention by Hutchings and Lilliford in 1988. They proposed a model explaining the breakdown pathway of food during oral processing which clearly indicated the dynamic and complex nature of texture perception with the continuous changes from food to bolus formation. Therefore, understanding texture perception and progress in this area requires a combination of research in sensory, oral physiology and
physics/chemistry (involving rheology, fracture properties, microstructure) (van Vliet et al., 2009). Study of rheological, fracture and microstructural properties of foods, and how ingredients interact to produce food structure, provides information on foods as materials. These material properties aid in understanding how food breaks down under oral conditions by mechanical, thermal and enzymatic actions. Oral physiology investigates physiological signals produced during breakdown of food and how signals modulate oral processing and form the description of texture in the brain. Sensory research provides texture perception of foods based on human assessment and has input from neurophysiology and psychology.
3. Creating and Modifying Texture
5 (Aguilera and Lillford, 2008). Gelation of biopolymers is one way to create structures and is critical to modulate texture and sensory perception (Barbut and Foegeding, 1993; Renard et al., 2006; Hermansson, 2008) of gel based foods such as yoghurts, cheese, processed meat and some desserts. Gels are composed of mostly water, and have a solid character due to the formation of a continuous network by biopolymers (proteins, polysaccharides), particles (casein micelles) or mixtures of the two (Mezzange et al., 2005). Forming a gel network requires a critical concentration of biopolymer and specific conditions that convert a sol into a gel. Factors affecting gel properties are type of biopolymer, gel formation conditions (heat-set, cold-(heat-set, enzymes), solution conditions (pH, salt), and interaction with other ingredients (Clark and Ross-Murphy, 1987; Ziegler and Foegeding, 1990; Mezzange et al., 2005). 3.1. Gelation of Biopolymers
A gel can be defined as “a soft, solid, or solid-like material composed of two or more components, one of which is liquid, presents in substantial quantity” (Almdal et al., 1993). Polymer gels and networks were classified in three groups by Ross-Murphy (1994, 1995): 1) covalently cross linked systems such as vulcanized rubber and polyacrylamide gels; 2) entanglement networks formed by interaction of chains when the product of concentration and molecular mass is greater than critical entanglement molecular mass (polymer melts and solutions) and 3) physical gels which are cross linked non-covalently (e.g., hydrogen bonding and hydrophobic interactions) and the cross-links act as junction zones. Many food
6 One of the challenges in comparing across gelation mechanisms of polymers is that they range from synthetic to biopolymers. Classical polymer systems may be a polymer melt that is fluid due to minimal interactions among molecules, and converted into a gel by
chemically cross-linking among molecules by forming inter-molecular covalent bonds. In contrast, most biopolymers start as sols or concentrated suspensions and are formed into gels by various means that include covalent and non-covalent interactions. For simplicity sake, the interactions between polymer chains will be referred to as “cross-links” to signify interactions that are producing a continuous three-dimensional structure.
Food biopolymers are typically converted to gels by a sol to gel transition. First, aqueous polymer sols are made such that full hydration of the protein or polysaccharide is achieved. The sol (fluid) is converted to a gel (soft solid) by assembling the polymer molecules into a gel network. This transition is related to connectivity of the chemical or physical interactions linking into a network. Gels are characterized by their flat mechanical spectrum measured by oscillatory shear tests. Storage modulus (G′) shows a plateau
7 intervals and gel point is determined as the time where G ′ is parallel to G″ (tanδ=G″/G′= tan (nπ/2)). Based on this experiment, another way to find that time is plotting log tanδ versus time curves for different frequencies and the intersection point of the curves gives gel point. Ideally, in suspensions prior to gelation the viscous properties dominates in the system (G′′>G′). As the network is formed, a gel point is reached (G′′>G′) and at the final stages the elastic behavior dominates over viscous behavior (G′>G′′). A cured gel must show a
relatively flat mechanical spectrum of G′ and G″ over a range of frequencies, and G′>>G′′
(Clark and Ross-Murphy, 1987) (Fig.1).
Polysaccharides and proteins are the two biopolymers responsible for gel formation in food products. Their gelation mechanisms and gel properties can be different. Generally, polysaccharides form reversible cold setting gels. By cooling, transition from disordered to order states occurs and this allows for interaction among polymer strands and formation of a gel network. Crosslinks between chains can be formed by different means. Heat-induced gelation is a common mechanism for forming protein gels. Most proteins unfold upon heating and gel by progressive aggregation into a gel network. Globular proteins such as β -lactoglobulin, ovalbumin, and plant storage proteins, form irreversible heat set gels by this process. Concentrations to form a gel are five to ten folds higher for protein gels compared to polysaccharide gels (Renard et al., 2006). Heat set protein gels can involve four different types of molecular interactions; covalent disulfide bonding, electrostatic interactions, hydrogen bonding and hydrophobic interactions. Proteins can yield different gel
8 3.2. Agar Gels and Carrageenan Gels
Carrageenan and agar are polysaccharides extracted from marine algae. They have been used in several industrial applications due their gel forming ability. They form
thermoreversible gels by transition from disordered (coil) to a helical conformation (Goodall, and Norton 1983; Hermansson, 1989) (Fig. 2, Fig. 3). This transition takes place very fast and is similar to a first order phase transition (Ross-Murphy, 1994).
9 recover all water back into structure if submerged in water after compression (Armisen and Galatas, 2009).
Carrageenan is an anionic polysaccharide extracted from seaweeds which has been used extensively in various food products due to its gelation and thickening properties. Similar to agar, it has a galactose backbone. Carrageenan is a high molecular weight (400-560 kDa) linear polymer composed of repeating galactose and 3, 6 anhydrogalactose units which are joined by alternating 1-3 and 1-4 glycosidic linkages (Clark and Ross Murphy,
1987; Chen et al., 2001; Rey and Labuza, 1981) (Fig. 3). Depending on source, carrageenan varies in the amount of sulfate groups and their positioning along the chain. Three types of
carrageenan, kappa (), lambda (), iota (), differing degree of sulfate substitution, have
different gelling properties. Gel formation is generally induced by heating to form random coil structures then lowering the temperature and a structural transition from random coil to double helix. Helices form junction zones that lead to a three-dimensional network (Chen et
al., 2002). By small angle X-ray scattering profiles, it was found that -carrageenan forms two or three associated helices upon gelation (Yuguchi et al., 2002) (Fig. 3). Gel properties are affected by the type and the quantity of counter-ion present in the system (Hermansson et al., 1991). Kappa carrageenan has approximately 25% sulfate esters and forms strong and brittle gels in the presence of potassium salts. It is synergistic with locust bean gum and the interaction between them changes the gel texture to be less brittle, more elastic and flexible with better water holding ability. Locust bean (LB) gum is a galactomannan consisting of
linear chains of 1-4 linked -D-mannopyranosly groups and 1-6 linked -D-galactopyranosly
10 Hermansson, 1993). The gelling mechanism of mixed system of LB and -carrageenan is
not well understood. The rheology and gelling properties of -carrageenan have been
investigated alone (Yuguchi et al, 2002; Chen et al., 2002; Watase and Nishinari, 1982) and
in the presence of -carrageenan (Ridout et al., 1996), other gums (Fernandes et al., 1993; Stading and Hermansson, 1993; Chen et al., 2001) and milk proteins (Langerdorff et al., 2000).
3.3. Multicomponent Gels (Composite Food Gels)
Most food products contain more than one component (e.g., biopolymer or dispersed particle) and various types of molecular interactions that build up the structure. The
interaction between biopolymers is very important for textural properties of foods. Upon mixing of two biopolymers in a solution, there can be three main outcomes depending on molecular properties of polymers ( molecular weight, charge, solubility) and solvent quality (pH, ionic strength): 1) solubility; polymers can form a single phase when they are co-soluble which can happen in very dilute systems, 2) segregation (thermodynamic
incompatibility); polymers repel each other forms phases rich in one type polymer and, 3) association (complexation); polymers attract each other and form complexes in the same phase (Fig. 4) (de Kruif and Tuinier, 2001; Hermansson, 2008; Tolstoguzov, 2008). When phase separation occurs during gel formation, different structures are formed due to
11 phase separation is the key element determines the gel morphology. Changing the relative rates of phase separation and gelation is one way to form different structures.
Multicomponent gels can be classified in three groups: mixed gels, complex gels and filled gels (Zasypkin et al., 1997). Mixed gels are formed when two or more biopolymers form independent networks and there are no interactions between polymers. The structures of these gels would show two inter-penetrating continuous networks. Complex gels are formed from strands composed of two or more biopolymers. In filled gels, one or several biopolymers forming a network (continuous phase) that is filled with dispersed particles (i.e., a discontinuous phase).
Filler particles, such as fat globules, are dispersed within the polymer network and affect the overall macroscopic properties of the gel. Filler particle can be “inactive”, and have no association with the gel network, or form an “active” association with the network. Inactive fillers decrease small strain rigidity as phase fraction of filler (φfiller) increases. These fillers essentially form holes in the gel network. In some cases, inactive filler can form inter-particle interactions within the dispersed phase. Active fillers increase or decrease small strain rigidity as phase fraction of filler (φfiller) increases depending on the ratio of filler and gel network storage modulus.
12 2008). By controlling the ingredients and processing parameters, different gel structures can be formed thorough modifications of the interactions between components in mixed systems. 3.4. Food Structure
Food structure can be conceptualized as the structures observed in foods at the nano, micro and macroscopic levels. In other words, it is how molecules assemble into a food product. Food structure is a key element responsible for sensory properties such as texture perception (Hutchings and Lillford, 1988) and also can be related to health and nutrition. Moreover, with the advances in gastronomy, structuring foods for pleasure and luxury is another way to look at the structures. Establishing structure-property relationships has been a major focus of researchers in working with non-food materials in fields of material science and engineering. Investigations taking the approach of “food material science” started to formalize into a focused area of food science starting in 1980s with studies on meat, plant foods and baked products (Blanchard and Lillford, 1988; Peleg and Bagley, 1983).
Different gel structures exist in foods that are responsible for food quality. Depending on solution conditions, proteins can form fine stranded and particulate gel structures. Fine-stranded gel networks can be obtained by gelation of proteins under conditions of high electrostatic charge, which would be solution conditions outside of the isoelectric region or at low salt concentrations. Particulate gels are formed by proteins in the isolectric region or at high salt concentrations, where low net charge cause micro-phase separation (Ako et al., 2009). Factors affect the kinetics of aggregation and network
micro-13 phase separation (Ako et al., 2009; Stading et al., 1993; Leksrisompong, 2011). In contrast to proteins, polysaccharides are less affected by the solution conditions and tend to form fine stranded gel structures. Morphology of the network can vary with concentration and gelation process conditions (Stading et al., 1993).
14 1994). Gel structure can be examined by microscopy techniques such as atomic force
microscopy, light microscopy, confocal laser scanning microscopy, and electron microscopy. Quantification of the microstructure is achieved by image processing and analysis softwares, which can be quite complicated depending on the structure (Aguilera and Lillford, 2008). Details of microstructure quantification can be found elsewhere (Russ, 2004). As well as interest in the development of new food materials, how these structures are broken down under oral conditions is also considered. This breakdown process will determine the acceptability of foods by consumers. Understanding of food structure and breakdown is important to link the texture to the sensory perception.
4. Oral Processing and Food Breakdown
Oral processing involves the breakdown of the food, mixing particles by continuously secreted saliva and formation of a bolus to swallow. Different foods require different oral strategies for processing of various textures (Chen, 2009). Based on oral processing
consideration and material properties (rheological/fracture/tribology), foods can be classified as fluids, semi-solids, soft and hard solids (Foegeding et al., 2010). Fluids do not require chewing, oral processing time is very short, and they are characterized by rheological and tribological properties (Chen and Stokes, 2012). Semi-solids are differentiated from fluids in having a substantial yield stress and their oral processing involves palateing; which is
15 Oral processing is the preparation of food for swallowing and digestion. During oral processing, food is exposed to structural transformations with force applied by teeth
(mechanical breakdown) and lubrication effect of saliva (thermal, enzymatic breakdown) (Brown et al., 1998; van der Bilt, 2002). Mastication is a rhythmic motor activity of the jaw which is controlled by central pattern generators in the brainstem (Lund, 1976) and regulated by sensory feedback via oral and circumoral receptors in the periodontal ligament and jaw closing muscles (Lavigne et al., 1987; van der Bilt, 1995; Peyron et al., 1996; Lucas et al., 2004). Sensory information about the forces and displacements is used by the central nervous system to change the form and timing of chewing cycles (van der Bilt et al., 1995). Mastication is variable within and between individuals and affected by food texture,
anatomical characteristics of masticatory apparatus, and physiological factors such as bite force, occlusal area, number of teeth, muscle volume, activity and coordination of muscles, saliva production, swallowing threshold and also by personality characteristics (Bourdiol and Mioche, 2000; van der Bilt, 2002; Rey et al., 2007; Vinyard et al., 2008).
16 al., 2002). Selection is also related to subjects’s manipulation ability of food. Breakage is associated with the mechanical properties of food and mechanical action applied. Tooth shape, food characteristics, and coordination of jaw-muscle activity affect the breakage process (Lukas and Luke, 1983; van der Bilt, 2002). When food particles are bitten, the saliva is released and tongue presses the particles against palate and packs them together with saliva (Lucas et al., 2002). Tongue movements, as well as lips and cheeks, play important roles for food manipulation, swallowing and also in evaluation of food (Okada et al., 2007; Boyar, 1986). Saliva dissolves the food and releases compounds giving taste and odor. It also softens the fragments of food, thus the friction is decreased. Saliva has an important role in adhering food particles together to form a cohesive bolus (Lucas et al., 2002). Saliva originated from three sources: 1) sublingual glands (beneath the tongue) that secrete mucous-rich film over the oral cavity to reduce friction; 2) the parotid gland (near the ear), lying on the same side of the mouth as that on which food is chewed, sprays a thin serous wetting secretion over particles just after they are fragmented during jaw closing; 3) the submandibular glands (beneath the jaw) produce thicker saliva that forms a pool in the anterior part of the floor of the mouth.
17 and food-oral lining interfaces and friction needs to be overcome by tongue to move the particles from mucosa. Fragments should have a critical particle size (0.82-3.04 mm for different foods), depending on mechanical characteristics of the food (Jalabert-Malbos et al., 2007). Particle size distributions are similar among subjects for a given food but different among foods. Particle size distribution provides information on how easily foods are
processed (Prinz and Lucas, 1995; Jalabert-Malbos et al., 2007). Lubrication can come from saliva, water or fat release from the food. Swallowing is triggered when the physical
properties of a food bolus reaches a certain state that can be transported through the soft tissues of pharynx and esophagus safely (Hutchings and Lillford, 1988; Lucas et al., 2002; Peyron et al., 2011). However, optimum physical properties of a bolus for swallowing are not fully known. Swallowing initiation is possibly a process that takes several bolus
properties into account (Peyron et al., 2011). It may also include information from muscles or receptors and sensory experiences. In a chewing sequence, multiple swallows can occur (Hiiemae, 2004). Interposed swallows occur within chewing cycles and terminal swallow ends the mastication sequence (Okada et al., 2007). Generally, mastication sequence ends with some irregular jaw movements and terminal swallow. This process at the end of chewing sequence before the terminal swallow is called as clearance (Hiiemae et al., 1996) (Fig. 6).
5. Oral Processing Analysis of Texture
18 dental studies; 2) studies on the masticatory process, receptors, reflexes and sensory
feedback; 3) food science, relation between sensory experiences, mechanical properties of food and mastication parameters. Many different techniques have been used to address research questions in first and second group and they are beginning to be more highly utilized in food science.
Masticatory function has been one of the main interests in dental studies because of its relevance to dental health. It is a measure of an individual’s ability to break down food during chewing (van der Bilt, 2002). Masticatory function has been determined by
measuring color change in chewing gum, sugar loss in gum, optical scanning of chewed particles, and sieving to determine particle size. Sieving has been widely used as a way of measuring particle size distribution by determining weight percentage of masticated food that would pass through a series of sieves with different pore sizes. As one would expect, mean particle size decreases as a function of chewing strokes (van der Bilt, 2002). Some other techniques used to record masticatory functions are: recording electrical activities of masticatory muscles (electromyography, EMG), recording jaw movements
(electrognathography, EGN), recording of force during chewing or biting, and observation of tongue and soft tissues by videofluorography and ultrasonic echo-sonography (Woda et al., 2006; Boyar and Kilcast, 1986). Among these methods, EMG and jaw tracking have been used to study food texture.
Studying oral processing via electromyography (EMG) and 3-dimensional jaw
19 science of recording electrical activity of muscle fibers. When muscles are activated,
electrical action potentials are propagated along stimulated muscle fibers; these changes are recorded by electrodes. These bioelectrical activities have been closely related to the forces developed during mastication (Hylander and Johnson, 1993, Woda et al., 2006).
20 product and how food is processed in the mouth up to swallowing and serve as one
physiological assessment of texture.
21 6. Sensory Analysis of Texture
Sensory science studies the human responses to external stimuli as they are perceived by human senses. It is a multidisciplinary area and involves research in psychology,
physiology, psychophysics and statistics (Drake, 2007). A wide range of sensory techniques are available to measure human responses to food and characterize food texture. Two basic categories of sensory tests are analytical and affective (consumer) tests. Analytical tests (difference, threshold, descriptive tests) are objective and use trained judges, while consumer tests (preference, hedonic, conjoint, just about right, interview, focus group and focus panel) are subjective and use consumers (Lawless and Heymann, 2010; Meillgard et al., 2007). 6.1. Descriptive Analysis
Descriptive tests, as the most comprehensive and useful analytical sensory technique, have been used to establish relationships between sensory and instrumental measures.
Descriptive tests are conducted by a trained group of judges (6-12) to identify and quantify sensory attributes of food products. The extent of training varies based on the number and complexity of the attributes evaluated. Training may require 60-120 h in some cases
(Chambers et al., 2004) or a few hours may be enough for describing a few, distinct attributes (Drake, 2009). The results obtained from a descriptive panel are similar to instrumental data as panelists are treated as sensors of instruments.
22 composed of attributes which are representative, discriminatory, orthogonal (non-redundant), unambiguous and ideally having references. Language development requires using
representative sample sets. In establishing a lexicon, a large number of products should be screened to account for comprehensiveness of attributes and variability among products. Non-redundancy is another key property of a good lexicon; different terms should not be used to describe the same attribute. All terms should have definitions and these definitions should be clear and have the same meaning to every panelist. References are also important factors in developing a robust sensory language. Using multiple references (either food or chemical) is recommended since different individuals can identify an attribute better in some references over others. Having a language that can be related to consumer concepts and instrumental measurements is another important part of developing a lexion. However, the ability to have these relations is not always possible. Details of establishing a lexicon and several established descriptive analysis techniques with different approaches are reviewed elsewhere (Murray et al., 2001, Lawless and Heymann, 2010, Drake and Civille, 2003).
23 Spectrum, the leader leads the panel by participating in panel training (scale usage, language development and application). Data is recorded using line scales and 15-point category scales for QDA and Spectrum, respectively. A product specific scaling is used in QDA, whereas a universal scaling is the choice for the Spectrum method (Drake and Civille, 2003). The terms in a lexicon can be non-technical in QDA. In this technique, it is assumed that judges use different parts of line scales, thus relative differences among products are obtained, not absolute values, which can make it more difficult to compare results from different panels. Intensity scales in Spectrum are absolute and universal. They have the same intensity across scales for different attributes. However, product specific scaling can also be available in Spectrum technique. Also terms are technical. This characteristic of the Spectrum method brings an important amount of time and financial investment to method development and training the panel (Drake and Civille, 2003; Lawless and Heyman, 2010). 6.2. Descriptive Analysis Combination with Time-Intensity Methods
Sensory perception of flavor and texture is a dynamic process with perception and intensity of attributes changes throughout oral processing steps of first chew, mastication, and swallowing. This phenomenon has been addressed at a first approximation in the texture profile method separating terms according to, first bite, mastication, and residual. In general, descriptive methods judge the perceived intensity of an attribute (e.g., level of sweetness) and, thus require integration of the sensory perception over time. Changes occur during this time frame can not be obtained from static judgments (Lee and Pangborn, 1986; Cliff and Heymann, 1993; Dijksterhus and Piggott, 2000). Time-intensity (TI) methods allow
24 information. Research on TI was started on taste sensation; with the first published study on the perception of salty taste (Holway and Hurvich, 1937). This was followed by TI of bitterness (Sjostrom, 1954) and sweetness (Lawless and Skinner, 1979; Birch and Munton, 1981). Methodology improved over the years from using clocks, papers, and food pedal controlled chart recorders to computerized systems (Cliff and Heymann, 1993; Lawless and Heymann, 2010). This resulted in many investigations using TI in the 1980s and 1990s. Some parameters extracted from TI methods are peak intensity, total duration, area under the curve, areas under the rising and descending phases, rising and declining slopes and time to peak. Time dependent sensory data can be collected in different ways. Discontinues
sampling is the earliest approach where panelist rate the attribute at different phases of eating as done in texture evaluation in first chew, mastication and residual. Data can also be
collected by continuous tracking of attributes, mostly done on perception of taste and aroma. Another method of TI which is developing is temporal dominance sensations (TDS) (Pineau et al., 2009). In this technique, dominant sensations (the most striking perception at a given time) are selected by panelists from a predetermined attributes and evaluated over time individually. The main advantage of TDS over other TI methods is the possibility of gathering temporal information on up to 10 attributes at one evaluation session. Other techniques give time intensity measurement of a single attribute.
25 would evaluate the product at different amounts of time, thus causing evaluation of a hot beverage at different temperatures. Application of TI methodology on texture studies is more limited compared to studies on taste and odor. Ice cream coldness, iciness and sensory viscosity (Mooere and Shoemaker, 1981), in addition to melting behavior of spreads (Tuorila and Vainio, 1993), were studied with TI. Melting property of ice cream and fats gives time-intensity curves that start with a maximum time-intensity and declines (unidirectional). Gelatin hardness (Larson-Powers and Pangborn, 1978), meat tenderness (Butler et al., 1996; Duizer et al., 1996; Zimoch and Gullett, 1997), viscosity of chocolate puddings (Pangborn and Koyasako, 1981), juiciness of meat (Peyvieux and Dijksterhius, 2001; Zimoch and Gullett, 1997), adhesiveness and cohesiveness of peanut butter (Rine, 1987) are some other textural attributes evaluated by continuous TI. Maximum firmness is perceived at 0 time and
26 while brittleness and lightness are perceived in the middle phase. Stickiness is observed in last phase of mastication.
Conducting TI tests is not easy and individual variations in the TI curves are observed (Peyvieux and Dijksterhuis, 2001). A profiling study before the experiment has been
27 7. Rheological Analysis of Texture (Material Properties)
Many instrumental techniques have been developed to determine the rheological characteristics of food materials. Rheology is the science of the deformation and flow of matter, concerned with forces, deformations and time (Blair, 1958). Rheological
28 parameters related to material properties. Fracture stress reflects the strength of the material while fracture strain is related to deformability of network. Another parameter derived from the curve is area up to fracture which is called as specific work of fracture (J/m3) or
toughness (Walstra, 2003). 7.1. Experimental Techniques
Instrumental techniques to study textural properties of foods have historically been classified into fundamental, empirical and imitative tests (Blair, 1958). Fundamental rheological tests measure the material properties of foods by determining direction and magnitudes of stresses and strains. The tests require the material to be homogeneous and isotropic on a scale in proportion to the sample size and testing cell to provide measurements that are independent of sample size, dimension and test. Some examples are small and large strain tests for solids which gives well defined physical properties of the system such as small strain tests providing information on viscoelastic nature of food with storage modulus (G′) and loss modulus (G″) parameters.
29 testing quality of gel type materials. An example of penetrometers is the bloom gelometer, developed for testing of gelatin gels (Bloom, 1925). In this test, the force is measured when a certain weight of cylindrical plunger (12.7 mm diameter) penetrates 4 mm into the surface of the gel. Gelatins are characterized based on their gel strength defined by Bloom units (100 Bloom-very weak gel, 250 Bloom-firm gel). Some other empirical methods are compressors (Brinell hardness tester, Baker compressimeter), shearing devices (Kramer shear press, Warner-Bratzler, pea tendometer, consistometers (Bostwick consistometer for ketchup), tenderometers (Breen, 1975; Friedman et al., 1963, Szczesniak et al., 1963), and
extensiograph, farinograph, amylograph.
Imitative tests try to mimic the mouth conditions which food is subjected to. Based on the characterization of texture terms by the scientist in General Foods in 1960s and the denture tenderometer developed at the MIT (Protector et al., 1955), instrumental TPA was developed by Friedman et al., (1963). The texturometer applies a two-cycle compression of a bite size sample to 25% of its original height (75% compression) for simulation of jaw movement in first chews. Analysis of force-deformation (time) curve provides different textural measures (Fig. 8):
1) Hardness: height of the first compression peak
2) Cohesiveness: ratio of A2 (area under the second compression peak) and A1 (area under the first compression peak)
30 4) Adhesiveness: area under the negative peak for the first bite which represents work
required to pull the plunger away from the sample
5) Brittleness (fracturability): height of the first significant peak in the case of multiple peak shape curves.
6) Chewiness: product of hardness, cohesiveness, elasticity 7) Gumminess: product of hardness and cohesiveness
After instrumental and sensory TPA were developed, the relation between those was investigated and instrumental TPA gave good correlations with sensory texture profiling (Szczesniak et al., 1963). Instrumental TPA was adapted to the Instron universal Testing Machine by Bourne (1968) only by changing the definition of cohesiveness. He considered the areas under only the compression portion and removed the decompression part from the calculations. This definition was further modified by Drake (1966) and Peleg (1976) by subtracting the decompression area from compression area to obtain net work (Bourne, 1978). TPA was also critically judged and some modifications were proposed by Sherman (1969). TPA has been used to evaluate the texture of different types of foods with different testing conditions (sample size, shape, size of compression unit, percent deformation, test speed) and review of these studies and discussions, modifications on the TPA terminology can be found elsewhere (Breene, 1975).
7.1.1. Fundamental Rheological Methods
Fundamental rheological tests measure the physical properties of foods. The usefulness of fundamental tests is that material properties can be linked to molecular
31 explained by the relationship of two parameters, stress and strain. Stress (σ) is the applied force to per unit area, strain (ε) is the deformation per unit length (Steffe, 1996). The direction of applied force with respect to surface determines the type of stress being normal (perpendicular) or shear (parallel). Normal stresses are applied in compression and extension tests, while shear stresses take place in rotational rheometry and torsion tests.
Two extremes of rheological behavior are elastic and viscous properties. Ideal elastic materials (solids) obey Hooke’s law where the relationship between stress and strain is linear. The proportionality constant between stress and strain is the elastic modulus (E) under
normal stress conditions and shear modulus (G) under shear stress conditions. Stress-strain relationships for elastic materials is time/rate independent. Ideal viscous materials (fluids) obey Newton’s law where the relationship between stress and strain rate (degree of
deformation with respect to time) is linear. Foods are viscoelastic and exhibit both solid-like and fluid-like behavior. Viscoelastic characteristics of materials depend on the rate at which force is applied, thus time scale is an important factor. Deborah number (De) takes the time into account and defines the solid or fluid nature of the materials.
De= t/T where t is the response time of material and T is the time frame of the experiment. For solid-like behavior, De is expected to be large (De>>1).
32
Small Deformations (Linear Viscoelastic Region)
The linear viscoelastic region is probed by small strain rheological test, small amplitude oscillatory shear (SAOS) and transient experiments (creep compliance, stress relaxation). In SAOS tests, sinusoidal stress or strain is applied to material and material’s response to this dynamic shear is measured. These tests are widely used to study gel network formation and time dependent viscoeleastic properties. Storage modulus (G′), loss modulus (G″) and phase angle (δ) are the main parameters obtained from the test. Storage modulus represents the energy stored elastically in the material over the time frame of the test, while loss modulus is a measure of the energy dissipated. Phase degree (tanδ= G″/G′) indicated the relative degree of viscoleasticity at a given frequency. For an ideal solid, applied stress and response strain are in-phase and the phase angle is 0°. For an ideal liquid, applied stress and response strain are 90 degree out of phase, and phase angle is 90° (Steffe, 1996; Daubert and Foegeding, 1998).
33 function of temperature at constant stress or strain and frequency) and time sweeps (at
constant frequency and temperature) allow for determining how materials adjust to the environment (Rao, 1999).
Large Deformations (Nonlinear Region and Fracture)
It is easier to establish theoretical models based on data from the LVR because it is assumed that non-destructive forces and deformations are used to study time or temperature dependent changes in the material. Although, this regime provides a mechanical fingerprint of food materials, studying rheological properties under large deformations is more related to end use of foods; food breakdown and texture (Bot et al., 1996). Large deformation behavior involves the non-linear region and fracture. Large strain tests (shear, compression, torsion) and large amplitude oscillatory tests can be used to study these regions and obtain material properties.
Non -linear Region
34 3
2 ⁄
Elasticity parameter is 2 for ideal elastic material and it is a measure of deviation from nonlinearity. λ is the stretch ratio. The BST model was applied to gelatin gels (Bot et al., 1996; Groot et al., 1996) to study their large deformation behavior at varying
experimental conditions and n was reported between 2.5 and 5.5. McEvoy et al. (1985) used the BST model in agarose and gelatin gels. Agarose deviates from ideal elastic behavior more than gelatin which is explained by more extended junction zones with shorter flexible chain segments between zones. Although the BST model gives good fit to data, a link between fitting parameters and the molecular structure needs to be established. Molecular interpretation of strain hardening models proposed by Flory and by Thelor, along with applications of other models by Monte Carlo stimulations, is discussed by Groot et al., (1996). They state factors attributable to strain hardening behavior of gelatin gels as finite polymer length, fractal structure of the strands and presence of stiff rods and flexible coils in the structure. Also, it is concluded that theories explaining gelatin gel behavior can be applied to other polymers with strain hardening behavior. Studies of nonlinear behavior via large amplitude oscillatory shear (LAOS) can also provide new measures to probe nonlinear material properties of soft solids. Some applications and information on methodology can be found elsewhere (Edwolt et al., 2008).
Fracture Properties
35 properties of viscoelastic materials involve several parameters as a function of strain rate, which include fracture stress, fracture strain, work of fracture and fracture modulus (van Vliet and Walstra, 1995). The changes that define fracture are (van Vliet and Walstra, 1995):
1) All bonds that structural elements are connected through in macroscopic plane are broken.
2) Changes in structure over length scales larger than size of structural units. 3) Specimen falls apart into small pieces.
All three must occur, for fracture to happen, while for flow only first one is needed and for yielding (spreading) just the first two. Fracture in viscoelastic materials can also be
described by an energy balance (Luyten et al., 1991; van Vliet, 2002) which can be written as:
W= W′ + Wm″ + Wc″ + Wf
where W= total energy input, W′= stored energy, Wm″= dissipated energy caused by network flow, Wc″= dissipated energy by the friction components in the network, Wf= energy for fracture. The latter can involve flow of liquid through gel network due to deformation and friction between fillers and continuous phase (Luyten et al., 1991).
36 Estimation of stored energy can be done in two ways; hysteresis experiments (recoverable energy) and dynamic experiments.
Recoverable energy (degree of elasticity) is determined by
compression-decompression test using area under force-deformation curve during compression (W1) and decompression (W2) were calculated and %RE were expressed as
%RE = 100
which represents the ratio of recoverable work to total work (Kaletunc et al., 1991).
Recoverable energy decreases with increasing strain and decreasing strain rate. The amount of recoverable energy is hard to determine exactly; because some delayed elastic recovery can occur after unloading. A second way to estimate stored energy is measuring loss tangent in small strain dynamic testing (Luyten et al., 1991). Phase angle varying between 0-90o gives information about the elastic and viscous character of materials. For example, if the loss tangent, ratio of G″ to G′, is 0.31-40, then recoverable energy is about 71-76% assuming G″ represents energy lost and G′ energy stored. Deviations between RE obtained from small and large strain tests can be due to some fracture inside the sample before macroscopic fracture occurs. Moreover, magnitudes of applied stress and strains are different, thus energy dissipation can be different under these conditions.
37 Uniaxial compression, uniaxial tension, torsion, and bending are methods used to determine fracture properties. Food materials can fracture in shear, tension and compression or a combination. The mode of fracture can be determined by looking at the fracture plane angle relative to the longitudinal axis.
Not all tests can be applied to all type of materials. Compression tests have been widely used because they are easy to perform and the specimen is not attached to the testing machine. Friction between sample and testing surfaces and loss of moisture during
deformation can cause problems associated with compression testing. Based on the analysis of stresses in compression (Hamann et al., 2006), if a sample fractures in the longitudinal direction, it indicates failure in compression or tension, while fracture plane at angle of 45o with the longitudinal axis indicates failure in shear (Fig. 9). Mode of fracture in compression can depend on length to diameter (L/D) ratio. If this ratio is less than 0.7, then it has an effect on the results (Peleg, 1977; Diehl et al., 1979). Compression test has limitation at higher strains (>2-2.5), because of non-predictable changes in sample dimensions (Truong and Daubert, 2000). Tensile tests are difficult with food materials because they require strong attachment of samples to the testing equipment and fracture should occur away from where the sample is attached. The advantage of tensile tests is that you have in theory infinite strain and fracture is easy to observe.
38 Capstan shape sample ensures the fracture in the center during twisting action. The test was developed by Diehl et al. (1979) to test fracture properties of fruits and vegetables. Torsion test may not be applicable to soft and sticky materials (Troung and Daubert, 2000). In the torsion test, if a sample fractures plane perpendicular to longitudinal direction, it indicates failure in shear, while fracture plane at angle of 45o with the longitudinal axis indicates failure in tensile (typical for brittle materials) (Fig. 9). Bending test combines compression, tension, and some shear. In tension and bending tests, it is possible to make artificial notches and notch sensitivity can be determined (Luyten et al., 1992). Although rate of deformation changes differently for each method, fracture stress and strain obtained by from different tests are in good agreement. Relative rate of deformation depends on height of sample. Rate of deformation increases in compression and it decreases in tension. In bending, change in the rate is different in different parts of the piece.
Fracture stress, strain and modulus are common mechanical parameters reported in the texture studies of food materials. In addition, changes after the point of fracture (van der Berg et al., 2008) with compression are studied to understand breakdown pattern of foods. Moreover, fracture energy of foods have been evaluated by cutting (Atkins and Vincent, 1984), bending, tension and wedge-fracture test (Vincent et al., 1991; Alverez et al., 2000; Charalambides et al., 1995; Gamonpilas et al., 2008).
Post-fracture Behavior (Breakdown Properties)