Safe Overprovisioning: Using Power
Limits to Increase Aggregate Throughput
?Mark E. Femal and Vincent W. Freeh
Department of Computer Science North Carolina State University {mefemal,vwfreeh}@ncsu.edu
Abstract. Management of power in data centers is driven by the need to not exceed circuit capacity. The methods employed in the oversight of these power circuits are typically static and ad-hoc. New power-scalable system components allow for dynamically controlling power consumption with an accompanying ef-fect on performance. Because the incremental performance gain from operating in a higher performance state is less than the increase in power, it is possible
tooverprovisionthe hardware infrastructure to increase throughput and yet still
remain below an aggregate power limit. In overprovisioning, if each component operates at maximum power the limit would be exceeded with disastrous results. However, safe overprovisioning regulates power consumption locally to meet the global power budget. Host-based and network-centric models are proposed to monitor and coordinate the distribution of power with the fundamental goal of increasing throughput. This research work presents the advantages of overprovi-sioning and describes a general framework and an initial prototype. Initial results with a synthetic benchmark indicate throughput increases of nearly 6% from a staticly assigned, power managed environment and over 30% from an unman-aged environment.
Keywords: overprovisioning, managing power limits
1 Introduction
Our primary motivation is to increase throughput, given defined power limits, by in-creasing parrallelism. High performance clusters such as BlueGene/L [1] make use of low-power, modest clock rate processors to provide more efficient performance with re-spect to energy consumption. A similar approach can be taken with frequency scalable CPUs and general-purpose hardware. The CPU is a dominant power consumer in most servers and is consequently our initial focus. In addition, there is a manufacturer com-mitment towards CPU power conservation as exhibited in the ACPI Specification [2]. In general, scaling the the processor from higher to lower power gears tends to slow down power usage in other devices. The relationship of the CPU frequency (F) and voltage (V) is given by [3]:
CPU Power =A·C·V2·F
WhereAis the activity factor for how frequently gates switch andCis the total capac-itance at the gate outputs. Frequency is proportional to voltage; therefore, CPU power
is proportional toF3
. However, to the first approximation, performance is proportional toF.
Many large data centers have a goal of managing instantaneous power consump-tion. The physical infrastructure of data centers is typically partitioned into a set of circuits. These circuits, allocated per rack, provide a maximium quantity of instanta-neous power. Data center personnel approach the problem of assigning equipment to racks (provisioning) conservatively. Exceeding the circuit power limit can cause a dis-ruption in service. Therefore, managing instaneous power consumption is often a higher priority than reducing energy consumption.
Complicating the delicate balance of maintaining a safe upper bound on power con-sumption, significant variation occurs based on the state of connected equipment. A server that boots needs near its maximum rated amount of power. In contrast, lightly loaded and idle servers draw significantly less power. An analysis of work performed and power consumed facilitates safe overprovisioning. This benefit offers data centers the ability to maintain peak performance in defined power limits.
The general concept of overprovisioning is not new in industry. For instance, equip-ment exists to establish a sequence of power up when disruptions occur along with the ability to monitor aggregate power usage [4]. Hardware provides a means of reacting to power failures and monitoring circuit health; however, it is not a good mechanism for controlling power in a concerted fashion. Such intelligence must be used in environ-ments that suffer from the inability to expand their power infrastructure.
We regard saving energy as a secondary goal in intelligent power allocation. In ad-dition, we choose to not require changes to existing applications. We do not preclude possible gains by allowing applications more control in the decision process but believe solutions that require this to function are too restrictive. Our initial implementation results reflect at least a 6% gain in throughput in a synthetic benchmark while still re-maining below a fixed aggregate power limit. This performance gain includes a static analysis done to ensure cluster nodes are operating at the best gear. In unmanaged envi-ronments, using the same benchmark, our implementation provides a throughput gain in excess of 30%.
In section 2 we provide an overview of the principles and design aspects of our model. Section 3 discusses the implementation. Section 4 illustrates preliminary results. Section 5 presents related work and section 6 outlines conclusions and future efforts.
2 Overview
It is useful to first formalize the motivations mentioned previously. Given a defined
power limitPglobal, a finite number of nodes can complete work subject to this
con-straint. If we denotePgear as the power consumption of a node in a given
perfor-mance gear, the number of total nodes (all nodes execute in the same gear), can be
represented asNgear = bPglobal/Pgearc. Next, given the throughput for a node in a
given gear represented by the functionT(Pgear), total throughput of all nodes is
work
target 450 W Limit
150 W
150 W
150 W 100%
1/3 Work
1/3 Work
1/3 Work
450 W Limit
112.5 W
112.5 W
112.5 W
112.5 W 120%
3/10 Work
3/10 Work
3/10 Work
3/10 Work benefit
work target
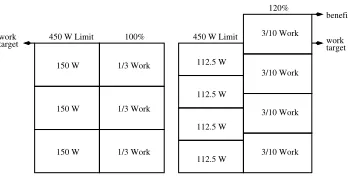
Fig. 1.Managing power to a 450 watt limit based on a 10% reduction in original work and 25% reduction in node power.
per unit energy over timetis,Enode =T(Pgear)/(Pgear ·t). The overall efficiency
ofnnodes isEtotal=Ttotal/(n·Pgear·t). A known relationship betweenPgearand
T(Pgear), provides the impetus for increasing overall throughput. Modeling
theoret-ical power usage withPgear is simplified above for clarity. In practice, with varying
workloads the maximum, minimum, and average power usage can differ significantly.
In addition to findingNgear, it is possible for a mixed set ofPgearvalues to maximize
Pglobal. In general, there is a work benefit when∆Pglobal > ∆Ttotal. IfPglobalα Fκ,
whenκ≤1andnincreases there is a gain inEtotal.
Figure 1 depicts the aforementioned general strategy. In a given interval, the total power available to all nodes is constrained by a 450 Watt limit. Each node on the left
executes unconstrained and consumes 150 Watts while completing1/3of the work. In
contrast, the overprovisioned nodes on the right are now restricted to1/4of the power
budget so consume 25% less power per node. If the restricted nodes execute with a 10% penalty in work contribution, a reasonable expectation, these nodes provide a realized benefit of 20% due to exceeding the original work target. This example is presented for illustrative purposes and it provides the incentive to manage power consumption to increase throughput.
2.1 Local Power Limit
The locally assigned power limit for each participant in the network is regarded as a mutual decision based on global constraints. Given the global budget, each node is responsible for the suballocation of power at a fine-grained level. Each node operates within its derived maximum power limit. It is free to choose where to set its own target usage level based on need, priority, or other relevant measures.
With this allocation in mind, it is possible for the global power allocation mecha-nism to account for each node’s power need based on the relative difference between its target usage and current limit. This allows flexible policies to be deployed at the local level but still utilizes the same simple interface for the allocation of the global budget. The global budget can be considered to be dynamically assigned based on intelligent devices on the network. For instance, smart racks or uninterruptible power supplies may supply the information for autonomic operation.
LPA GPA
NIC DISK CPU
Cluster Node local limit
target
global limit
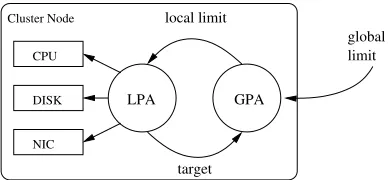
Fig. 2.Relationship of the GPA, LPA, and power-managed devices.
well as minimum and maximum power requirements directly to power management algorithms. Although elements of this are available in laptop systems using the ACPI specification [2], future development of consistent interfaces to hardware should help promote similar access to server sensors using the same specification.
2.2 Design
Our general design approach to power distribution is encapsulated with the producer-consumer model. The power producers are regarded as the suppliers of power to various components. The producer at the cluster node level, such as its power supply, may in fact be a consumer at the global level but the approach is conveniently generalized in a hierarchical manner. Thus, each device in the overall system fits in this hierarchy. The policies for each device must be flexible enough to adapt to the unique demands for services from that device. The interface between devices is through its budget and aggregated at upper levels as applicable. The units of budget allocation align with mea-surement methodology (watts).
2.3 Components
A number of logical components comprise the framework and are shown in Figure 2. Starting at the lowest level, device controllers provide the intelligence to determine the performance gear used. Each server node has this functionality aggregated into a cohesive entity referred to as the Local Power Agent (LPA). It is responsible for deter-mining the average power consumption target. There is loosely coupled communication between the LPA and the devices it manipulates with the device controller. A logical Power Message Bus (PMB), implemented as a message queue, facilitates communica-tion between device drivers and the LPA. This flexibility allows for direct control by the LPA as well as the potential for negotiation of power between device drivers.
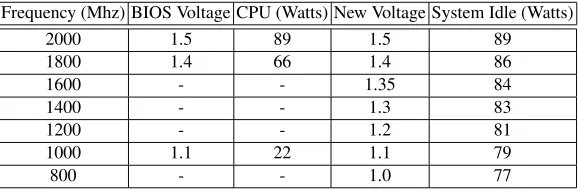
Table 1.AMD64 3000+ CPU and system idle power consumption.
Frequency (Mhz) BIOS Voltage CPU (Watts) New Voltage System Idle (Watts)
2000 1.5 89 1.5 89
1800 1.4 66 1.4 86
1600 - - 1.35 84
1400 - - 1.3 83
1200 - - 1.2 81
1000 1.1 22 1.1 79
800 - - 1.0 77
our initial implementation limits servers in a PMG to be on the same broadcast network. In addition to receiving PMG broadcasts, the GPA responds to other network requests using the Power Exchange Protocol (PEP). These messages include administrative
con-trol requests (i.e., setting the global power limit) in our initial prototype.
2.4 Architecture
For the initial development and model analysis, a cluster of servers was built using fre-quency scaling processors. Ten nodes were assembled using the following hardware: 40 GB Maxtor EIDE 7200 RPM disk drives, ASUS K8V motherboards (on-board 1Gb NIC), 1 GB of PC3200 DDR SDRAM, and an AMD64 3000+ CPU. All nodes were interconnected on a dedicated 100 Mb switch. Although we regard power distribution as a general allocation problem across a diverse set of hardware architectures and com-putational resources, our initial implementation is limited due to budgetary reasons.
The entire cluster uses the Linux 2.6 kernel. For frequency and voltage scaling,
the AMD PowerNowcpufreqmodule is used. Modifications were done to augment the
ACPI device tables in the BIOS. These additional performance gears were subsequently
used in thecpufreqdriver as indicated in Table 1. Measured system idle power
con-sumption is shown along with expected CPU power usage obtained from [5]. System
idle power reflects reduced power usage from using theHLTinstruction. The modified
frequency and voltage settings were used to expose additional gears for the purpose of our evaluation.
3 Implementation
As previously discussed in Section 2.3, there are two primary components in our im-plementation for managing power. The GPA assigns the local power limit based on the aggregate circuit capacity and information received from all cluster nodes. The LPA is responsible for ensuring the target power usage of an individual node is met. Each of these is a separate daemon process and both are implemented as non-priviledged processes.
3.1 Local Power Agent
The LPA is the aggregated power control framework for all devices in a cluster node. It is responsible for maintaining a power target and listening for inbound communication on the PMB. Each device has its inherent power characteristics coordinated with other devices by this agent. The PMB provides an abstraction between the idiosyncrasies inherent in each device and the general controller routine. Each device has several gears the LPA manipulates to control overall system power using a device specific routine exposed to the controller.
To simplify the interface to device gears, we regard the lowest power usage gear as the highest numbered performance gear. Thus, performance gear 0 in the state array for each device is the highest power usage gear. Although this is our internal convention, we still refer to increasing the performance gear as an increase in the power usage gear. The primary focus of the LPA is determining the target power based on the limit assigned by the GPA. This derivation remains flexible to have different policies imple-mented depending on the behavior desired. Two sample policies include one based on overall load and another might be to optimize for a performance delay characteristic. This policy is not restricted to a single rule, a combination of rules could certainly be employed.
A feedback controller manipulates device gears to meet the target system power set by the policy. To maintain the local power limit, the controller employs a predictor to determine the expected usage in the next epoch. We regard the power limit as an upper
bound on instantaneous power usage. A sampling window of sizewfacilitates keeping
system power close to the target. In the initial implementation, the window size is 30 seconds. To prevent excessive gear switching and allow stabilization, a minimum time between changes is enforced. This delay also helps manage the differing capabilities of devices and their subsequent ability to transition to different gears in a specified time interval.
The core controller uses a PID algorithm [6]. If system power is denoted asSand
the average power target isµ, the error is = µ−S. Next, the controller calculates
joules used in the epoch usingje = te·. With instantaneous error known and gain
constantsG1,G2, andG3, the energy surplus or deficit is
ηe=G1·je+G2·
Z w
0
jedt+G3·(je−je
−1).
Withηe known, a prediction for the next epoch is determined to ensure the node
A non-uniform distribution ofδvalues exist for each performance gear. Thus, a table is managed at runtime that represents the quantization of discrete power step values at a resolution defined at compile time for each gear. It is pessimistic due to using the
highest value seen in subsequent predictions. The estimatorPefor the expected power
usage in the next epoch is then found using
Pe=S+δ+ ((je−je−1)−(je−1−je−2))
te .
The LPA does not have a strict power limit. Instead, a burstable region exists above and below the GPA assigned limit. The impact to the feedback controller is that if given
a burst allocation ofτ and limit ofω, it isτ +ωthat is regarded as the true limit. The
burst allocation allows nodes to respond more rapidly to workload demands in lower performance gears. The current implementation regards the burstable region above the
power limit as a soft limit soPe is compared toτ +ωto determine if an immediate
gear reduction is needed. If no immediate correction is necessary,ηeis checked against
a threshold preset on LPA startup. If the threshold is exceeded andηe < 0(implies
overusage) the CPU gear is decreased. The inverse condition ofηe >0increases the
gear.
3.2 Global Power Agent
The GPA’s responsibility is to allocate the node power limit based on state information received from all nodes in the PMG. For reliability and scalability, each individual node is responsible for determining the power limit. Although there is explicit trust in ensuring all nodes are well-behaved, this precondition should be acceptable in many environments. All nodes in the PMG are synchronized by periodic UDP broadcasts. Nodes are added or removed from the subnet with corresponding changes done to power limits per the specific policy engine implementation.
Power Management Groups The cluster management policy is shared on all nodes in the current implementation. To allow for multiple logical assignments and allocations on the same broadcast subnet, a cluster identifier is configured for each GPA on daemon startup and is referred to as the PMG. The cluster data structure is an AVL tree, so
tree operations are bounded byO(lg n)wherenis the number of PMG nodes
(non-member broadcasts are simply ignored). A dedicated thread is responsible for receiving UDP packets describing the state of other nodes in the PMG as well as reacting to
administrative commands (further explained below). This thread usesselect() with a
timeout to prune the tree based on the time stamp of the last broadcast received for a cluster node and a predetermined maximum broadcast retention value. Within the current implementation, this value is 30 seconds and the broadcast rate is once per second.
power usage, limit, burst, and target values. In addition, a sequence number is sent that all cluster members use to ensure decisions are computed in a coordinated fashion. This sequence number is initially generated by the first node on a subnet.
In addition to data packets from other members in the PMG, administrative mes-sages can be broadcast to all nodes. Such notifications consist of modifications to the overall power limit to be used by the policy engine of the GPA as well as for setting an immediate administrative node limit used by a support tool. Membership in a PMG is
further refined to be eitheractiveorpassive. In passive mode, broadcasts are sent and
received as normal, but inbound administrative messages are ignored. In active mode, the node responds to administrative messages.
3.3 Support Tools
Although the long-term intent of the power management framework is to be totally autonomic in operation, the current implementation receives instructions from support tools. Tied into the same communicative protocol as the GPA, a console application monitors the state of either a specific PMG or all nodes running on a given subnet. For administrative control of a given node, a tool exists to interface directly with the LPA (as does the GPA) through shared memory or by sending messages on the PMB. For remote requests, the tool communicates indirectly through the remote node’s GPA.
4 Results
We evaluated the initial prototype and model on the architecture previously mentioned in Section 2.4. To examine the nature of the tradeoff between throughput and power, we first constructed a series of synthetic CGI [7] programs runnable by an Apache 2.0
web server. We usedhttperf [8] to generate a sustained workload by using four cluster
nodes configured as request clients. A single server was setup to handle requests and clients were configured to overload the server based on a request timeout of five sec-onds. When the aggregate number of errors for all clients exceeded five percent, we considered the throughput for the server to be maximized for a given performance gear. For the time alloted for a benchmark (30 seconds), the average system power consump-tion was calculated using the multimeters. Due to the high number of nodes needed to generate the workload effectively and current limitations measuring system power, extrapolations based on single node measurements are used to show how effective the solution performs when increasing the number of nodes. An additional cluster node is also used to control the request clients and collect the measured values for reporting purposes.
Our results notation depicts the highest performance gear (and highest power con-sumption gear) as zero. A consistent theme emerges from the synthesized benchmarks.
The highest performing gear does not have the highest performance (i.e., throughput)
0 5 10 15 20 25 30 35 40 45 50 55 60 65 70 75 80 85 90 95 100 105 110 115 120 125 130 135 140
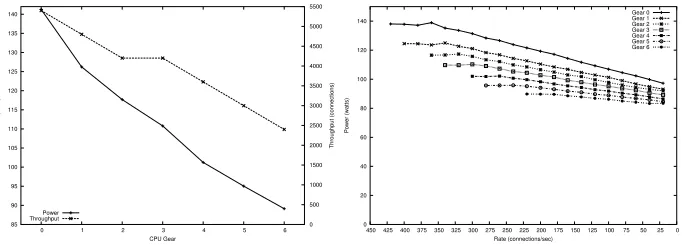
0 1 2 3 4 5 6 0 500 1000 1500 2000 2500 3000 3500 4000 4500 5000 5500 6000 6500 7000 7500 8000 8500 9000 9500 10000 10500 Power (watts) Throughput (connections) CPU Gear Power Throughput
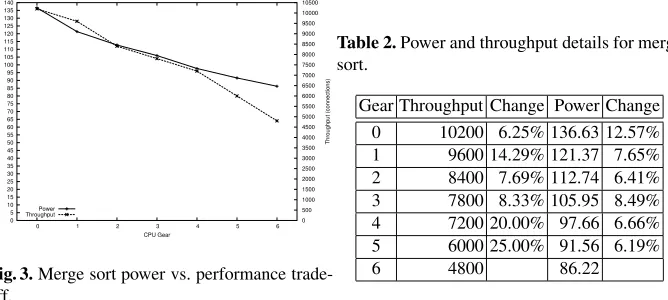
Fig. 3.Merge sort power vs. performance trade-off.
Table 2.Power and throughput details for merge sort.
Gear Throughput Change Power Change
0 10200 6.25% 136.63 12.57%
1 9600 14.29% 121.37 7.65%
2 8400 7.69% 112.74 6.41%
3 7800 8.33% 105.95 8.49%
4 7200 20.00% 97.66 6.66%
5 6000 25.00% 91.56 6.19%
6 4800 86.22
Table 3. Throughput gains with a 600 watt power limit and static gear assignment.
Nodes Gear Throughput Power Gain
4 0 40800 546.52
4 1 38400 485.48 -0.06%
5 2 42000 563.70 0.03%
6 3 46800 529.75 12.82%
6 4 43200 585.96 5.56%
6 5 36000 549.36 -11.76%
6 6 28800 517.32 -41.67%
Table 4.Power and throughput details for inser-tion sort.
Gear Throughput Change Power Change
0 10800 12.5% 140.87 11.40%
1 9600 6.67% 126.45 6.87%
2 9000 7.14% 118.32 6.06%
3 8400 7.69% 111.56 8.23%
4 7800 18.18% 103.08 7.84%
5 6600 37.50% 95.59 6.91%
6 4800 89.41
Table 2 depicts the raw data collected in this benchmark. In an environment such as this, it is possible to reduce the CPU performance gear to conserve power and in-crease the number of nodes to service that load and still dein-crease total power con-sumption. This is shown by a simple example and the data in Table 2. If the service requirement states the desired throughput is 36000 connections in 30 seconds (with a client request timeout of 5 seconds), 5 cluster nodes as configured in our architecture meet this requirement running in gear 4. The subsequent total power usage is
approxi-mately5·97.66 = 488watts. Four similarly configured servers (without managing the
power proactively) could also service this same load; however, the total power usage is
4·136.63 = 547watts. This example illustrates a decrease of about 11% in total power needed. Of the 10 benchmarks created, 9 exhibit the general trend depicted in Figure 3. The preceding example used an increase in nodes to show the benefit in conforming to a lower power limit. In addition, this same data is used in Table 3 to reflect additional gains in throughput. Notice the gain in throughput at gear 3 is nearly 13% despite the
70.25 Watts of unused power. Without a more proactive means of power allocation (i.e.,
an LPA) this represents a loss in throughput.
85 90 95 100 105 110 115 120 125 130 135 140
0 1 2 3 4 5 6 0 500 1000 1500 2000 2500 3000 3500 4000 4500 5000 5500
Power (watts)
Throughput (connections)
CPU Gear Power
Throughput
Fig. 4. Prime numbers under 10000 power vs. performance trade-off.
0 20 40 60 80 100 120 140
0 25 50 75 100 125 150 175 200 225 250 275 300 325 350 375 400 425 450
Power (watts)
Rate (connections/sec)
Gear 0 Gear 1 Gear 2 Gear 3 Gear 4 Gear 5 Gear 6
Fig. 5.Relationship of power and concurrency to print environment variables.
The resulting power-throughput relationship in Table 4 shows an even larger gain in
throughput at lower power gears (i.e., 6 to 5) than the preceeding example. On the other
hand, the benefit of the reduced power gear 1 (from 0) is not as pronounced.1
Another important result emerged from the affects of one benchmark. Figure 4 re-flects no gain in throughput going from gear 3 to 2. Unfortunately, there is a 6.21% increase in power usage for this transition. The data reveals the lower bound overload threshold was just exceeded for gear 3 and the upper bound prevented gear 2 from addi-tional gains. With this result, a power management policy should select the lower power gear.
Rather than just considering total throughput in a given time interval, one can also analyze the power needed to sustain a desirable concurrency. Figure 5 shows an ex-ample benchmark illustrating power needed in all seven gears. Depicting the highest performance on the left, in the slowest gear there is a 27.3% increase in concurrency to go to the next highest gear with a corresponding increase of 6.5% in power usage. This is noted by comparing the leftmost points of the bottom two curves. At higher perfor-mance gears the additional gains in concurrency are perhaps not worth the additional power consumption. The concurrency difference is only 5% transitioning from gear 1 to 0 with an increase of 10.9% in power consumption. An opportunity cost analysis such as this can be used in a policy controller that attempts to meet a given level of concurrency.
To verify the efficacy of the LPA, the merge sort CGI is used as a representative benchmark. In the first data set, a 1500 Watt limit is established and extrapolation starts with 10 nodes. This allows an interpolated point to occur between each static gear assignment. In the second data set, a 550 Watt limit is used and extrapolation starts at 3 nodes. To reduce variability and ensure an adequate length of time for the test, throughput measurements were obtained after sustained load was applied for 60 sec-onds. Throughput was again considered maximized based on a 5 second timeout using 4 cluster nodes as request clients. Table 5 depicts the results of the static assignment. Total effective throughput is found by subtracting the number of errors from the total
Table 5. Fixed gear throughput, aggregate
power, and ideal node power usage (Pgear =
Pglobal/N).
N Gear Throughput Power (W)Pgear(W)
3 0 62745 425.43 183.33
4 1 77184 507.92 137.50
4 2 71728 476.96 137.50
4 3 64052 444.96 137.50
5 4 71895 514.40 110.00
5 5 57805 480.10 110.00
6 6 53652 541.38 91.67
10 0 209150 1418.10 150.00
11 1 212256 1396.78 136.36
12 2 215184 1464.32 125.00
13 3 208169 1446.12 115.38
14 4 201306 1440.32 107.14
15 5 173415 1440.30 100.00
16 6 143072 1443.68 93.75
Table 6. Dynamic gear throughput and
aggre-gate power using the LPA (ω=Pgear).
N Throughput Power (W) ω(W)
4 81600 546.96 137.50
5 81745 547.70 110.00
6 63204 544.86 91.67
11 224103 1498.09 136.36
12 229584 1498.68 125.00
13 216112 1464.32 115.38
14 210826 1477.84 107.14
15 182700 1500.00 100.00
16 141232 1478.88 93.75
connections. Based on the number of nodes and the ideal power limit, the interpolated results using the LPA are shown in Table 6.
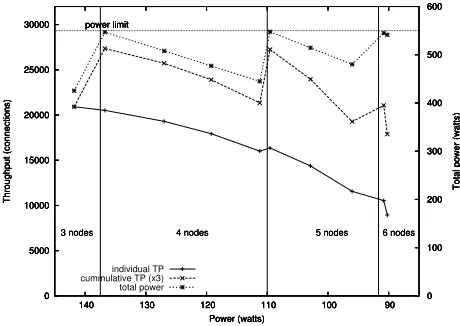
Figures 6 and 7 illustrate the benefit of overprovisioning using the data from Ta-bles 5 and 6. There are two lines depicting throughput, one for an individual node and the other for extrapolated aggregate values. As expected, the individual throughput decreases as available power is reduced. The aggregate throughput curve shows the per-formance of a cluster. When the power decrease crosses a vertical bar representing the ideal power usage, another node is supported within the power limit. It is important to note that the highest cluster throughput is not the best performance state in both figures. As the raw data in Tables 5 and 6 show, there is a 7.15% gain in throughput between gears 0 and 1 for 11 nodes. In addition, there is a 6.69% gain in throughput between a staticly assigned gear 2 and the LPA using 12 nodes. Notice that after gear 2, there is no resultant benefit from increasing the number of nodes. Additional consideration is warranted if considering an environment, subject to this same limit, that does no proactive management of performance gears. In such a case, only 10 nodes can exist under the limit so the resulting throughput benefit of the LPA using 12 nodes is 9.77%. Clearly these benefits are dependent on the power capacity available and the number of nodes. If starting with 3 nodes, the benefit from a statically assigned solution is approximately 5.91% using 4 nodes at gear 1; moreover, the gain from an unmanaged 3 node solution is 30.28% with a cluster of 5 LPA managed nodes.
5 Related Work
0 5000 10000 15000 20000 25000 90 100 110 120 130
140 0
200 400 600 800 1000 1200 1400 1600 Throughput (connections)
Total power (watts)
Power (watts) power limit
individual TP cummulative TP (x10) total power 0 5000 10000 15000 20000 25000 90 100 110 120 130
140 0
200 400 600 800 1000 1200 1400 1600 Throughput (connections)
Total power (watts)
Power (watts) power limit
10 nodes 11 nodes 12 nodes 13 nodes 14 nodes 15 nodes 16 nodes
0 5000 10000 15000 20000 25000 90 100 110 120 130
140 0
200 400 600 800 1000 1200 1400 1600 Throughput (connections)
Total power (watts)
Power (watts) power limit
10 nodes 11 nodes 12 nodes 13 nodes 14 nodes 15 nodes 16 nodes
0 5000 10000 15000 20000 25000 90 100 110 120 130
140 0
200 400 600 800 1000 1200 1400 1600 Throughput (connections)
Total power (watts)
Power (watts) power limit
10 nodes 11 nodes 12 nodes 13 nodes 14 nodes 15 nodes 16 nodes
0 5000 10000 15000 20000 25000 90 100 110 120 130
140 0
200 400 600 800 1000 1200 1400 1600 Throughput (connections)
Total power (watts)
Power (watts) power limit
10 nodes 11 nodes 12 nodes 13 nodes 14 nodes 15 nodes 16 nodes
0 5000 10000 15000 20000 25000 90 100 110 120 130
140 0
200 400 600 800 1000 1200 1400 1600 Throughput (connections)
Total power (watts)
Power (watts) power limit
10 nodes 11 nodes 12 nodes 13 nodes 14 nodes 15 nodes 16 nodes
0 5000 10000 15000 20000 25000 90 100 110 120 130
140 0
200 400 600 800 1000 1200 1400 1600 Throughput (connections)
Total power (watts)
Power (watts) power limit
10 nodes 11 nodes 12 nodes 13 nodes 14 nodes 15 nodes 16 nodes
Fig. 6.LPA performance with target power set toPgearusing 1500 Watts starting with 10 nodes.
applications can yield significant power savings. Dynamic voltage scaling (changing both frequency and voltage) to reduce power consumption was explored in [13–17].
A vast amount of research has been done with regards to energy conservation (EC) on mobile platforms [18–22]. The role of EC is complimentary to our goal of efficient power allocation. Power represents the instantaneous energy used at a specific point in time and energy is the usage of power in a defined interval. Our strategy maximizes throughput constrained by the limit using a target power. This power target could be derived from an EC policy; however, it is not a necessary condition.
Power management in commercial servers is important for web servers [23, 24]. Much of this work relies on load balancers to distribute work. An investigation of load balancing was done in [25, 26] to turn cluster nodes on or off based on load.
Addi-tional research has also been done by Elnozahyet al.[27] for developing mechanisms
for energy-efficient clusters using combinations of IVS, CVS, and VOVO policies. Al-though the VOVO policy is not considered in our initial implementation, its importance is less significant in a mixed architecture environment. In [28], an economic approach is chosen to determine the minimal number of servers required to handle load. Unlike [28]
we favor a decentralized approach and seek to maximize throughput. In [29], Sharmaet
al.applies real-time techniques to web servers in order to conserve energy and maintain
QoS. Managing to service metrics is one instance of a target power allocation mecha-nism in our local controller.
In server farms, disk energy consumption is also important. One study of four en-ergy conservation schemes concludes by stating that reducing spindle speed is the only option for clusters [30]. DRPM is a scheme to modulate the speed of the disk dynam-ically to save energy [31, 32] rather than stopping disk rotation. We plan to investigate this approach in our framework in future efforts.
0 5000 10000 15000 20000 25000 30000 90 100 110 120 130
140 0
100 200 300 400 500 600 Throughput (connections)
Total power (watts)
Power (watts) power limit
individual TP cummulative TP (x3) total power 0 5000 10000 15000 20000 25000 30000 90 100 110 120 130
140 0
100 200 300 400 500 600 Throughput (connections)
Total power (watts)
Power (watts) power limit
3 nodes 4 nodes 5 nodes 6 nodes
0 5000 10000 15000 20000 25000 30000 90 100 110 120 130
140 0
100 200 300 400 500 600 Throughput (connections)
Total power (watts)
Power (watts) power limit
3 nodes 4 nodes 5 nodes 6 nodes
0 5000 10000 15000 20000 25000 30000 90 100 110 120 130
140 0
100 200 300 400 500 600 Throughput (connections)
Total power (watts)
Power (watts) power limit
3 nodes 4 nodes 5 nodes 6 nodes
Fig. 7.LPA performance with target power set toPgearusing 550 Watts starting with 3 nodes.
with migratable loads. This work has a contribution towards policy development in the management of power limits. The approach of estimating power consumption using performance counters is taken in [35–37] and is complimentary to our notion of target power assignment.
6 Future Work
This paper has investigated the potential of overprovisioning in data centers with a focus on increasing throughput based on a defined power limit. We have presented the preliminary framework used for our research but it only represents an initial foray into the realm of distributed and local power control. Consistent with our approach to make the overall local and global mechanisms perform in a “hands free” operation, we are investigating adjustments to our local controller that will tune it automatically based on the demands of individual devices. Additional work is also needed with regards to optimizing local and global target power policies. Although target power usage has been explored, research on regarding the power limit as an unsurpassable barrier is underway along with providing intra-node differentiated service.
We have presented a framework to handle safe overprovisioning based on power limits. We have motivated the objective and goals for our research based on preliminary data collected. The additional throughput gains possible from a strategy to manage the power limit can help increase the computational effectiveness of data centers without causing difficulties with existing power infrastructure.
References
1. Adiga et al., N.: An overview of the BlueGene/L supercomputer. In: Supercomputing 2002. (2002)
2. http://www.acpi.info: Advanced Configuration and Power Interface Specification, Revision 3.0. Hewlett-Packard Corporation, Intel Corporation, Microsoft Corporation, Phoenix Tech-nologies Ltd., and Toshiba Corporation (2004)
3. Mudge, T.: Power: A first class architectural design constraint. IEEE Computer34(2001)
52–57
4. American Power Conversion Corp.: APC power distribution products. http://www.
apc.com/products/(2004)
5. Advanced Micro Devices, Inc.: AMD Athlon 64 processor data sheet. http:
//www.amd.com/us-en/assets/content_type/white_papers_and_ tech_docs%/24659.PDF(2004)
6. Minerick, R.J., Freeh, V.W., Kogge, P.M.: Dynamic power management using feedback. In: Workshop on Compilers and Operating Systems for Low Power, Charlottesville, Va (2002) 6–1–6–10
7. University of Illinois at Urbana Champaign: The common gateway interface. http://
hoohoo.ncsa.uiuc.edu/cgi/(2004)
8. Mosberger, D., Jin, T.: httperf: A tool for measuring web server performance. In: WISP, Madison, WI (1998) 59–67
9. Vahdat, A., Lebeck, A., Ellis, C.: Every joule is precious: The case for revisiting operating system design for energy efficiency. In: Proceedings of the 9th workshop on ACM SIGOPS European workshop. (2000) 31–36
10. Ellis, C.: The case for higher-level power management. Proceedings of the 7th Workshop on Hot Topics in Operating Systems (1999)
11. Flinn, J., Satyanarayanan, M.: Energy-aware adaptation for mobile applications. In: Sympo-sium on Operating Systems Principles. (1999) 48–63
12. Flinn, J., Satyanarayanan, M.: Powerscope: A tool for profiling the energy usage of mobile applications. In: Proceedings of the Second IEEE Workshop on Mobile Computing Systems and Applications. (1999)
13. Flautner, K., Reinhardt, S., Mudge, T.: Automatic performance-setting for dynamic volt-age scaling. In: Proceedings of the 7th Conference on Mobile Computing and Networking MOBICOM ’01. (2001)
14. Gruian, F.: Hard real-time scheduling for low-energy using stochastic data and DVS proces-sors. In: Proceedings of the International Symposium on Low-Power Electronics and Design ISPLED ’01. (2001)
15. Pering, T., Burd, T., Brodersen, R.: The simulation and evaluation of dynamic voltage scaling algorithms. In: ISLPED 1998. (1998)
17. Im, C., Kim, H., Ha, S.: Dynamic voltage scheduling technique for low-power multimedia applications using buffers. In: Proceedings of the International Symposium on Low-Power Electronics and Design ISPLED ’01. (2001)
18. Zeng, H., Ellis, C.S., Lebeck, A.R., Vahdat, A.: Currentcy: Unifying policies for resource management. In: USENIX 2003 Annual Technical Conference. (2003)
19. Anand, M., Nightingale, E., Flinn, J.: Self-tuning wireless network power management. In: Mobicom. (2003)
20. Helmbold, D.P., Long, D.D.E., Sherrod, B.: A dynamic disk spin-down technique for mobile computing. In: Mobile Computing and Networking. (1996) 130–142
21. Douglis, F., Krishnan, P., Bershad, B.: Adaptive disk spin-down policies for mobile comput-ers. In: Proc. 2nd USENIX Symp. on Mobile and Location-Independent Computing. (1995) 22. Li, K., Kumpf, R., Horton, P., Anderson, T.E.: A quantitative analysis of disk drive power
management in portable computers. In: USENIX Winter. (1994) 279–291
23. Bohrer, P., Elnozahy, E., Keller, T., Kistler, M., Lefurgy, C., McDowell, C., Rajamony, R.: The case of power management in web servers. In Graybill, R., Melham, R., eds.: Power Aware Computing. Kluwer/Plenum (2002)
24. Lefurgy, C., Rajamani, K., Rawson, F., Felter, W., Kistler, M., Keller, T.W.: Energy manage-ment for commerical servers. IEEE Computer (2003) 39–48
25. Pinheiro, E., Bianchini, R., Carrera, E., Heath, T.: Load balancing and unbalancing for power and performance in cluster-based systems. In: Proceedings of the Workshop on Compilers and Operating Systems. (2001)
26. Pinheiro, E., Bianchini, R., Carrera, E.V., Heath, T.: Dynamic cluster reconfiguration for power and performance. In: Compilers and Operating Systems for Low Power. (2001) 27. Elnozahy, E.M., Kistler, M., Rajamony, R.: Energy-efficient server clusters. In: Workshop
on Mobile Computing Systems and Applications. (2002)
28. Chase, J.S., Anderson, D.C., Thakar, P.N., Vahdat, A., Doyle, R.P.: Managing energy and server resources in hosting centers. In: Symposium on Operating Systems Principles. (2001) 103–116
29. Sharma, V., Thomas, A., Abdelzaher, T., Skadron, K.: Power-aware QoS management in web servers. In: 24th Annual IEEE Real-Time Systems Symposium, Cancun, Mexico (2003) 30. Carrera, E.V., Pinheiro, E., Bianchini, R.: Conserving disk energy in network servers. In:
Proceedings of International Conference on Supercomputing, San Fransisco, CA (2003) 86– 97
31. Gurumurthi, S., Sivasubramaniam, A., Kandemir, M., Franke, H.: Dynamic speed control for power management in server class disks. In: Proceedings of International Symposium on Computer Architecture. (2003) 169–179
32. Gurumurthi, S., Sivasubramaniam, A., Kandemir, M., Franke, H.: Reducing disk power consumption in servers with DRPM. IEEE Computer (2003) 41–48
33. Miyoshi, A., Lefurgy, C., Hensbergen, E.V., Rajamony, R., Rajkumar, R.: Critical power slope: Understanding the runtime effects of frequency scaling. In: Proceedings of the 16th International Conference on Supercomputing. (2002) 35–44
34. Bradley, D., Harper, R., Hunter, S.: Workload-based power management for parallel
com-puter systems. IBM Journal of Research and Development47(2003) 703–718
35. Bellosa, F.: The benefits of event-driven energy accounting in power-sensitive systems. In: Proceedings of the 9th ACM SIGOPS European Workshop. (2000)
36. Joseph, R., Martonosi, M.: Run-time power estimation in high performance microproces-sors. In: Proceedings of the International Symposium on Low-Power Electronics and Design ISPLED ’01. (2001)