Copyright1998 by the Genetics Society of America
Genetic Response from Marker Assisted Selection in an Outbred
Population for Differing Marker Bracket Sizes and with
Two Identified Quantitative Trait Loci
Richard Spelman and Henk Bovenhuis
Department of Animal Breeding, Wageningen Institute of Animal Sciences, Wageningen Agricultural University, 6700 AH, The Netherlands
Manuscript received July 14, 1997 Accepted for publication November 24, 1997
ABSTRACT
Effect of flanking quantitative trait loci (QTL)-marker bracket size on genetic response to marker assisted selection in an outbred population was studied by simulation of a nucleus breeding scheme. In addition, genetic response with marker assisted selection (MAS) from two quantitative trait loci on the same and different chromosome(s) was investigated. QTL that explained either 5% or 10% of phenotypic variance were simulated. A polygenic component was simulated in addition to the quantitative trait loci. In total, 35% of the phenotypic variance was due to genetic factors. The trait was measured on females only. Having smaller marker brackets flanking the QTL increased the genetic response from MAS selection. This was due to the greater ability to trace the QTL transmission from one generation to the next with the smaller flanking QTL-marker bracket, which increased the accuracy of estimation of the QTL allelic effects. Greater negative covariance between effects at both QTL was observed when two QTL were located on the same chromosome compared to different chromosomes. Genetic response with MAS was greater when the QTL were on the same chromosome in the early generations and greater when they were on different chromosomes in the later generations of MAS.
Q
UANTITATIVE trait loci (QTL) are being de- Brascamp et al. 1993; Spelman and Garrick 1997),forestry (e.g.,WilliamsandNeale1992;Strausset al. tected in many species using many different
ex-perimental designs. In outbred livestock populations, 1992), poultry (e.g.,van der Beekandvan Arendonk 1995) and for other situations (e.g.,Landeand Thomp-half-sib experimental designs (Welleret al. 1990) have
son1990; GimfelarbandLande1994a,b;Ruaneand been successfully used to identify QTL (e.g., Georges
Colleau1995, 1996). The theoretical genetic responses
et al. 1995;Spelmanet al. 1996). Similar experimental
from MAS in these studies have varied among studies as designs have also been used successfully for QTL
detec-many different QTL sizes, genetic models, and breeding tion in forest trees (Grattapaglia et al. 1996). In
schemes have been modeled. However, the near unani-other livestock species, such as poultry and pigs, crosses
mous conclusion from these studies is that extra genetic between divergent lines have been used in two and three
responses through use of MAS can be made. Larger generation experimental designs (Andersson et al.
increases in genetic response with MAS are seen for low 1994;van der Beeket al. 1995). Use of QTL detected in
heritability traits (Smith 1967), and for traits where these livestock and forest populations through marker
selection is undertaken before the phenotype is ob-assisted selection (MAS) is still at the theoretical level
served on selection candidates, or the trait is sex limited but will most probably be applied in the near future.
or carcass limited (Meuwissen andGoddard1996). Theoretical evaluation of MAS in breeding schemes
Molecular geneticists are continually developing and has been undertaken starting with the work of
Neimann-applying different methods in trying to get closer to Sorenson and Robertson (1961). Sporadically over
the QTL of interest (GeorgesandAndersson 1996). the next 25 years further papers addressed MAS (e.g.,
From a scientific point of view, this is important and Smith1967;Soller1978;SollerandBeckmann1982;
interesting. However, for the application of MAS in a Smith andSimpson1986;Stam 1986). In the 1990’s,
breeding program the benefits from this extra work there have been many papers evaluating MAS. These
have not been quantified. Smith andSmith (1993) studies have investigated MAS for dairy cattle (e.g.,
advocated the need to have close marker QTL linkages Kashiet al. 1990;Meuwissenandvan Arendonk1992;
in outbred populations (1–2 cM) so that selection could exploit linkage disequilibrium between marker and QTL. However, the benefits of this were not quantified Corresponding author: Richard Spelman, Department of Animal
Sci-and have been questioned by others (e.g. van
Aren-ence, Massey University Private Bag 11222, Palmerston North, New
Zealand. E-mail: [email protected] donket al. 1994a).
is the true polygenic value, and F is the inbreeding coefficient
Genome scans have identified multiple QTL that
af-that was calculated using the algorithm presented by Tier
fect the same trait (e.g., Georges et al. 1995). Plant
(1990). The inbreeding coefficient is the probability that the
breeding programs have not limited themselves to using two genes at any locus in an individual are identical by descent MAS for only one QTL but have selected for many (FalconerandMackay1996, p. 52). Residual components from the distribution N(0, Ve), where Veis the residual variance,
QTL at the same time (Stuber and Edwards 1986).
were sampled for females and added to the previously sampled
However,StuberandEdwards’(1986) MAS selection
polygenic and QTL effects to complete the phenotypic
obser-was solely on marker information and did not account
vations. Phenotypic variance in the base population, that
for the genetic variation not explained by the markers. comprised of V
a1VQTL1Ve, had an expected value of 100,
Livestock and forestry breeding program are also likely and Va1VQTLhad an expected value of 35.
Marker alleles were simulated for all animals in the base
to implement MAS for multiple QTL that affect the
population. It was assumed that the linkage map had six
same trait. To date, the use of more than one QTL in
markers that bracketed the postulated QTL position (Figure
MAS has not been extensively investigated.
1). For the individuals in the base population, marker
geno-The objective of this study is to quantify the effect types were simulated for each of the marker loci assuming of differing sizes of flanking QTL-marker brackets on five alleles with equal frequency. Haldane(1919) mapping function was assumed for the construction of the marker-QTL
genetic response from MAS. In addition, genetic
re-haplotypes transmitted to the offspring.
sponse from two QTL on the same and different
chro-The required number of sires (64) and dams (256) were
mosome(s) is investigated. Furthermore for the two
simulated for the base population and mated to produce the
QTL situation, genetic responses are investigated for first generation. Three generations of selection were under-two QTL of the same size, and also one large QTL and taken without using marker genotypes in the estimation of an
animal’s genetic merit. Polygenic variance decreases while
one small QTL.
selection is undertaken because of induced negative covari-ance between polygenes (Bulmer1971). The level of poly-genic variance stabilizes over time and the three generations MATERIALS AND METHODS of conventional breeding (without markers) were undertaken
to enable this to occur before using MAS. MAS was introduced
Simulation model: A stochastic simulation modeling a
after the three generations of conventional breeding and, closed nucleus breeding scheme with discrete generations
therefore, the MAS genetic responses represent MAS in an (each animal present as parent for only one generation) was
ongoing breeding program. MAS was undertaken for seven developed. The initial generation of animals (termed base
generations in total. The generation number for offspring population) were unselected, unrelated and non-inbred. Each
born from the first application of MAS will be termed genera-generation had 1024 animals with equal numbers of males
tion one in this paper. Therefore the base population is and females. A single trait was simulated with base population
generation24. heritability of 0.35, where heritability is the additive genetic
Breeding value estimation:Breeding value estimation (esti-variance divided by the phenotypic (esti-variance. The additive
mation of genetic merit) of polygenic and marker linked ef-genetic variance was divided between unmarked additive
poly-fects for MAS was undertaken using the model described by genic variation (which will be referred to as polygenic
vari-MeuwissenandGoddard(1996) ance) and variation due to the marked chromosomal region(s)
(which will be referred to as QTL). Phenotypic records were y5Xb1Zu1
o
iZQiqi1e recorded on females only. The highest ranking 12.5% ofwhere y is a vector of phenotypic records, X is an incidence males and 50% of females for estimated genetic merit were
matrix linking fixed effects to records, b is a vector of fixed selected as parents of the next generation. As phenotypes
effects, Z is an incidence matrix that links animals to records, were only available on females, male genetic merit was
esti-uis a vector of polygenic effects, Qi is an incidence matrix
mated from pedigree information (e.g., sire, dam, and
full-linking allelic effects for the ith QTL to animals (every row and half-sib information) and female genetic merit from own
has two elements equal to one and the other elements are performance and pedigree information. Selection of males
zero), qiis a vector of allelic effects for ith QTL, and e is a
and females was undertaken after the single phenotypic record
vector of residual effects. for females was available. Each sire was mated to four females
Mixed model equations (Henderson 1984) are used for (avoiding half-sib and closer matings) and each mating
re-best linear unbiased predictions (BLUP) of b, u, and q (for sulted in four offspring (two male and two female). Each
one QTL) female was mated to one sire only.
QTL alleles for the unselected base population were drawn from the distribution N(0,1⁄2VQTL), where V
QTLis the variance
explained by the QTL. Two QTL variances were used in this
X’X X’Z X’ZQ
Z’X Z’Z1A21l Z’ZQ
Q’Z’X Q’Z’Z Q’Z’ZQ1G21a
bˆ uˆ qˆ 5 X’Y Z’Y Q’Z’Y
study: 5% and 10% of phenotypic variance. The additive genetic variance (polygenic variance plus QTL variance) was
35% throughout the study. The number of QTL alleles in where A215inverse of numerator relationship matrix, l 5
the base population was twice the number of parents selected residual variance/polygenic variance, and G215 inverse of
from this generation. The large number of alleles represents the matrix that describes the relationship between the QTL the situation where the assumed QTL effect is actually due to alleles,a 5residual variance/half the QTL variance a cluster of closely linked QTL. This model is an extension of the methods of Fernando
A polygenic effect for each animal in the base population andGrossman(1989) that was developed for single markers was sampled from the distribution N(0, Va), where Vais the and Goddard’s (1992) method that adapted the previous
polygenic variance. In subsequent generations, the polygenic model for marker haplotypes. component was sampled from the distribution N{1⁄2a
s11⁄2ad, In brief, the computational method for marked-QTL
con-siders that in the base population, the number of QTL alleles
1⁄
mine the genetic benefit for MAS of localizing a QTL to a small chromosomal area. The four distances studied were 15 cM, 10 cM, 5 cM, and 2 cM. Distance to markers outside the flanking QTL-markers was kept constant in all simulations at 5 cM (Figure 1). One hundred and sixty replicates were simulated for both MAS and the control for each scenario investigated.
Two QTL:Two QTL were simulated either on the same or
on different chromosomes. The number of alleles simulated for each QTL was twice the number of base parents. The variances due to QTL were either the same size or one ac-counted for 75% of the QTL variance and the other 25%. The combined variance of the two QTL was either 5% or 10% Figure1.—Marker haplotype that surrounds the postulated
of the phenotypic variance, i.e., the same levels as used for location of the QTL.
the one QTL models. When the two QTL were placed on the same chromosome the distance between the two QTL was 30 cM. Thirty centimorgans was chosen as this distance is is equal to twice the number of base animals. In the next
the approximate level of resolution that one can identify two generation, the transmission of the parental QTL alleles is
separate QTL in current livestock QTL experiments (Haley followed by inference on the marker haplotype. When
trans-andKnott1992). The flanking QTL-marker distance was 5 mission of marker haplotype can be followed, the Q matrix
cM in all cases. QTL allelic effects were estimated separately links the progeny’s phenotype to the transmitted parental
for both QTL by extending the MA-BLUP model. Negative QTL allelic effect. When it is uncertain which QTL allele
covariance generated by selection, between the two QTL, and was transmitted, a new QTL allelic effect is formed in the
also between the polygenic and QTL components was evalu-evaluation procedure. The progeny’s phenotype is linked via
ated. The negative covariance between the two QTL was the Q matrix to the new QTL allelic effect and the new QTL
calculated as half of the difference between total QTL variance allelic effect is linked to its parents through the G matrix i.e.,
less the sum of the two individual QTL variances. The negative the expectation of the new QTL allelic effect is equal to the
covariance between the QTL component and polygenic com-mean of the parental QTL allelic effects.
ponent was calculated each generation as half of the difference The evaluation model does not assume that the exact
loca-between total additive genetic variance less the sum of the tion of the QTL within a marker bracket is known, but
postu-QTL variance and polygenic variance. lates that it is within the marker bracket. Probability
state-The control for the two QTL scenarios was conventional ments are either that QTL transmission can be followed by
selection on the genetic model of polygenic variance and inference on the marker haplotype, or it cannot. Thus
proba-variance at two QTL. One hundred and sixty replicates were bility statements, other than 0 or 1, are not made about
trans-simulated for both MAS and the control for each scenario mission based on recombination events between flanking
investigated. markers (double recombination) and postulated position
rela-tive to single markers (for further description of model see MeuwissenandGoddard, 1996). The described MAS
breed-RESULTS ing value estimation method will be referred to as MA-BLUP
for the rest of the paper. Genetic gain with base model: The rate of genetic If the origin of the marker allele could not be established
gain for the breeding scheme modeled for a trait of
at the closest flanking markers around the postulated QTL,
35% heritability, which consisted solely of polygenic
based on parental and offspring marker genotypes, then the
next informative marker in the haplotype was used. If allele variance, was close to 0.3sPper generation. Equilibrium
origin could not be determined for at least one side of the response with this model was reached after three to four marker haplotype, QTL transmission could not be determined generations of conventional BLUP selection, confirm-according to the rules ofMeuwissenandGoddard(1996).
ing that three generations of conventional breeding was
Also, if a recombination was observed between markers, QTL
sufficient to mimic the introduction of MAS into an
transmission could not be determined.
From generation23, conventional mixed model equations ongoing breeding scheme.
(marker information not used) (Henderson1984) were used Flanking QTL-marker size:The smaller the flanking to estimate b and u. After three generations of conventional QTL-marker bracket the greater the cumulative superi-selection, MAS was undertaken, using marker information
ority of MAS over the control (Tables 1 and 2). The
and phenotypic observations, from generation zero with the
5-cM bracket had, on average, 90% and 85% of the
aforementioned MA-BLUP model. Markers were available on
all animals. As a control, conventional selection was also genetic superiority of MAS (over the control), which
continued for seven generations from generation zero. The was achieved with the 2-cM bracket for the 5% and additive genetic variance used in solving the mixed model 10% QTL, respectively. The 10-cM bracket achieved an equations for situations without MAS was the sum of polygenic
average genetic response of some 80% relative to that
variation and QTL variation in the base population.
of the 2-cM bracket for both sized QTL (results not
Estimates on polygenic and QTL effects were obtained using
iteration of the data (SchaefferandKennedy1986). Itera- shown). For the 5% QTL and 15-cM bracket, the MAS tions were continued until solutions were stable, i.e., when superiority was quite variable, relative to the 2-cM convergence criterion, which equals the sum of squares of bracket (Table 1) and lower than that of the 10% QTL differences in solutions between iterations divided by the sum
(Tables 1 and 2). The relative superiority of the 5%
of squares of the most recent solutions, was less than 10210.
QTL for the 15-cM bracket is similar to that of the
20-Differing flanking marker-QTL size:The size of the interval
TABLE 1
Effect of differing flanking QTL-marker bracket size on cumulative superiority of MAS over the control for a QTL that explains 5% of phenotypic variance (sP)
Flanking marker bracket size
2 cM 5 cM 15 cM
Generation QTL Polygenic QTL Polygenic Percent QTL Polygenic Percent
1 0.049 20.026 0.046 20.024 96 0.036 20.021 70
2 0.090 20.055 0.088 20.053 95 0.068 20.051 45
3 0.135 20.081 0.131 20.085 85 0.099 20.079 36
4 0.166 20.095 0.158 20.097 83 0.122 20.091 43
5 0.194 20.110 0.182 20.111 85 0.143 20.104 46
6 0.208 20.117 0.192 20.106 95 0.154 20.105 54
7 0.212 20.122 0.195 20.112 92 0.160 20.115 49
Cumulative overall genetic superiority for the 5 cM and 15 cM QTL-marker brackets is presented as percentage of that achieved with the 2 cM bracket.
Standard errors for the QTL component are 0.003 (generation 1), 0.007 (generation 4) and 0.010 (generation 7). Standard errors for the polygenic component are 0.002 (generation 1), 0.010 (generation 4) and 0.014 (generation 7).
The difference in relative response of the 15-cM duce accuracy a little. This was observed with the reduc-tion in QTL accuracy decreasing more for the 5% QTL bracket to the 2-cM bracket between the 5% and 10%
QTL, after generation one, may reflect that the value than the 10% QTL when going from a 10-cM to a 15-cM bracket (not shown).
of phenotypes is a curvilinear function, i.e., the first
phenotypes per QTL allelic effect have a larger effect The source of the extra genetic gain with the smaller marker brackets was from extra gain made at the QTL on accuracy than the additional ones. The number of
phenotypes needed per QTL allelic effect to get a cer- when moving from a 15-cM bracket to a 5-cM bracket for the 5% and 10% QTL (Tables 1 and 2). Moving tain accuracy will be larger for the 5% QTL than the 10%
QTL, since the 5% QTL explains less of the phenotypic from a 5-cM to a 2-cM bracket, for the 10% QTL, the increase in overall genetic gain was from extra QTL variance. Thus, for the 5% QTL, the 15-cM flanking
QTL-marker bracket may move the accuracy of QTL response in the first two generations. In the next three generations the extra gain was from both QTL and estimation off the plateau-like level of the curvilinear
slope. However, for the 10% QTL, the reduction in polygenic and in the last two generations it came from a reduction in polygenic loss (Table 2). For the 5% number of phenotypes per allelic effect when going
from a 10-cM bracket to a 15-cM bracket may only re- QTL the extra genetic gain from going from a 5-cM
TABLE 2
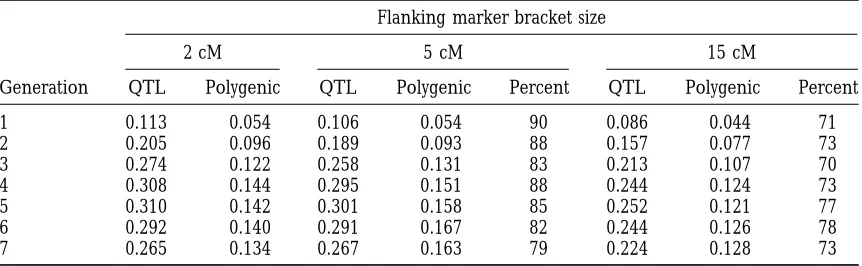
Effect of differing flanking QTL-marker bracket size on cumulative superiority of MAS over the control for a QTL that explains 10% of phenotypic variance (sP)
Flanking marker bracket size
2 cM 5 cM 15 cM
Generation QTL Polygenic QTL Polygenic Percent QTL Polygenic Percent
1 0.113 20.054 0.106 20.054 90 0.086 20.044 71
2 0.205 20.096 0.189 20.093 88 0.157 20.077 73
3 0.274 20.122 0.258 20.131 83 0.213 20.107 70
4 0.308 20.144 0.295 20.151 88 0.244 20.124 73
5 0.310 20.142 0.301 20.158 85 0.252 20.121 77
6 0.292 20.140 0.291 20.167 82 0.244 20.126 78
7 0.265 20.134 0.267 20.163 79 0.224 20.128 73
Cumulative overall genetic superiority for the 5 cM and 15 cM QTL-marker brackets is presented as percentage of that achieved with the 2 cM bracket.
TABLE 3 tions of MAS, the correlation decreased as the ability to follow QTL transmission decreased and, therefore,
Effect of flanking QTL-marker bracket size on the ability
new QTL allelic effects were formed in the evaluation
to determine parental origin of QTL allele based on
method. The new allelic effects were allocated the
aver-marker genotypes for 5% QTL (%)
age of the parental effects that resulted in lower
accu-Generation 15 cM 10 cM 5 cM 2 cM racy.
For the 10% QTL, the BLUP evaluation method was
0 82 86 90 92
slightly biased in the later generations and genetic gain
1 81 85 89 91
at the QTL was overestimated. This is probably due to
2 79 82 86 88
the decrease in QTL variation through changes in allele
3 77 79 82 85
4 75 76 78 80 frequencies, which violates the assumptions of the model.
5 71 73 73 75 Maki-Tanila and Kennedy (1986) commented that
6 68 68 69 70 this type of bias can occur when fixation or, equivalently,
7 65 66 64 66
a selection limit is reached. Accuracy of polygenic esti-mates increased slightly as the QTL-marker bracket size decreased. This may be because of the greater accuracy of estimated QTL allelic effects. When estimating the bracket to a 2-cM bracket came from primarily an
in-polygenic value, the phenotype is adjusted for the fixed crease in QTL response with polygenic loss staying stable
effect and the QTL allelic effects. With greater accuracy (Table 1).
for QTL effects, the phenotype will be adjusted more
Ability to follow transmission of QTL: The ability to
unam-correctly, resulting in more accurate estimate of poly-biguously follow QTL transmission from parent to
off-genic value. spring based on marker haplotype decreased over
gen-Two QTL:For the two QTL that together explained erations (Table 3). The size of the flanking QTL-marker
10% of the phenotypic variance, the genetic response bracket affected the ability to follow QTL transmission
was similar regardless of the relative size of the two QTL in the first four to five generations of MAS but after
(Table 5). In the early generations of MAS, the genetic seven generations there were only minor differences
response with MAS was greater when the two QTL were (Table 3). Reduction in ability to follow QTL
transmis-located on the same chromosome than when they were sion was greater for the 10% QTL compared to the
on different chromosomes. In the later generations, 5% QTL due to greater QTL selection pressure and
the rate of genetic gain when the two QTL were on the therefore faster fixation (results not shown).
same chromosome was less than when they were on
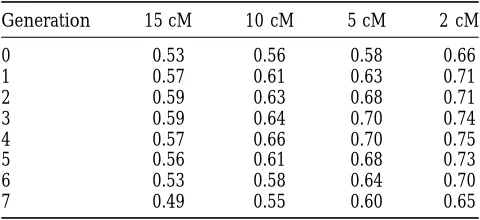
Correlation of estimated and true QTL effects: The smaller
different chromosomes. Comparing the two QTL that the flanking QTL-marker bracket the higher the
corre-had a cumulative variance of 10% to one 10% QTL, the lation between estimated and true QTL effects for the
genetic superiority over no MAS was nearly the same 5% QTL (Table 4). This was also observed for the 10%
for the first five generations. In the last two generations, QTL where the correlation between estimated effects
the two QTL model had greater superiority over the and true effects was higher than that for the 5% QTL
control compared to the one QTL model. This was (results not presented). The correlation increased in
due to there being more QTL variance for the two QTL the first three to four generations of MAS as more
infor-genetic model in the later generations compared to the mation (phenotypes) accumulated for the estimation
single 10% QTL. of QTL allelic effects. In the last three to four
genera-For the 5% QTL, the relative size of the two QTL had an effect on the percentage superiority of MAS
TABLE 4 over the control (Table 5). Having two QTL that were
unequal in size resulted in lower percentage superiority
Effect of flanking QTL-marker bracket size on the
in the later generations than that achieved with QTL
average correlation between estimated allelic effects
and true effects for a QTL that explains 5% of the of equal size. The lower response for the unequal QTL
phenotypic variance size for the 5% QTL was due to the size of the smaller
QTL explaining only 1.25% of the phenotypic variance.
Generation 15 cM 10 cM 5 cM 2 cM MAS with a single QTL of this size (1.25%) was not
superior to that without MAS (results not shown) as
0 0.53 0.56 0.58 0.66
the accuracy of the QTL allelic effects was low for the
1 0.57 0.61 0.63 0.71
2 0.59 0.63 0.68 0.71 breeding scheme structure simulated.
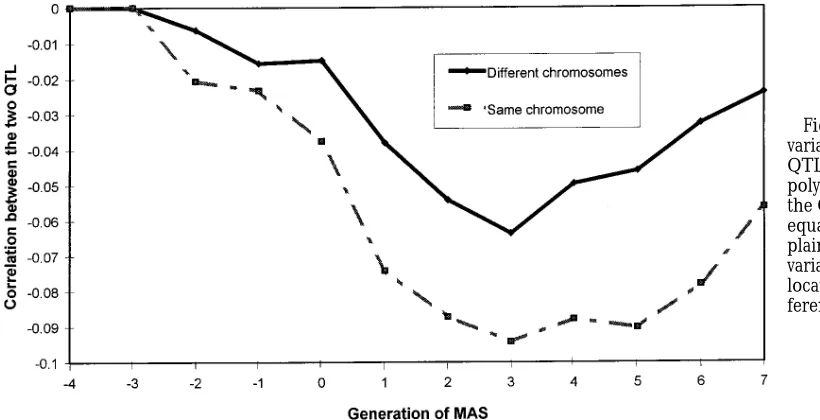
3 0.59 0.64 0.70 0.74 When the two QTL were positioned on the same
4 0.57 0.66 0.70 0.75 chromosome, the level of negative covariance between
5 0.56 0.61 0.68 0.73 the two QTL was greater than when the QTL were on
6 0.53 0.58 0.64 0.70
different chromosomes (Figure 2). The negative
covari-7 0.49 0.55 0.60 0.65
intro-TABLE 5
Cumulative percentage difference in genetic responses between MAS and non-MAS breeding programs with two QTL that explain 5% and 10% of phenotypic variance
5% 10%
One Same Different Same Different One Same Different Same Different Generation QTL equal equal equal unequal QTL equal equal unequal unequal
1 7.1 6.0 4.9 5.5 5.3 15.3 16.8 14.4 14.9 16.2
2 5.4 5.9 5.7 5.0 5.6 14.4 13.8 12.8 15.0 14.7
3 4.8 5.6 6.1 4.9 5.4 13.1 12.5 11.6 13.7 13.3
4 4.8 5.7 6.3 4.8 5.2 10.7 11.5 12.0 11.3 12.3
5 4.5 5.5 5.8 4.3 4.8 8.6 10.3 11.3 10.0 11.3
6 4.7 5.3 5.6 4.1 4.8 6.6 9.8 10.9 8.3 9.5
7 3.9 5.0 5.3 4.0 4.4 5.0 8.2 9.4 7.2 8.4
Same5two QTL positioned on the same chromosome; Different5two QTL positioned on the different chromosome; Equal5 two QTL explain the same amount of phenotypic variance; Unequal5one QTL explains more of the phenotypic variance than the other QTL.
Standard errors are 1.1% for generation 1, 0.7% for generation 4 and 0.5% for generation 7 for the 5% QTL and 1.3% for generation 1, 0.9% for generation 4 and 0.7% for generation 7 for the 10% QTL.
duction of MAS. With the introduction of MAS, the generations. For the 10% QTL, the QTL variance in generation four was comprised of 66% from the larger level of negative covariance between the QTL increased
and the negative covariance remained at a higher level QTL and 34% from the smaller, and by generation seven it was 50:50. For the 5% QTL, the QTL variance when the two QTL were on the same chromosome.
When one QTL comprised 75% of the QTL variance in generation seven was comprised of 60% from the larger QTL and 40% from the smaller QTL. In com-and the other 25%, the level of negative covariance was
less than that observed for two QTL of equal size (not parison, the level of variance contributed in the con-trol was some 70:30 after seven generations for both shown). The level of negative covariance between the
polygenic component and the QTL component was not sized QTL. affected by the relative location of the two QTL nor
relative size (not shown). The same trends were
ob-DISCUSSION AND CONCLUSIONS
served for two QTL that had a cumulative variance
of 5%. Negative covariance between two QTL was
main-tained at a higher level when the two QTL were on the When the two QTL were of unequal size (75% and
25%), greater selection response was made at the larger same chromosome in contrast to being on different chromosomes. This is to be expected as the decay of QTL, as was expected. The level of contribution to
the QTL variance from the two QTL changed over the negative covariance is slowed by linkage (Bulmer1971).
That is, the unfavorable linkages between QTL alleles other MAS evaluation methods proposed. This is due to the model in this study requiring that the marker can only be broken by recombination when the QTL
are on the same chromosome. It is interesting to note haplotype is informative on both sides of the QTL loca-tion. Other methods (FernandoandGrossman1989; that the genetic response was higher in the early
genera-tions of MAS for the situation where the two QTL were van Arendonk et al. 1994b; Wang et al. 1995) make probability statements about QTL transmission from on the same chromosome despite the higher negative
covariance. In the later generations, the genetic re- single markers. Therefore, when markers on one side of the haplotype could not be followed, probability state-sponse was greater when the QTL were situated on
differing chromosomes, which would be expected. The ments about QTL transmission would be made from a single marker rather than forming a new QTL effect. level of negative covariance is affected by population
size, selection intensity and mating structure (Weirand Making the probability statements from one side of the haplotype requires an estimate of the QTL location Hill 1980). Therefore, the results presented on the
effect of negative covariance may alter for different within the QTL-flanking marker bracket. However, by simulating relatively informative markers and three breeding scheme structures.
The accuracy of allelic effect estimates was reasonably marker loci on each side of the QTL, the effect of noninformity has been reduced in this study.
high at the start of MAS (Table 4). This was because of
marker genotypes being present on all five generations In the MA-BLUP method that was used in this study, a shortcoming was when the two QTL effects for a parent prior to the start of MAS. When MAS started with
fewer previous generations of marker genotypes and were the same and QTL transmission from the marker haplotype could not be followed. In this situation, a phenotypes the genetic response to MAS was reduced
(Meuwissen and Goddard 1996; Spelman and van new QTL effect was formed in MA-BLUP for the off-spring. An improvement would be to identify via the Arendonk 1997) as the accuracy of estimated allelic
effects was lower. Increasing the accuracy of QTL allelic evaluation method if two QTL effects were presumed to be the same in a parent and offspring of this parent effects can also be achieved by genotyping and
pheno-typing more full and half-sibs. This may be important get allocated this QTL effect in the Q matrix regardless of the marker haplotype information. This may have for QTL that only explain a small percentage of the
variance, as the breeding structure simulated in this improved the accuracy of estimation of QTL effects in later generations.
study did not have enough observations to accurately
estimate QTL effects and use them successfully via MAS EdwardsandPage(1994) showed through simula-tion that the benefits for MAS when using flanking for a QTL that explained 1.25% of phenotypic variance.
Therefore, breeding schemes may have different opti- markers instead of single markers was 11% for markers close to the QTL and 38% for markers loosely linked mal sizes for QTL of differing variances. This will also
depend on how many previous generations of pheno- to the QTL. This study has demonstrated and quantified that getting closer to the QTL and having smaller flank-types and genoflank-types are available. Therefore, for a
given breeding scheme, you may decide not to select ing QTL-marker brackets further increases the genetic response from MAS. The close flanking markers used for a QTL below a certain size.
The greater accuracy in estimation of QTL effects in this study for MAS are different from the MAS scheme outlined by Meuwissen and van Arendonk (1992). with the smaller flanking brackets resulted in greater
gain at the QTL when reducing bracket size from 15 Those authors had only two markers on each chromo-some forming the marker haplotype for estimation of cM to 10 cM and subsequently to 5 cM as would be
expected. However, the greater polygenic response, QTL effects. As shown by this study, MAS schemes or equivalently, the reduction in polygenic loss when will benefit genetically from getting closer to the QTL reducing the bracket from 5 cM to 2 cM for the 10% or chromosomal segment. The improved genetic re-QTL, was not expected. In the last two generations the sponses should be balanced against the costs of achiev-greater response from the smaller bracket was solely ing it, particularly as the amount of work and cost re-from the polygenic component. The polygenic re- quired to get another centimorgan closer is invariably sponse may be due to the QTL allele being more accu- more than it was for the previous centimorgan. rately estimated in the 2-cM bracket situation and, there- The authors acknowledge the helpful comments of Johan van fore, the adjustment of phenotype in estimation of Arendonkin the preparation of this manuscript. R. J. Spelman
thanks Livestock Improvement Corporation for financial support. polygenic value is more correct. In the last two
genera-tions, when one QTL may be predominant, the same QTL allele may be selected for both bracket sizes but
it is selected in animals with better polygenic value for LITERATURE CITED
the 2-cM bracket situation.
Andersson, L., C. S.Haley, H.Ellegren, S. A.Knott, M.Johansson
The genetic evaluation system used in this study
et al., 1994 Genetic mapping of quantitative trait loci for growth (MeuwissenandGoddard1996), may be slightly more
and fatness in pigs. Science 263: 1771–1774.
Brascamp, E. W., J. A. M.van Arendonkand A. F.Groen, 1993
Economic appraisal of the utilization of genetic markers in dairy gress on Genetics applied to Livestock Production, Lincoln, NE, XII:382–393.
cattle breeding. J. Dairy Sci. 76: 1204–1213.
Smith, C., 1967 Improvement of metric traits through specific ge-Bulmer, M. G., 1971 The effect of selection on genetic variability.
netic loci. Anim. Prod. 9: 349–358. Am. Nat. 165(943): 201–211.
Smith, C., and S. P.Simpson, 1986 The use of genetic polymorphism Edwards, M. D.,andN. J. Page,1994 Evaluation of marker-assisted
in livestock improvement. J. Anim. Breeding and Genet. 103: selection through computer simulation. Theor. Appl. Genet. 88:
205–217. 376–382.
Smith, C., and D. B.Smith, 1993 The need for close linkages in Falconer, D. S.,andT. F. C. Mackay,1996 Introduction to
Quantita-marker assisted selection for economic merit in livestock. Anim.
tive Genetics, Fourth edition, Longman Group Ltd., Essex.
Breeding Abstr. 61,4: 197–204.
Fernando, R. L., and M.Grossman, 1989 Marker-assisted selection
Soller, M., 1978 The use of loci associated with quantitative effects
using best linear unbiased prediction. Genet. Sel. Evol. 21: 467–
in dairy cattle improvement. Anim. Prod. 27: 133–139. 477.
Soller, M., and J. S.Beckmann, 1982 Restriction fragment polymor-Georges, M.,andL. Andersson,1996 Livestock genomics comes
phisms and genetic improvement. Proceedings of the 2nd World of age. Genome Res. 6: 907–921.
Congress on Genetics applied to Livestock Production, Madrid,
Georges,M., D.Nielsen, M.Mackinnon, A.Mishra, R.Okimoto
Spain, VI: 396–404.
et al., 1995 Mapping quantitative trait loci controlling milk
pro-Spelman, R. J., W.Coppieters, L.Karim, J. A. M.van Arendonk
duction in dairy cattle by exploiting progeny testing. Genetics and H.Bovenhuis, 1996 Quantitative trait loci analysis for five
139:907–920. milk production traits on chromosome six in the Dutch
Holstein-Gimfelarb, A.,andR. Lande, 1994a Simulation of marker assisted
Friesian population. Genetics 144: 1799–1808.
selection in hybrid populations. Genet. Res. 63: 39–47. Spelman, R. J., and D. JGarrick, 1997 Utilisation of Marker Assisted Gimfelarb, A.,andR. Lande, 1994b Simulation of marker assisted Selection in a commercial dairy cow population. Livestock Prod.
selection for non-additive traits. Genet. Res. 64: 127–136. Sci. 47: 139–147.
Goddard, M. E., 1992 A mixed model for analyses of data on multi- Spelman, R. J., and J. A. M.van Arendonk, 1997 Effect of inaccurate
ple genetic markers. Theor. Appl. Genet. 83: 878–886. parameter estimates on genetic response to marker assisted
selec-Grattapaglia, D., F. L. G.Bertolucci, R.Pencheland R. R.Se- tion in an outbred population. J. Dairy Sci. 80: 3399–3410. deroff, 1996 Genetic mapping of quantitative trait loci con- Stam, P., 1986 The use of marker loci in selection for quantitative
characters, p. 70. in Exploiting New Technologies in Animal Breeding— trolling growth and wood quality traits in Eucalyptus grandis using
Genetic Developments, edited by J. W. B. King and J. C. McKay.
a maternal half-sib family and RAPD markers. Genetics 144:
Oxford University Press, New York. 1205–1214.
Strauss, S. H., R.Landeand G.Namkoong, 1992 Limitations of Haldane,J. B. S., 1919 The combination of linkage values and the
molecular-marker aided selection in forest tree breeding. Can. calculation of distances between the loci of linked factors. J.
J. For. Res. 22: 1050–1061. Genet. 2: 3–19.
StuberC. W., and M. D.Edwards, 1986 Genotypic selection for Haley,C. S., and S. A.Knott, 1992 A simple regression method
improvement of quantitative traits in corn using molecular for mapping quantitative trait loci in line crosses using flanking
marker loci. Proc. 41st Annual Corn and Sorghum Research markers. Heredity 69: 315–324.
Conference, Am. Seed Trade Assoc. 41: 70–83.
Henderson, C. R., 1984 Applications of linear models in animal
Tier, B., 1990 Computing inbreeding coefficients quickly. Genet.
breeding. Can. Catal. Publ. Data, University Guelph, Guelph,
Sel. Evol. 22: 419–430. Ontario, Canada.
van Arendonk, J. A. M., H. Bovenhuis, S. van der BeekandA. F. Kashi, Y., E.Hallermanand M.Soller, 1990 Marker assisted
selec-Groen,1994 Detection and exploitation of markers linked to
tion of candidate bulls for progeny testing programmes. Anim. quantitative traits in farm animals. Proceedings of the Fifth World
Prod. 51: 63–74. Congress on Genetics Applied to Livestock Production. The
Con-Lande, R., and R.Thompson,1990 Efficiency of marker assisted gress, Guelph, XXI: 193–200.
selection in the improvement of quantitative traits. Genetics 124: van Arendonk, J. A. M., B.Tier, and B. P.Kinghorn, 1994 Use
743–756. of multiple genetic markers in prediction of breeding values.
Maki-Tanila, A., and B. W.Kennedy, 1986 Mixed model methodol- Genetics 137: 319–329.
ogy under genetic models with a small number of additive and van der Beek, S., and J. A. M.van Arendonk, 1995 Marker assisted
non-additive loci. Proceedings of the 3rd World Congress on selection in an outbred poultry breeding nucleus. Anim. Sci. 62: Genetics applied to Livestock Production, Lincoln, NE, XII: 443– 171–180.
van der Beek, S., J. A. M.van Arendonkand A. F.Groen, 1995
448.
Power of two- and three-generation QTL mapping experiments
Meuwissen, T. H. E., and M. E.Goddard, 1996 The use of marker
in an outbred population containing full-sib or half-sib families. haplotypes in animal breeding schemes. Genet. Sel. Evol. 28:
Theor. Appl. Genet. 91: 1115–1124. 161–176.
Wang, T., R. L. Fernando, S. van derBeek, M. Grossman and Meuwissen, T. H. E., and J. A. M.van Arendonk, 1992 Potential
J. A. M.van Arendonk, 1995 Covariance between relatives for
improvements in rate of genetic gain from marker assisted
selec-a mselec-arked quselec-antitselec-ative trselec-ait locus. Genet. Sel. Evol. 27: 251–274. tion in dairy cattle breeding schemes. J. Dairy Sci. 75:1651–1659.
Weir, B. S., and W. G.Hill, 1980 Effect of mating structure on Neimann-Sorenson, A.,and A.Robertson,1961 The association
variation in linkage disequilibrium. Genetics 95: 477–488. between blood groups and several production characteristics in
Weller, J. L., Y.Kashiand M.Soller, 1990 Power of daughter and
three Danish cattle breeds. Acta Agric. Scan. 11: 163–196.
granddaughter designs for determining linkage between marker
Ruane, J., and J. J.Colleau, 1995 Marker assisted selection for
loci and quantitative trait loci in dairy cattle. J. Dairy Sci. 73: genetic improvement of animal populations when a single QTL
2525–2537.
is marked. Genet. Res. 66: 71–83. Williams, C. G., and D. B.Neale, 1992 Conifer wood quality and Ruane, J., and J. J.Colleau, 1996 Marker -assisted selection for a
marker-aided selection: a case study. Can. J. For. Res. 22: 1009– sex-limited character in a nucleus breeding population. J. Dairy 1017.
Sci. 79: 1666–1678.
Schaeffer, L. R., and B. W.Kennedy, 1986 Computing solutions Communicating editor:B. S. Weir