ABSTRACT
COLLINS, TRACY MICHELLE. Technology Diffusion, Learning from Imitation, and Growth. (Under the direction of John Seater).
The empirical evidence clearly shows that some former developing countries have learned how to innovate, but no theoretical model has adequately been able to explain this phenomenon until now. When I incorporate a learning to innovate effect into a traditional product variety model, I find that there are three possible steady state results. A country can either become a perpetual innovator, it can become a perpetual imitator, or it can converge to a steady state where it does a combination of both. The tractability of the model allows me to provide analytical solutions for the growth rate and TFP of each steady state, and the predicted solutions for growth and TFP are consistent with empirical results. I find that if a country can transition from imitating to innovating, it will have a higher growth rate and higher TFP. I also investigate the effect that government policy can have on growth and TFP and conclude that subsidies to R&D can increase both. I also conclude that subsidies to education and health are welfare improving.
Technology Diffusion, Learning from Imitation, and Growth
by
Tracy Michelle Collins
A dissertation submitted to the Graduate Faculty of North Carolina State University
in partial fulfillment of the requirements for the degree of
Doctor of Philosophy
Economics
Raleigh, North Carolina 2012
APPROVED BY:
_______________________________ ______________________________
John Seater Ivan Kandilov
Committee Chair
________________________________ ________________________________
DEDICATION
BIOGRAPHY
ACKNOWLEDGMENTS
I extend my deepest gratitude to my parents, family and Bible study groups. Thank you, thank you, and thank you!!! I could not have gotten through the grueling demands of writing a dissertation without your love, support, encouragement, and constant prayers.
I especially would like to thank my advisor, John Seater, without whom this dissertation would not have been possible. Thank you for believing in me and my research. Thank you for your guidance. Thank you for your dedication, and thank you for helping me whenever I needed it. Thank you Asli Leblebicioğlu for teaching me the foundations of growth models and providing me with advice on how to improve my research. Thank you Pietro Peretto for your feedback, wealth of knowledge, and expertise. I would like to extend a very special thank you to Ivan Kandilov, who has provided immeasurable support for this dissertation.
TABLE OF CONTENTS
List of Tables ... ix
List of Figures ... x
Chapter 1 Technology Diffusion: A Catalyst for Innovation and Endogenous Growth ... 1
1.1 Introduction ... 1
1.2 Background and Previous Literature ... 3
1.3 The Model ... 13
1.3.1 Overview and Important Assumptions ... 13
1.3.2 Households in Country B ... 17
1.3.3 Production and Market Entry in Country B ... 20
1.3.4 Value of the Firm and Free Entry ... 27
1.3.5 The Rate of Return to R&D ... 27
1.4 Aggregate Dynamics ... 29
1.4.1 The Investment Decision ... 29
1.4.2 The Evolution of β ... 32
1.5 General Equilibrium Results ... 35
1.5.1 Steady State Results: Regime 1 ... 36
1.5.2 Steady State Results: Regime 2 ... 42
1.5.1 Steady State Results: Regime 3 ... 45
1.7 Conclusion ... 50
Chapter 2 Government Intervention in the Economy ... 53
2.1 Introduction ... 53
2.2 Intervention in the Education (Health) Sector of the Economy ... 54
2.2.1 Regime 1 Results with Government Intervention ... 56
2.2.2 Regime 2 and 3 Results with Government Intervention ... 61
2.3 Pareto Optimality and Government Intervention ... 63
2.4 Pareto Optimal Results vs. the Decentralized Results ... 65
2.4.1 Regimes 1 and 3 ... 71
2.4.2 Regime 2 ... 71
2.5 Government Intervention ... 73
2.5.1 Subsidies to R&D ... 74
2.5.1 Subsidies to Manufacturing ... 76
2.5.1 Subsidies to Education and Health ... 77
2.6 Conclusion ... 79
Chapter 3 The Impact of Trade Liberalization on Technology Diffusion ... 82
3.1 Introduction ... 82
3.2 Background and Previous Literature ... 85
3.5.1 Estimation Model ... 96
3.5.2 Summary Statistics ... 98
3.5.3 Estimation Strategy ... 104
3.5.4 Diagnostic Tests ... 105
3.6 Estimation Results ... 107
3.6.1 Estimation Results: All Firms ... 107
3.6.2 Estimation Results: Heterogeneity Across Firms ... 113
3.7 Conclusion ... 121
Bibliography ... 126
Appendices ... 136
Appendix A Appendix to Chapter 1 ... 137
A.1 Overview of the Model ... 137
A.1.1 Calculating the Optimal Aggregate Demand of Intermediate Goods .... 137
A.1.2 Calculating the Cost of Entry ... 138
A.1.3 Calculating the Optimal Price that Maximizes Profit ... 139
A.1.4 The Rate of Return to Imitation and Innovation and the Investment Decision ... 139
A.2 General Equilibrium Results ... 140
A.2.1 Steady State Growth Rates ... 140
Appendix B Appendix to Chapter 2 ... 142
B.1.1 Optimal Output ... 142
B.2 Government Intervention ... 144
B.2.1 Subsidies to R&D ... 144
B.2.2 Subsidies to Manufacturing ... 146
B.2.3 Optimal Subsidies ... 147
LIST OF TABLES
Table 1.1 Patents Granted to Residents: Rank per Country ... 7
Table 1.2 Conditions for Each Regime ... 31
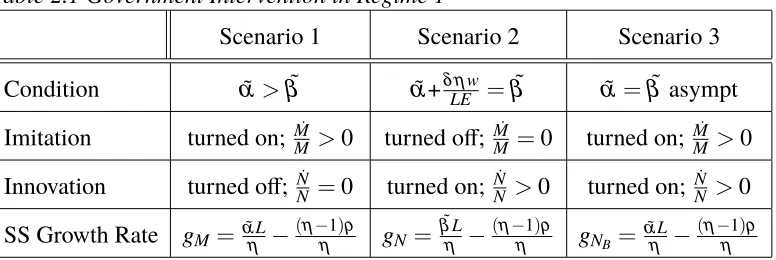
Table 2.1 Government Intervention in Regime 1 ... 55
Table 3.1 Tariff and License Coverage Rates ... 91
Table 3.2 Summary Statistics: All Firms ... 97
Table 3.3 Summary Statistics: Large Firms ... 98
Table 3.4 Summary Statistics: Medium Firms ... 99
Table 3.5 Summary Statistics: Small Firms ... 100
Table 3.6 Estimation Results: All Firms ... 105
Table 3.7 Estimation Results: Large Firms ... 113
Table 3.8 Estimation Results: Medium Firms ... 114
LIST OF FIGURES
Figure 1.1 The Evolution of the Number of Patents Granted to Residents from
1995-2009 in Japan, the USA, China, South Korea, and Taiwan ... 9
Figure 1.2 The Evolution of the Number of Patents Granted to Residents from 1995-2009 in Singapore, Malaysia, and Thailand ... 9
Figure 1.3 The Evolution of the Number of Articles Published in Scientific Journals from Researchers in Japan, the USA, China, South Korea, and Taiwan ... 10
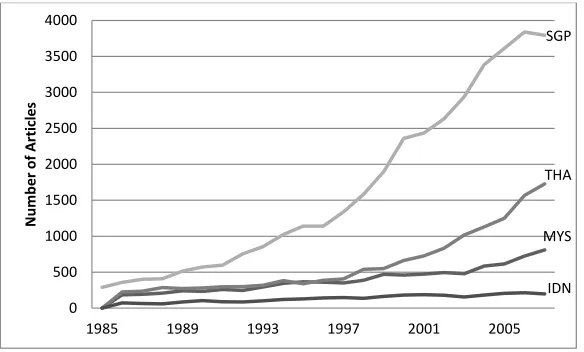
Figure 1.4 The Evolution of the Number of Articles Published in Scientific Journals from Researchers in Singapore, Thailand, Malaysia, and Indonesia ... 10
Figure 1.5 Regime 1 Dynamics ... 31
Figure 1.6 Regime 2 Dynamics ... 32
Figure 1.7 Regime 3 Dynamics ... 32
Figure 1.8 General Equilibrium Dynamics ... 37
Figure 1.9 General Equilibrium Dynamics ... 43
Figure 2.1 General Equilibrium Dynamics ... 56
Figure 2.2 General Equilibrium Dynamics ... 58
Figure 2.3 General Equilibrium Dynamics ... 61
Figure 2.4 General Equilibrium Dynamics ... 61
Figure 2.5 Decentralized Result vs. the Pareto Optimal Result ... 66
Chapter 1
Technology Diffusion: A Catalyst for Innovation
and Endogenous Growth
1.1
Introduction
The empirical evidence clearly shows that some former developing countries have
transi-tioned from reverse engineering and imitating products to inventing new products. While
the transition from imitation to innovation has been addressed at the microeconomic level
and researched substantially by development and industrial organization (IO) economists, no
previous endogenous growth theory has adequately addressed this phenomenon. This
chap-ter of my dissertation expands the theory of technology diffusion and endogenous growth by
showing how imitation can be a catalyst for innovation in developing countries because of a
process of learning to innovate.1It explains how workers in a developing country learn how
to innovate and develop new products after they reverse engineer a more developed
coun-try’s products. It also explains why some developing countries can transition from imitating
products to inventing new products, while other countries can not.
1Throughout this chapter, learning to learn and learning to innovate are used interchangeably and refer to
The model I develop is based on the traditional Grossman and Helpman (G-H)
vari-ety expansion model. I extend their model to include a learning to innovate effect that
increases the efficiency level of R&D workers in the innovative sector of the economy. My
research incorporates the current notion that the opportunity to copy an advanced country’s
products and its embedded technology actually helps workers in less developed countries
acquire skills that will allow them to become more productive at innovating and creating
new products. This is a new strand of thought in the diffusion of technology literature at
the macroeconomic level, and while similar to learning by doing, the two concepts are not
identical.
Michelle Connolly and Diego Valderrama explain the difference as follows: “learning
to learn differs from the more common notion of learning by doing in that the skills gained
are applicable to different types of research as opposed to being limited to the exact task
in which the learning occurs2.” They further explain the process of learning to innovate
by using the analogy of students in graduate school. When graduate students first begin
graduate school, they imitate and dissect existing knowledge in their respective fields. Once
students acquire knowledge that has already been disseminated, they can then invent new
knowledge by conducting their own research i.e. the students have learned how to innovate.
When I incorporate a learning to innovate effect in the G-H model, I find that a
develop-ing country can transition from imitatdevelop-ing an advanced country’s products to inventdevelop-ing new
products. This transition occurs if the productivity of researchers, who invent new products,
of return to innovation becomes greater than the rate of return to imitation, then firms only
invest in inventing new products in the steady state. Contrary to the G-H model, with
learn-ing to innovate, there are three possible steady states: a country can become a perpetual
innovator, it can become a perpetual imitator, or it can converge to a steady state where it
does both.
The most important contribution this chapter of my dissertation makes to the literature
is that it presents a variety expansion model that has an endogenous process for learning
to innovate that is dynamic and not mechanical. The model can explain how a developing
country can transition from imitating to innovating, and its predictions are substantiated by
empirical research that has been conducted using actual data. A desirable property of the
model is the fact that it has closed-form solutions. The tractability of the model allows me
to provide analytical solutions for the growth rate and total factor productivity (TFP) of each
steady state. This chapter is organized as follows: Section 1.2 provides the background and
an overview of the previous literature, Section 1.3 presents the model, Section 1.4 includes
an analysis of the aggregate dynamics of the economy, Section 1.5 explains the general
equi-librium results, Section 1.6 explores the empirical implications of the model, and Section
1.7 concludes.
1.2
Background and Previous Literature
Current research suggests that the growth rate of a country depends on how effectively it
has overcome barriers to human development and to technological innovation (Howitt and
Mayer-Folkes 2004). Feyrer (2008) asserts that differences in technology are what cause
“technological change lies at the heart of economic growth.” Klenow and Rodriguez Clare
(1997) study the growth rates of productivity across countries and conclude that productivity
differences account for 91% of the difference in growth rates of output per worker. Both
authors assert that models that emphasize the accumulation of human capital as a catalyst
for growth overstate its importance.
They also conclude that endogenous growth models should incorporate technology
dif-fusion and policies that affect productivity in order to research differences in growth rates
across countries. The research done by Easterly and Levine (2001) further substantiate the
findings of Klenow and Rodriguez Clare. They conclude that factor accumulation is not
suf-ficient for explaining why countries have different growth rates of GDP per capita. Easterly
and Levine use the Penn-World Tables to assert that the growth of total factor productivity
(TFP) accounts for 60% of the growth of output per worker. They state that future research
needs to focus not only on studying why productivity differences across countries exist,
but also on defining TFP more precisely and modeling how technology diffuses from one
country to another country.
These findings confirm the importance of developing theoretical models that explain
how technology diffuses from an advanced country (that is more productive in
research-ing and developresearch-ing new products) to a country that is less developed and inefficient in
re-searching and developing new products. Grossman and Helpman (1991b) have often been
credited with proposing the very first endogenous growth model of technology diffusion.
the Grossman and Helpman model.3 Other economists have used the Nelson and Phelps
(1966) model that incorporates human capital to research technology diffusion. At times
international trade is the conduit for technology diffusion. The Connolly (1997), Connolly
and Valderrama (2005), Coe, Helpman and Hoffmaister (2008), Eaton and Kortum (2002),
and Xu and Chiang (2005) models follow this approach. Eaton and Kortum (1996,1999),
Xu and Chiang (2005), and Guellec and van Pottelsberghe (2003) assume that technology
can be transferred from one country to another without trade. They use data on patents and
the stock of R&D capital to study technology diffusion. Xu and Chiang (2005) also use the
Nelson and Phelps model to study how technology diffuses in disembodied form.4
Some of the research findings concerning the diffusion of technology have concluded
that when trade exists, the less developed country will have a comparative advantage in
low-technology goods while more developed countries will have a comparative advantage in
goods that are produced with a high level of technology (Lucas 1998, Boldrin and Scheinkman
1988, and Matsuyama 1992). The research of other economists, who have studied the
dif-fusion of technology conclude that the less developed country will be a perpetual imitator
forever (Grossman and Helpman 1991a, 1991b, 1991c, Aghion and Howitt 2008, Barro and
Sala-i-Martin 2004). The extension of the Barro model allows for innovation in the less
de-veloped country, but then it has the unrealistic conclusion that the more dede-veloped country
will stop innovating and start copying the newly invented goods from the less developed
country that has now become the more advanced country. The shortcomings of these
mod-3Keller (2004) offers an excellent survey of the research that has been conducted concerning international
technology diffusion and its effects on productivity.
4According to eurostat, “the acquisition of disembodied technology includes acquisition of external
els are that they do not allow for a learning process that can help the less developed country
learn to innovate when the data shows that some former less developed Asian countries have
become technology innovators.
Figures 1.1 and 1.2 illustrate the fact that the number of patents granted per resident
in Japan, China, the USA, South Korea, Taiwan, Singapore, Malaysia, and Thailand was
higher in 2009 than in 1995.5 The World Intellectual Property Organization (WIPO) defines
patents as an “an exclusive right granted for an invention, which is a product or a process that
provides, in general, a new way of doing something, or offers a new technical solution to a
problem.” This definition is taken from the WIPO website http://www.wipo.int/patentscope/en/.
The WIPO website also offers the following explanation for how a patent is granted and what
constitutes an invention: “an invention must, in general, fulfill the following conditions to
be protected by a patent. It must be of practical use; it must show an element of novelty,
that is, some new characteristic which is not known in the body of existing knowledge in
its technical field. This body of existing knowledge is called prior art. The invention must
show an inventive step which could not be deduced by a person with average knowledge of
the technical field. Finally, its subject matter must be accepted as patentable under law. In
many countries, scientific theories, mathematical methods, plant or animal varieties,
dis-coveries of natural substances, commercial methods, or methods for medical treatment (as
opposed to medical products) are generally not patentable.”
Based on this definition, and evaluating the data in both figures, it is evident that Japan,
and Indonesia are increasing their efforts to innovate. Table 1 lists each country’s rank with
regard to patents granted in 1995 and 2009. The extent of innovation in each country is
made even more apparent by this data. Even though Thailand, Singapore and Malaysia
have fewer patents granted than Japan, South Korea, China, and Taiwan, each country’s
rank has increased substantially since 1995.
Table 1.1 Patents Granted to Residents: Rank per Country
Country Rank in 1995 Rank in 2009
USA 2 2
Taiwan 17 5
Japan 1 1
China 10 3
South Korea 6 4
Thailand 83 50
Singapore 64 25
Malaysia 59 34
Source: WIPO and National Statistics of the Republic of China
Figures 1.3 and 1.4 show the evolution of the number of articles published in
scien-tific journals from 1985 to 2007 by authors residing in China, Japan, Taiwan, South Korea,
Thailand, Malaysia, Indonesia, and Singapore. If it is assumed that these published articles
reflect the level of activity dedicated to innovating in each country, then one can conclude
that research aimed at inventing new products, processes or ways of solving problems has
increased since 1985. Carolan, Singh, and Talati (1997) research bilateral trade between
the US and Hong Kong, Indonesia, Japan, Korea, Malaysia, Singapore, Taiwan and
Thai-land from 1962-1992 and discover that the trade patterns between the US and theses eight
countries has changed during this time period. In the beginning, these East Asian countries
compara-tive advantage changed so that by 1992, they were exporting technologically sophisticated
goods to the US. The data from the World Competitiveness Yearbook (2002,2009) also
indicates that South Korea, China, Malaysia, Taiwan, Singapore, and the Philippines are
currently manufacturing high-tech goods.6
Figure 1.1 The evolution of the number of patents granted to residents from 1995-2009 in Japan, the USA, China, South Korea, and Taiwan. Source: World Intellectual Property Organization (WIPO). Taiwan data source: National Statistics of the Republic of China.
Figure 1.2 The evolution of the number of patents granted to residents from 1995-2009 in Singapore, Malaysia, and Thailand. Source: WIPO.
CHN JPN KOR USA Taiwan 0 20000 40000 60000 80000 100000 120000 140000 160000 180000 200000
1995 1997 1999 2001 2003 2005 2007 2009
N u m b e r o f Pate n ts Gr an te d to R e si d e n ts SGP MYS THA 0 100 200 300 400 500 600
1995 1997 1999 2001 2003 2005 2007 2009
Figure 1.3 The evolution of the number of articles published in scientific journals from researchers in Japan, China, South Korea, and Taiwan. Source: World Development Indicators (WDI). Taiwan data source: National Statistics of the Republic of China.
JPN CHN Taiwan KOR 0 10000 20000 30000 40000 50000 60000
1985 1989 1993 1997 2001 2005
N u m b e r o f A rticl e s MYS SGP THA IDN 0 500 1000 1500 2000 2500 3000 3500 4000
1985 1989 1993 1997 2001 2005
Development economists have researched technology diffusion within the newly
indus-trializing economies (NIEs)7 and concluded that there has been a definite transition from
imitation to innovation. Nelson and Pack (1999) suggest that South Korea, Taiwan,
Sin-gapore, and Hong Kong used the knowledge acquired through absorbing knowledge from
abroad to learn how to innovate. Both authors assert that technology diffusion was
instru-mental in increasing the productivity of labor and providing workers with the skills needed
to invent new products. Hobday (1995) also proposes that a learning to innovate process
exists, and its success (firms begin to innovate) depends on the resources firms allocate to
the learning process. He contends that not only do firms absorb advanced knowledge from
abroad in order to increase productivity, but they also use the acquired knowledge to learn
how to invent new products. Lall (1987) also investigates the learning to innovate8process
in India.
At the macroeconomic level, current research is starting to address the issue that some
countries (that used to be technology imitators) are now technology innovators. New models
are being developed to explain how this process occurred. The general consensus is that the
catalyst for innovation was the diffusion of technology, and the learning process associated
with it. Rachel van Elkan (1996) develops the first (endogenous growth) diffusion of
tech-nology model that allows for a transition from imitation to innovation in the less developed
country. Her model includes a learning from imitation effect and a learning by doing effect
7
Kim and Nelson (2000) contains articles that provide an excellent overview about how firms in NIEs have managed to transition form imitation to innovation. Kim (1997) investigates how firms in South Korea man-aged to learn how to innovate.
8Lall refers to learning to innovate as learning to industrialize. He also refers to technology diffusion as
of innovation that augments human capital. She finds that imitator countries can eventually
become product innovators once human capital increases enough through imitation, and the
rates of return to both activities become equalized. van Elkan rules out complete
special-ization and concludes that LDCs will innovate and imitate in the steady state. van Elkan’s
model does not include a formal R&D sector which is somewhat unrealistic for a model
of technology diffusion. The consensus is that while it is important to have an educated
workforce, it is the R&D that is conducted within a LDC that is critical for the successful
assimilation of technology from abroad.
Michelle Connolly (1997) also researches the idea of learning to innovate. In her 1997
paper and subsequent 2005 paper with Diego Valderrama, she presents the concept of
learn-ing to learn. Both authors assert that technology diffusion begins as the producers in the
follower countries use knowledge gained through past imitation to improve the quality of
the leader’s products and eventually overtake the leader’s quality with new quality
inven-tions of their own (vertical innovation). Currie, et. al (1999) is the first variety expansion
model that incorporates the possibility of innovation in a LDC. Their model investigates
how cost reducing knowledge spillovers influence the decisions of firms in less developed
countries. They have three possible steady state regimes in their model: imitation in the
LDC with innovation in the more developed country; imitation and innovation in the LDC
with innovation in the more developed country; and innovation in the LDC with
innova-tion in the more developed country. The transiinnova-tion between steady states is mechanical and
1.3
The Model
1.3.1
Overview and Important Assumptions
The model presented in this dissertation characterizes how technology diffuses from a leader
country to a follower country when there is no international trade in goods and services. An
example of a leader country (henceforth referred to as country A) is the United States. An
example of a follower country (henceforth referred to as country B) is China. Country A is
superior to country B with respect to productivity and product innovations. Country A is
also good at research and development, inventing new products and incorporating new ideas
and technological advancements into the production process. Mansfield et al. (1981) find
that it is cheaper to imitate than innovate in terms of cost and effort. In keeping with their
results, it is assumed that in the beginning, it is cheaper and more efficient for a producer in
country B to imitate country A’s technology and products than to try to develop cost cutting
measures and new products.
It is assumed that technology can flow from one country to another without trade. Even
though international trade is clearly an important channel for technology diffusion, it is
not the only channel. Eaton and Kortum (1996,1999), and Xu and Chiang (2005) show
that international patents are a channel whereby technology diffuses. Xu and Chiang find
that middle-income and low-income countries benefit substantially from foreign patents.
Guellec and van Pottelsberghe (2003) assume that technology can be transferred from one
country to another without trade. They find that both domestic and foreign R&D capital
stocks affect long term productivity. Mansfield and Romeo (1980) also study the means
managers at US based firms were convinced that reverse engineering was the main channel
of technology transfer to foreign firms. Managers also believed that the information
ob-tained by patents and foreign companies recruiting and subsequently hiring their workers
also contributed to technology diffusion. Other channels of technology diffusion include
foreign direct investment (FDI) and sending students/managers abroad to study.9
For the purposes of this chapter, it is assumed that technology diffuses from country A
to country B whenever entrepreneurs in country B decide to obtain a copy of a product that
has been invented in country A in order to give it to researchers located in their country.
These researchers will then reverse engineer each product and make it available for
produc-tion in country B. The reason why I opt for reverse engineering as the channel of technology
diffusion is because of the idea of tacit knowledge. Evenson and Westphal (1995) explain
how important the transfer of tacit knowledge is to increasing productivity. Both authors
assert that tacit knowledge “can only be acquired through investments in learning-learning
that is importantly grounded in purposeful analysis of information gained through practical
experience. With learning comes increased understanding of technology and of
circum-stances, which typically results in changes away from the original solution, as techniques
are adapted to local circumstances or otherwise modified to achieve higher productivity.
Learning is generally a sequential process, so that alterations in techniques usually take
place through a progression of problem reformulations leading to new solutions (p. 2214).”
Tacit knowledge is transferred to R&D workers in a developing country during the
advanced products, and they have to figure out how to adapt the products for use in their
country. They also learn how to correctly reassemble each product and its embedded
tech-nology. Thus, as the research indicates, it is not just exposure to advanced products that
increases productivity, but it is the transfer of tacit knowledge and the increase in worker
efficiency10that substantially increases productivity. Since I postulate that R&D workers in
country B learn how to innovate from imitation, reverse engineering is the most
appropri-ate channel of technology diffusion to use. As R&D workers in the LDC reverse engineer
country A’s more technologically sophisticated products, they increase their analytical and
critical thinking skills as well. If they increase their skill set sufficiently enough, they will
learn how to innovate new products. Evenson and Westphal agree with this logic of how
learning to innovate occurs. Both authors assert that “investments in learning lead either
to assimilation, duplicating understanding that exists elsewhere without adding to the stock
of reproducible technology, or to invention and innovation, adaptive or otherwise,
creat-ing novel elements of reproducible technology that yield higher productivity under local
conditions (p. 2214).”
There are no international financial markets, and there is no exchange of goods, services,
or labor between country A and B. It is assumed that it is the knowledge that is inherent in
the goods, and not the process of importing goods, that promotes the diffusion of
technol-ogy. If firms in country B purchase just one product that has been invented in country A,
reverse engineer it, copy it, manufacture it, and sell it themselves within their country, then
technology diffusion occurs.
The novel feature of my model is the fact that imitation of a leader country’s products
increases the productivity of labor in the follower country. Although the basic framework
is that of the classic Grossman and Helpman (G-H) set-up of product innovation, the
ad-dition of this feature is an important modification of their model. The production function
for each firm is the same as the one used in the G-H model. Their model does not include
the concept of learning to innovate which is what I want to to investigate. Because of this,
I have modified their baseline model with respect to how the number of product varieties
grows and added a learning to innovate effect. This allows me to research the effect that
technology diffusion has on production, costs, and growth. I have opted to use the same
concept of learning to innovate that was first introduced in the van Elkan (1996) Connolly
(1997) models; however, I have modeled this process differently. I incorporate a knowledge
spillover effect that not only increases the productivity of researchers assigned to imitate
country A’s goods as the number of imitated goods increases in country B, but it also
in-creases the productivity of researchers assigned to invent new products. This captures the
effect of learning to innovate.
Producers in country B decide if they want to copy country A’s product or invent their
own product. When the decision to imitate is made, a copy of country A’s product is obtained
and reverse engineered. Contrary to the Barro and Sala-i-Martin (2004), Aghion and Howitt
(2009), Acemoglu (2009), and G-H (1991b) models, firms in country B are not imitators
indefinitely. Because imitation raises the productivity of labor in country B, increases the
general knowledge level within the country and increases the skill-set of the labor force, at
some point, it might become advantageous for firms in country B to start innovating. Once
and the remaining firms can only copy the subset of country A’s goods that have not been
copied already. Imitation takes place when a firm in country B copies a product that is new
only to country B. Innovation takes place when a firm invents a product that is new to the
world.
1.3.2
Households in Country B
Households in country B are analogous to the set-up in G-H (1991c). There areLidentical
households that supply labor and consumption loans in competitive markets. Labor is
sup-plied inelastically by each household, and each household is endowed with one unit of labor.
There is no population growth. The representative household maximizes lifetime utility
U=´0∞e−(ρ)tlogC
tdt,ρ>0 (1.1)
subject to the flow budget constraint
˙
A=Ar+w−E
ρis the individual discount rate,Ais assets holding,ris the rate of return on assets,wis the
wage rate, andE is consumption expenditure. Profits are distributed equally to consumers,
and all variables are in per capita terms. To simplify the notation, time subscripts for
endoge-nous variables are suppressed whenever confusion does not arise. As usual, the functional
C=h´NB
0 C
(η−1)/η
i di
iη/(η−1)
,η >1 (1.2)
is interpreted by using Ethier’s (1982) definition and reflects the fact that total factor
pro-ductivity (TFP)11 rises with the number of available varieties (G-H 1991). Crepresents a
final good that is consumed by each household.Cidenotes the input of intermediate good or
serviceiinto production of the final good, so everyCiis a differentiated intermediate good.
η>1is the elasticity of product substitution. NBis the number of goods (firms) existing at
timet. It also represents the knowledge stock that is available at timet. The Lagrangian for
calculatingCi≡Xi=L·Ciis
L=h´NB
0 C
(η−1)/η
i di
iη/(η−1)
+λ h
E−´NB
0 PiXCidi i
(1.3)
WherePiX is the price of the goodXi. Using the FOCs for ∂∂CLi , and the fact that
E=´NB
0 PiXCidiyield
Ci=E
PiX−η/´NB
0 P
1−η
jX dj
(1.4)
whereCirepresents the optimal input of good i into the production of the final good C.
The optimal aggregate demand ofCi≡Xi=L·Ciis
Xi=LE
h
PiX−η/´NB
0 P
1−η
jX dj
i
Consumers demand12 equal amounts of each good because they love product variety, but
they are indifferent as to how they obtain this variety. Consumers view imitated goods as
imperfect substitutes for innovated goods. The fact that an increase in product variety also
increases utility, leads to symmetric demand functions for each good. Because of this, the
choice of which type of good (imitated or innovated) to produce will be made at the firm
level as managers seek to maximize profit and obtain the highest return on their investments.
The current valued Hamiltonian for the consumer’s dynamic optimization problem is:
Hc=logCtdt+µ(Ar+w−E) (1.6)
with the transversality condition:
lim t→∞µt
Ate−ρt =0 (1.7)
Using the fact thatC=PE
Xhe FOCs for
∂L
∂C and
∂L
∂A the optimal expenditure plan is the well known Euler equation
˙
E/E= (r−ρ) (1.8)
Prices are normalized in order to make nominal spending constant. This means that
Et=1, andrt=ρ for allt.
12While some models assume that new products are introduced into the economy because of changes in
1.3.3
Production and Market Entry in Country B
Producers in country B produce one differentiated consumption good according to the
fol-lowing production function:
Xi=Lxi (1.9)
Xi is one unit of output, andLxi is labor employment in production i.e. one unit of labor
produces one unit of output.13. Production of each goodXiis the same for all firms because
of the symmetric equilibrium14. Before a firm can produce the amount of a good that is
demanded by consumers, an entrepreneur in country B has to choose between either using
R&D to develop a new, differentiated product and manufacturing process or to purchase,
re-verse engineer and imitate a differentiated product and manufacturing process from country
A. This is the market entry decision. In the beginning, entrants prefer to copy country A’s
products and then adapt them for use in country B is because it is more cost effective and
efficient. The novel feature of this model is that imitation of country A’s products increases
the productivity of R&D workers in the innovation sector of the economy in country B.
Entrepreneurs in country B are searching for new markets and are somewhat risk averse.
Imitation cuts down on marketing and lowers the risk that the new firm will not work.
En-trepreneurs internalize the fact that if a firm was successful in country A, it has a high
proba-bility of also being successful in country B. They also internalize the fact that entrepreneurs
have already done the market research for them and found which sectors are profitable. This
The main reason why imitation is so appealing at first is the fact that with imitation, there
is an increase in productivity as R&D workers, who now have access to the technology of
country A, can increase their own skill set. As the workers increase their skill set, they learn
how to think and invent new products and technologies themselves. The incentive to invent
new products exists because imitation lowers the entry cost of innovation, and it increases
the return to R&D aimed at inventing new goods. The entry technology is characterized by
two different equations based on whether a good is imitated or invented:
˙
M=α(S¯,H¯)NBLM,α >015 (1.10)
˙
N=β(M,S¯,H¯)NBLN,β(M)>0 (1.11)
˙
NB
NB =
˙
M
NB +
˙
N
NB (1.12)
whereLM is the aggregate amount of labor devoted to R&D16aimed at reverse engineering
country A’s products, and LN is the aggregate amount of labor devoted to R&D aimed at
inventing new products. Malways represents a good that has been reverse engineered, and
the total number of imitated goods available in country B is always a subset of the total
number of goods that have already been produced and invented in country A.17 The total
number of product varieties available in country B isNB=N+M.In the beginning,α>β,
and represents the fact that copying is easier than innovation for the initial stock of
knowl-edge capital. This means that country B starts out by copying country A’s products because
15N≡invented technology that is new to the world and M≡imitated technology that is only new to country
B.
16The importance of firm level R&D efforts for technology diffusion is researched in Hu et al. (2005).
The authors analyze firm level data in China and find that technology diffusion occurs and is most effective when firms in China actively engage in R&D. Actively engaging in R&D makes it easier to absorb outside knowledge.
17This means that ifN
workers are more productive at reverse engineering products than they are at inventing new
products.18 The parameterβ is a function ofM,S¯,H¯ and evolves as follows:
β(M) =a−be−M (1.13)
˙
β =Mbe˙ −M (1.14)
β(M)NB and αNB represent the productivity of labor in R&D. Based on equations (1.10)
and (1.11), it can be noted that the knowledge spillover effect is not the same for invented
and imitated goods. The reason for this is that the model has an inherent learning to innovate
effect which implies that imitation not only increases the stock of public knowledge (NB),
but it also increases the ability of R&D workers who innovate19 (β). Since it is assumed
that knowledge is public; therefore, making it non-rival and non-excludable, each invention
(imitation) of a new product variety increases the stock of public knowledge. As the stock
of public knowledge increases, and ideas and methods are disseminated, it increases the
productivity of labor in R&D that is aimed at both imitation and innovation.
The functional form for β (β ≡b−ae−M) not only represents how far country B is
from the technology frontier of country A, but it also represents how efficient R&D workers
can be at innovating if they are exposed to the new technology that is embedded in imitated
goods. Unlike the increase in productivity that results from an increase in public knowledge,
β increases as country B approaches the technology frontier of country A. The increase inβ
occurs because there is a second spillover effect of the knowledge capital that is private and
ideas and methods makes future imitation and innovation easier, the actual increase in skills
that occurs because of the reverse engineering process is only beneficial to R&D workers in
the innovation sector of the economy because it increases each worker’s tacit knowledge of
how to innovate. In essence, labor productivity is composed of two parts: technology and
efficiency (tacit knowledge).
Technology in my model is represented by NB and encompasses the knowledge about
how to produce output, whileβ andα are variables that represent how efficient researchers
are. Both variables depend on the mean education level of the workforce (S¯)and the life
expectancy at birth of the workforce(H¯), which reflects the health of the workforce. The
distinction between technology and efficiency is clarified by David Weil. Weil defines
tech-nology20 as “the knowledge about how factors of production can be combined to produce
output,” and efficiency as measuring “how effectively given technology and factors of
pro-duction are actually used” (276). Weil also defines efficiency as “an umbrella concept used
to capture anything that accounts for differences in productivity other than differences in
technology” ( 276). For the purposes of this paper, the former definition of efficiency is
used. It is also assumed that a worker’s health and education affects his or her efficiency
level21. This is the novel feature of my model: the learning to innovate effect which is
captured byβ.
β can differ across countries and increases as the number of imitated varieties increases
because reverse engineering and imitating products increases the efficiency of R&D workers
who invent new goods, but it does not increase the efficiency of workers who imitate country
A’s goods. Reverse engineering a more advanced country’s products stimulates critical
20For the purpose of this dissertation, technology is embedded in capital goods and is represented by each
new product variety.
thinking and the invention of new products by R&D workers in the developing country.
This means that R&D workers become more efficient at combining factors of production
together to produce products that they have invented, but they do not become more efficient
at reverse engineering products that have been invented by someone else in country A.
Differences inβ occur because of differences in average education levels and the average
health of workers that affect the values ofbanda. For example, if a country has a healthy
workforce and a high education level, then it should have a higher a and a lower b than
a country with unhealthy workers and a low education level. The value ofb reflects how
much reverse engineering and imitating country A’s products can help increase the ability
of workers to innovate, while the value ofareflects the rate at which researchers in country
B benefit from reverse engineering and learning to learn. The value ofaalso reflects how
far away country B is from the technology frontier of country A.
For the purpose of this chapter, it is assumed that the economy starts out with given
values ofaandbi.eS¯andH that won’t change22 overtime. An analysis of what changes to
aand b(changes in education and health) mean to a developing country and its ability to
transition from imitation to innovation is given in chapter 2. This means that (13) illustrates
how much reverse engineering and imitation helps workers learn how to innovate given the
initial characteristics of the workforce and the initial level of technology that is available
in the economy. The fact that the ability of R&D workers (to innovate) increases as the
number of imitated goods increases, is the key to understanding how the model works. This
innovation.23
In my model, the transition from imitation to innovation occurs because of a learning
process that increases productivity and lowers the cost of innovation. As innovation
be-comes cheaper, firms have an incentive to innovate. It is not a mechanical process like the
one in the Currie model. In their paper, the transition from imitation to innovation occurs
only after the authors assign different values to certain parameters. The Glass model of
switching from imitation to innovation is also mechanical. She assumes that government
intervention influences the investment decisions of firms, and this is what drives the
deci-sion to innovate or imitate. I have developed a coherent model of learning to innovate that
is not mechanical and has closed-form solutions.
The cost of acquiring the product from country A, reverse engineering it and researching
the knowledge that is embedded within it “entails a lump-sum outlay”24 which is equal to
the entry costPMi. Once a firm has successfully imitated a good, it becomes the monopoly
provider of that good in country B. Equation (1.10) characterizes the flow of new products
when an entrant uses imitated knowledge; whereas, equation (1.11) characterizes the flow of
new products when an entrant uses innovated knowledge. Entrepreneurs in country B begin
to copy country A’s technology because they realize that the knowledge that is available to
them within their own country is insufficient for inventing new products and services.
Firms learn that they can easily acquire more advanced technology from country A, and
this is what they do. In the beginning because it is cheaper to copy and adapt the technology
from a leader country, the follower country only imitates and reproduces the production
pro-23Because of this, there are three possible steady state results. A country can either become a perpetual
innovator. It can become a perpetual imitator, or it can converge to a steady state where it does a combination of both innovation and imitation. The conditions that lead to each result will be discussed in more detail in Section 1.4.
cess that has already been invented in the leader country. As workers learn how to innovate
by imitating country A’s technology, it can become more efficient for firms to start
innovat-ing as the productivity of R&D workers increases. Once firms have successfully invented a
good, they pay the entry costPNiand become the monopoly provider of that good in country
B.
1.3.4
Value of the Firm and Free Entry
Using equations (1.10) and (1.11), the free entry condition for each type of firm can be
calculated. The price of starting a new firm using imitated knowledge is PMi = w αNB, and
PNi= w
βNB for a firm that uses invented knowledge. Therefore, the stock market value of the
firm at timet is equal to the net present value of profit at timet and is given by:
vi(t) =
´∞
t exp
´τ
t r(s)dsπi(τ)dτ (1.15)
vMi =αwNB (1.16)
vNi= w
βNB (1.17)
where equation (1.16) equates the value of the firm that uses imitated knowledge to its cost,
and equation (1.17) equates the value of the firm that uses innovated knowledge to its cost.25
In the beginning,vNi>vMi, but asMincreases,βandNBincrease andvNiandvMidecrease.
1.3.5
The Rate of Return to R&D
The standard asset pricing equation for the rate of return to R&D is
r= πi
vi +
˙
vi
vi (1.18)
viis defined in equations (1.16) and (1.17), andπi=PiXXi−wXi. Substituting forXiand
maximizingπiwith respect toPiyields the pricing strategy that maximizes profit
PiX = (wη
η−1) (1.19)
WherePiX is the monopoly price that each producer charges for each intermediate good.
Using equation (1.19), per brand operating profit is
πi=ηLENB (1.20)
Using equations (1.18) -(1.20) yields
rM = αLE ηw +
˙
vMi
vMi =ρ (1.21a)
rN = βLE ηw +
˙
vNi
vNi =ρ (1.22a)
Where (1.21a) represents the rate of return to R&D directed at imitating country A’s goods,
and (1.22a) represents the rate of return to R&D directed at innovating new goods. The rate
the change in the value of the firm. Increases in productivity cause the rate of return to R&D
to increase because it lowers entry costs. The returns to both types of R&D are decreasing
with the growth rate of the number of varieties that are invented and imitated. This is due
to the spillover effect of knowledge. As entry increases, the pool of knowledge available
to all the firms in the market increases; therefore decreasing the returns to both forms of
knowledge. This decrease in profits, which occurs as more firms enter the market and the
average firm size decreases, is exactly offset by the decrease in the cost of variety expanding
innovation due to the knowledge spill-over effect. This is what allows for perpetual,
self-sustained growth along the BGP. It can be noted by looking at both equations that the rate
of return to R&D for imitation is higher than the rate of return to R&D aimed at innovating
in the beginning, but over time, asβ increases and β˙
β decreases,
26the possibility exists for
both rates of returns to equalize, or for the rate of return to innovation to be greater. The no
arbitrage condition27 requires that the rate of return on a riskless asset be equal to the rate
of return to R&D.
26 β˙
β decreases and asymptotically will be equal to zero.
27This means that if innovation is more profitable than imitation, thenr=r
N. If imitation is more profitable
1.4
Aggregate Dynamics
1.4.1
The Investment Decision
The number of imitated and innovated goods that are available to consumers is decided at the
firm level as managers choose which type of R&D they want to invest in. Each firm wants
to maximize profit and will devote resources to R&D aimed at imitating goods or inventing
new goods based on a comparison of the rate of returns to both types of R&D. My model
differs from the typical endogenous growth model because it does allow for arbitrage in the
assets market. It is this arbitrage possibility that determines whether firms invest in imitation
or innovation.
The standard asset pricing equation for the rate of return to R&D isr= πi
vi +
˙
vi
vi. Using
the fact thatπi=PiXXi−wXiandPiX =(ηw−η1), profit reduces toπi= ηLENB. Substituting for vMi= αwNB andvNi= βwNBthe rate of return to imitation and innovation respectively is
rM = αLE
ηw + w
w−
˙
NB
NB =ρ (1.21b)
rN = βLE ηw +
w
w−
˙
NB
NB−
˙ β
β =ρ (1.22b)
As can be seen from (1.21b) and (1.22b), as long asβ evolves over time and is always less
thanα,the rate of return to R&D that is aimed at imitating goods is higher than the rate of
return that is aimed at inventing new goods. This means that entrepreneurs choose to enter
the market as imitators only in the steady state. Ifα =β asymptotically, β˙
β =0, and the rate of return to both types of R&D are equal. This means that firms will invest in both types of
α+δ ηLEw=β (1.23)
δis the value of β˙
β that occurs right before firms decide to shut down investment in imitation. This means thatβ >α for innovation to take place in the steady state. Using this
informa-tion, it is apparent that there are three possible growth regimes: the economy in country B
can evolve over time and end up on a stable balanced growth path (BGP) with firms who
specialize in imitating; the economy in country B can evolve over time and end up on a
stable BGP with firms who specialize in innovating; or the the economy in country B can
evolve over time and end up on a stable BGP with firms who specialize in both imitation
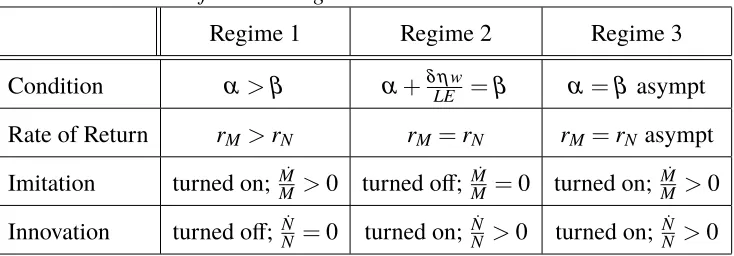
and innovation. The conditions that lead to each growth regime are given in table 1.2.
Table 1.2 Conditions for Each Regime
Regime 1 Regime 2 Regime 3
Condition α>β α+δ ηLEw =β α=β asympt
Rate of Return rM>rN rM=rN rM=rN asympt
Imitation turned on; MM˙ >0 turned off; MM˙ =0 turned on; MM˙ >0
1.4.2
The evolution of
β
β, α
α
β=(a-b )
β, α
α
β=(a-b )
Figure 1.6 Regime 2 Dynamics
β, α
α = β= (a-b )
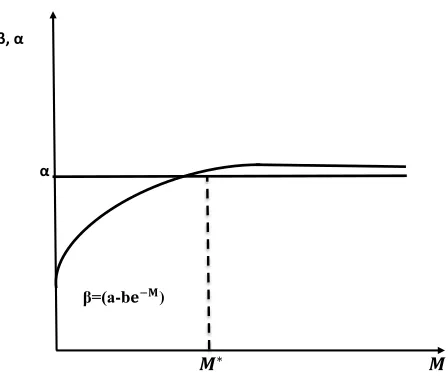
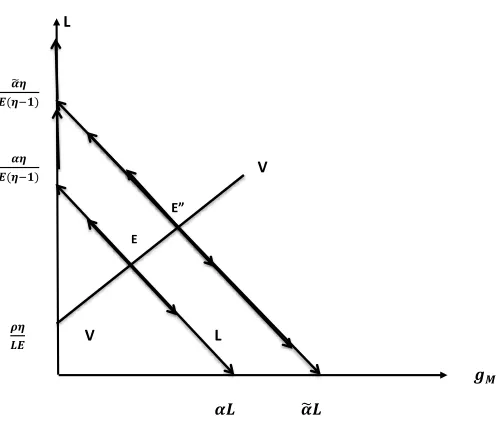
In order to understand the steady state results, a thorough explanation of the evolution of
β is needed because this is the key determinant of whether the economy in country B ends
up in regime 1, 2, or 3. Figures 1.5 -1.7 show how the two efficiency parametersα andβ
change as the number of imitated goods increases. As the figures show,α is constant and
does not change, butβincreases. Figure 1 shows the trajectory ofβfor a country that begins
as a product imitator and reaches its BGP and continues to imitate. As can be seen from
the figure, the productivity28of R&D workers, who imitate country A’s products, is always
greater than the productivity of R&D workers, who invent new products. This means that
the rate of return to innovation is less than the rate of return to imitation so firms only invest
in imitation.
How a country can start out in regime 1 and then end up in regime 2 is illustrated in
figure 1.6. In the beginning, the rate of return of imitation is greater than the rate of return
to innovation, so firms invest in reverse engineering and imitating goods. As the knowledge
stock increases, the productivity of R&D workers, who invent new products, increases as
well. As the knowledge stock of imitated goods continues to increase, workers become
more efficient at innovating29 than imitating, so firms stop imitating and will only innovate
in the steady state onceα+δ ηLEw =β. Then all firms invest in R&D aimed at innovating
only (regime 2) because the rate of return to both types of R&D are equal. The perfect
foresight Nash equilibrium guarantees that onceM∗is reached, no entrepreneur is willing to invest in imitation. AfterM∗,the rate of return to imitation is less than the rate of return to innovation, so firms are not willing to invest in this type of R&D anymore.
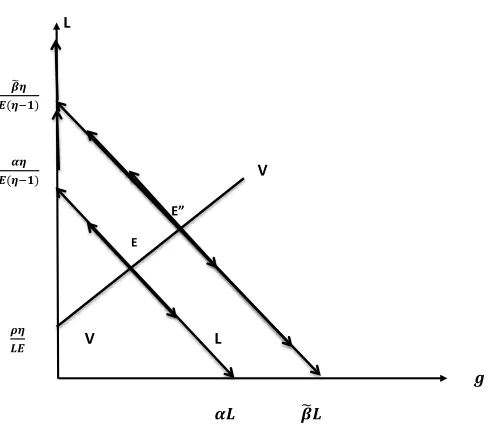
It is also possible for a country to start out as an imitator, but end up as a country that
28Throughout this dissertation, it is assumed that efficiency affects and determines productivity, so the terms
efficiency and productivity are used interchangeably.
imitates and innovates. Figure 1.7 shows how a country makes the transition from
special-izing in imitation only to equally investing in innovation based R&D and imitation based
R&D. In this case, at first, it is more profitable for firms to imitate country A’s products
because researchers are more efficient at imitating than innovating. As the knowledge stock
increases, and researchers benefit from the learning to innovate process, they become more
effective at inventing new products. Asymptotically,α =β. Along the BGP, there will be
both imitation and innovation. Entrepreneurs are willing to invest in both types of research
because the rate of return to imitation is equal to the rate of return to innovation, and the
possibility does not exist for the rate of return to innovation to be greater than the rate of
return to imitation.
1.5
General Equilibrium Results
General Equilibrium is defined by equations (1.8), (1.18) and the labor market clearing
condition which states that the total amount of labor that is available in a country is equal to
the amount of workers that work in each sector of the economy i.e. all of the labor force that
is dedicated to manufacturing intermediate goods, plus all of the R&D researchers equal
the total labor force. Mathematically, this means that
L=LX+LM+LN=LEP
iX +
˙
M
αNB +
˙
N
βNB (1.24)
economy in country B can evolve over time and end up in a steady state with firms that
specialize in both imitation and innovation. The conditions that lead to each growth regime
have already been discussed in detail in the previous section.
1.5.1
Steady State Results: Regime 1
Whenα >β, the economy is similar to the Grossman and Helpman (1991b) model. Firms
specialize in imitating country A’s goods, so all market entrants use their resources to
con-centrate on research that enables them to become better imitators of these goods. No firm
will invest in inventing new goods because it is not profitable for them. A developing
coun-try can end up in regime 1 if the learning to innovate effect does not increase the productivity
of R&D workers sufficiently enough to make innovation feasible. This occurs if a country
is either too far away from the technology frontier of country A, or if the country’s initial
efficiency and/or quality of its workforce is quite low and hinders the learning to innovate
effect.30 When this situation occurs, solving for the steady state is straightforward because
˙
N=0, soNB=Mand (1.12) reduces to
˙
NB
NB =
˙
M
NB =
˙
M
M (1.25)
Using the pricing strategy from (1.19), the value of the firm from (1.16), and plugging
(1.25) into (1.24) yields
˙
NB
NB =αL−
LE(η−1)
ηvNB (1.26)
A country’s growth rate of the number of imitated goods depends on the efficiency of its
workers (α), and the number of workers that are used to make intermediate goods X. A
high α and more workers dedicated to conducting R&D translates into a higher growth
rate, while a lowα and less workers dedicated to R&D translate into a lower growth rate of
imitated products. Following the method of G-H, in order to simplify the analysis, I define
the rate at which new product varieties are being introduced into the economy as N˙B
NB ≡gM,
and I define the inverse of the economy’s aggregate equity value asV ≡ 1
vNB. Now, I can
rewrite (1.26) as
gM =αL−LE(ηη−1)V (1.27)
Using the definitions ofV andgM, it is apparent that
˙
V
V =−
˙
v
v−gM (1.28)
Plugging the definitions ofgM andV into (1.18) yield
˙
V
V =
LEV
η −ρ−gM (1.29)
With these substitutions, the general equilibrium of the economy is determined by the
differential equation (1.29) and the condition (1.27). Figure 1.8 illustrates the equilibrium
V
L
V
E
V L
Figure 1.8 General Equilibrium Dynamics
The LL curve represents the resource constraint of the economy. Firms allocate labor either
exclusively to manufacturing, exclusively to R&D, or to some efficient combination of both
activities. The possible combinations of this division of labor are located only on the LL
curve. The VV line represents combinations ofV andgMthat maintain the relationship that
the growth rate of imitated product varieties is exactly equal to the rate of decline in the
value of new firms i.eV˙ =0in (1.28). A higher growth rate of imitated varieties implies
that more resources are devoted to R&D and less resources are devoted to manufacturing.
A stable equilibrium is achieved only at point E. At this point, the number of imitated
varieties grows at the constant rategM, labor is divided between manufacturing and R&D at
a constant ratio, and the aggregate value of firms does not change. The economy must jump
to this steady state, which means that there are no transitional dynamics. The directional
occur if the economy is not at point E, are instrumental in showing why the economy jumps
directly to its steady state. To the left of E (along the LL line), wages and prices decrease as
output increases, the value of the firm decreases at an increasing rate andV increases. To
the right of E (along the LL line), wages and prices increase as output decreases, the value
of the firm decreases at a decreasing rate andV decreases. Equation (1.29) shows that this
occurs because of differences in the growth rate of imitated varieties and the decline in firm
value. IfgMis bigger than the decline in firm value, thenV decreases. IfgMis less than the
decline in firm value, thenV increases. These results imply that points outside of E either
lead to aV that goes to infinity, or aV =0.Both results cannot be achieved because they
violate the general equilibrium conditions. This means that the economy jumps to its stable
equilibrium point E. Solving for V using (1.28) yields
gM = αL
η −
(η−1)ρ
η (1.30)
The number of imitated varieties grows at this constant rate along the BGP. Continued
im-itation is possible because the cost of market entry decreases with the number of firms (the
available knowledge stock), offsetting the decrease in profits that occurs as the number of
firms increases. A country’s steady state growth rate depends on the productivity of its
R&D workers, the subjective discount rate, the size of its labor force, and the elasticity of
product substitution. Having a more productive workforce increases the growth rate of
im-itated goods while having a less productive workforce decreases the growth rate. A higher
and more entrepreneurs are willing to conduct R&D and enter the market with imitated
products. A larger labor force increases the growth rate since more resources can be
de-voted to manufacturing intermediate goods and conducting research. A smaller labor force
decreases the growth rate. A higher value of the elasticity of product substitution leads to a
lower growth rate as consumers value product variety less, so the market power of market
entrants is smaller; thereby, leading to less entry by entrepreneurs. A lower value of the
elasticity of product substitution has the opposite effect on the growth rate.
A more precise explanation of what is growing in this model is needed in order to be
able to discuss the dynamics of economic growth. In keeping with the Grossman and
Help-man (1991) model, I have interpreted the consumption index using Ethier’s definition. This
means that consumers in country B consume a single homogeneous good in quantity C.
This final good is produced using differentiated intermediate inputs or producer services.
In other words, variety expansion occurs in the number of intermediate goods that are
avail-able. These intermediate goods are then used to produce one final good C. Using this
defi-nition, it becomes apparent that economic growth occurs with the growth rate of C. In order
to calculate the growth rate of C, I use
C=h´NB
0 C
(η−1)/η
i di
iη/(η−1)
(1.31)
I then substitute the following into (1.31)
Xi
L =Ci=
LX i
L
gc= (ηη−1)
˙
NB
NB (1.32)
The growth rate of C depends on the growth rate of intermediate goods. In regime 1, the
growth rate of C is (1.30). This means that the growth rate of income per capita depends
on the rate of product creation by entrants. The assumption of a symmetric equilibrium and
the Dixit-Stiglitz production function makes it easy to calculate total factor productivity
(TFP)31 for the economy which is
T FP=N
1
(η−1) B
and the growth rate of TFP is
gT FP= ( 1 η−1)
˙
NB
NB (1.33)
The level of TFP increases with the number of product varieties, and the growth rate of
TFP increases with the rate of product creation by entrants which is consistent with the
empirical data.32
1.5.2
Steady State Results: Regime 2
Whenα+δ ηLEw=β, firms specialize in innovating, so all market entrants use their resources
possibility that firms only innovate in the steady state is an improvement on the traditional
G-H model which completely excludes product innovation by developing countries. The
transition from imitation to innovation is not mechanical like the Currie model and occurs
due to the increase in β. This occurs if the initial quality of a country’s initial workforce
is high enough so that the ability of R&D workers to innovate is augmented sufficiently
enough by the learning to innovate effect to make innovation more profitable than
imita-tion.33When countries specialize in innovation only, solving for the steady state is
straight-forward becauseM˙ =0, and (1.12) reduces to
˙
NB
NB =
˙
N
NB (1.34)
Using the pricing strategy from (1.19), the value of the firm from (1.17), and plugging
(1.34) into (1.24) yields
˙
NB
NB =βL−
LE(η−1)
ηvNB (1.35)
A country’s growth rate of the number of innovated goods depends on the efficiency of
its workers (β), and the number of workers that are used to make intermediate goods X.
A highβ and more workers dedicated to conducting R&D translates into a higher growth
rate, while a lowβ and less workers dedicated to R&D translate into a lower growth rate of
innovated products. The method of solving for the steady state value of (1.35) in regime 2
is exactly the same as the method I used in regime 1. I define the rate at which new product
varieties are being introduced into the economy as N˙B
NB ≡gN, and I define the inverse of the
economy’s aggregate equity value asV ≡vN1
B. I rewrite (1.35) as