Study of incident water hammer in an engineering loop under two-phase
flow experiment
R.K.Singh, S.K.Sinha A.Rama Rao
Vibration Laboratory Section Reactor Engineering Division Bhabha Atomic Research Centre
Mumbai, India
Keywords: Water hammer, steam, water, engineering loop, superheat
1.
Abstract
Water hammer can occur in case of an inflow of sub-cooled water into pipes or other parts of the equipment filled with steam or steam-water mixture. The shock loading due to dynamic pressure during water hammer induces high stresses in the walls of piping especially in the bends. These stresses are not understood completely. The lack of enough experimental data is a major obstacle for validation of codes on fluid-structure interaction problems. A study was carried out to analyse real life incident of water hammer wherein an attempt was made to recreate water hammer involving steam water interaction in an instrumented engineering loop to capture pressure, temperature, flow rate and fluid levels in the loop. The arrival time of multiple shocks and the time lag between them have been examined in the paper with the support of energy balance equation for variable flow processes.
2.
Introduction
Water hammer is a common phenomenon when sub-cooled water flow in pipes or other containers filled with steam or steam-water mixture. They also appear as the consequence of fast closing or opening actions of valve or break in the pipelines conveying single or two-phase flow. In the latter case, shock waves are generated. In all the cases however, strong dynamic stresses are induced in the wall of the closed system or equipment. The influence of the fluid-structure interaction and the shock loads on the piping and supporting structures is not completely understood. In case of dynamic loads caused by the pressure wave, the stresses in the walls of pipe especially on the bends are very different from the stresses caused by static loading. The lack of experimental data obtained at well-defined geometric boundary conditions is a significant obstacle for validation of codes on fluid-structure interaction problems. Furthermore, up to now the feedback on structural deformations caused by fluid mechanics has not been fully implemented in the existing codes.
Two incident of loud sound, with in a span of four months was reported by operators of a full-scale engineering loop erected especially for carrying out experiments on loss of coolant accident and natural circulation. The over all size of the loop being too large, it was not possible to pin point exact location of the sound. Besides, there was no reported major deviation in the loop operating
parameters. As the loop was required to cater for large number of engineering experiments and in order to meet the safety regulation, a decision was taken to instrument the loop with vibration and shock transducers and capture sound wherever it happens in the loop. The operating parameters of the loop were closely studied and all possible combinations that could lead to loud sound were listed for execution.
This paper presents the investigation carried out to locate and quantify the source of loud noise in the loop so that the loop could be operated without violating safety knowingly and unknowingly.
3.
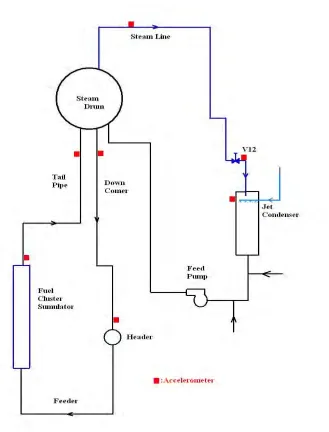
The Integrated Test Loop (ITL)
Figure 1 Schematic of Integral Test Loop
4.
Incident of Loud noise
4.1 Possible mechanism
ITL being a natural circulation loop, with the presence of steam and water in the system, three possible mechanisms were considerer.
• Water hammer due to fall of big water slug in the tail pipe. • Condensation induced water hammer in the steam line. [2], [4]
• Water hammer due to sudden condensation of steam in the jet condenser.
In the first mechanism, due to certain length of tail pipe being laid horizontal before running vertical up to SD, possibility of big water slug falling from SD into the tail pipe was considered. It found true this would lead to thorough redesign of piping and piping layout in the loop.
In the second mechanism, rushing of steam into the steam line and mixing with condensate trapped in the steam line was considered. On many locations on the steam line, the thermal isolation was partially out of place, which could lead to heat loss and potential location for accumulation of condensate. If this was found true, the steam line would be required to be fitted with drainpipe or steam traps.
In the third mechanism, sudden condensation of steam in the jet condenser was considered. If found true, then sub cool spray water temperature and flow rate of the spray water was to be corrected.
To check the possibility of any or all the mechanism to be present in the system, the loop was extensively instrumented with shock and vibration transducers.
5.
Additional Instruments
Nine accelerometers were installed on the loop and supporting civil structures to enable capturing of the incident of water hammer at any location in the loop. The locations were
• Down comer top 10th floor below SD • Tail pipe top 10th floor below SD • Steam line 10th floor
• Steam line 6th floor • Jet condenser 4th floor
• Down comer bottom 2nd floor • Tail pipe bottom 2nd floor
• ITL civil building in the jet condenser floor in East-West and North-South direction
6.
Loop Operation
To examine the phenomenon of big water slug falling in the tail pipe, the loop was operated at 200 KW heater power and all the parameters adjusted to 60 bar loop pressure. From 200 KW, the power was brought to zero (heater switched off) and again taken to 200 KW. There was no incident of water hammer in the MHT system. Different crew repeated this process several times during different time. No loud sound was heard.
Next, the feed flow into the steam drum was increased from lower range to upper range to examine if the water hammer can happen in steam drum due to mixing of relatively low temperature feed water with hot water in steam drum. There was no incident of loud sound recorded from any point of the loop.
Next, the steam line was opened for the steam to flow from SD to JC and spray water flow was started. The spray water temperature at the start of spray was 43 deg centigrade and the flow rate adjusted 100 LPM. With in a delay of 2 minutes, a series of five shocks were recorded one after the other. Every subsequent shock was felt with increasing intensity. After the 5th shock, the JC spray was stopped and the loop was brought to zero power.
7.
Signal analysis of water hammer
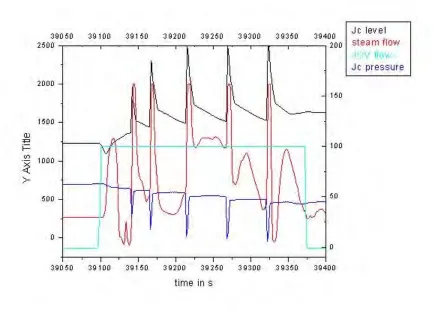
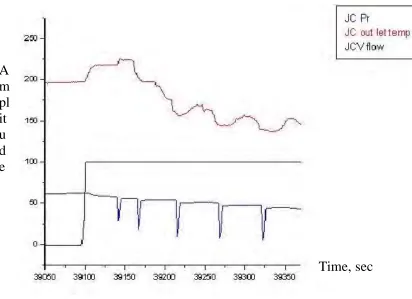
Figure 2 shows the vibration signal of the five-water hammer measured on JC. Figure 3 & 4 shows the trend of pressure and temperature in JC. The fall and rise of the pressure in the jet condenser takes place within 3 seconds for each shock. The fall in pressure is due to sudden condensation of steam and the recovery is due to additional flow of high-pressure steam from SD to JC. The trend of JC temperature also shows a fall during every water hammer and the lowest temperature in each fall decides the lowest pressure in jet condenser.
Figure 2 Shock pulses of water hammer
Figure 4 Jet condenser flow characteristics
8.
Time lag analysis
As seen in Figure 2, 3 and 4 there is varying time lag between the occurrences of the five shock waves due to water hammer in JC. They varied from 25 to 50 seconds. The question was what governed the arrival time of the five shocks. The steam coming to JC was continuous and spray water into JC spray was also continuous. It can be seen in the figure that the pressure in jet condenser does not change much between the events once it recovers from sudden drop. The role of super heat in the steam on arrival of water hammer was analyzed. For this the amount of super heat present in steam and what will be the time required to remove the super heat from the steam and recreate the condition conductive for the next events is evaluated. This is explained in the next Para.
9.
Level of Superheat
Due to spray cooling, steam inside the jet condenser condenses very fast and so the pressure drops rapidly. As the steam drum is connected to the jet condenser, the steam drum pressure also decreases. As the volume of SD is large, it always remains in saturated condition and so huge amount of steam is generated. This steam naturally flows towards JC. This flow of steam pressurizes JC and super heats the steam. As heat transfer coefficient of super heated steam is several times lower than condensation of saturated steam, the time required to remove heat from super heated steam is more. The time required to remove the heat from super heated steam depends on the amount of super heat present in JC.
Time, sec
A
For quantifying the super heat, energy balance equation for variable flow processes is used as below [3].
2
JC JC input input loss shaft
d dm 1
(m u ) (h v ) Q W
dt = dt +2 ! ! (1)
The above equation means energy accumulated in JC is equal to energy flowing inside JC minus the heat loss. As there is no work done by any shaft Wshaft = 0, and as JC is well insulated so Qloss =0.
Now the heat balance between steam drum and jet condenser can be given as
2
SD input input
1
h h v
2
= + (2)
This makes the energy balance equation as
JC
JC JC SD
dm d
(m u ) h
dt = dt (3)
For a sample calculation, initial and final pressure in JC was taken as 10 bars and 50 bars respectively. Initial (at 10 bars) mass in JC was taken mi and final mass as mf. hSD is enthalpy of saturated steam at 50 bars. Integrating the final equation from initial to final time the following equation is obtained.
f
t
f f i i SD
0 dm
m u m u h dt
dt
! =
"
(4)Dividing equation (4) by mi the following is obtained.
f f
f i SD
i i
u u ( 1)h
! !
" = "
! ! (5)
Substituting the values for f, i ,ui , hSD etc uf is obtained equal to 2751 KJ/ 0 K. The temperature corresponding to 50 bar is 3230 C whereas the saturation temperature at 50 bar is 2630 C. This gives super heat of 600 C in the steam. The average steam flow needed for pressurizing is approximately 2200 LPM which matches with the measured steam flow from SD to JC.
10.
Time to remove superheat
The pressure drop occurs in JC due to condensation of steam in one second (pressure drops from 50 to 10 bar in one second). The rate at which the heat is removed from the steam is calculated by taking the condensation heat transfer coefficient given in the JC design report. The typical steps of calculation are given below.
The time to remove superheat from the steam was calculated by taking heat transfer coefficient based on steam side conduction.[5]
d b sup erheat
d b
4 r r T Q
r r
! "
=
# (6)
Here rd is radius of liquid drop and r b is half of the average distance between two drops. The size of water drop is approximately taken as 0 .5 mm, which agrees with size given in design manual. Since r b>> rd we can say
sup erheat d b
Q =4 r r! "T (7)
Correlation used for condensation calculation is,
( ) ( )
0.5 0.33Nu= +2 0.57 Re Pr (8)
From above equation we can get heat transfer coefficient fromh Nuk D
= (9)
Heat transfer during condensation will be
condensation
Q =4!r r h Td b " so (10)
condensation d superheat
Q h
r
Q = k (11)
Nu is calculated as 11.36 and hence h is equal to 2420 Btu/Hr ft2 0F. In MKS units h is equal to 14235.2. k is steam conductivity. By substituting all values in equation (11) we get
condensation
superheat Q
222.3
Q = (12)
It shows condensation heat removal rate is approximately 222.3 times of super heat removal rate. For 600 C super heat, time calculated to quench this superheat is found 33 seconds.
The measured time delay between the events as shown in Figure 2 range from 25 to 53 seconds. The variation is basically because of different quantity of steam entering the JC and different pressure range during each event. A close agreement has been arrived at between the calculated and the measured time delay.
11.
Conclusion
Condition for water hammer was recreated in an engineering loop erected for carrying out thermal hydraulic experiment. The loop was extensively instrumented with vibration and shock transducers to quantify and locate the incident of water hammer. Five shocks of increasing intensity due to water hammer caused by condensation of steam in a jet condenser were recorded. Safe practice of operating the loop without encountering incidence of water hammer in future was identified.
An attempt was made to explain the reason for time delay different between the events through energy balance equation and the time required to quench the quantity of super heat in the steam was estimated.
12.
Acknowledgement
under the guidance of Dr P.K.Vijayan. Director of Reactor Design and Development Group and Head, Reactor Engineering Division encouraged to investigate the incident and minutely followed the development. Authors would like to acknowledge the support received from each one involved in the work.
13.
Reference
[1] BARC report :Integral test loop scaling philosophy and system description. Report No. BARC/ 2002/E/017 2002
[2] Wayne Kirsner,PE, Condensation – induced. HPAC January 1999
[3] Michacl P. Paidoussis Fluid Structure Interactions. Slender Structures and Axial Flow. Volume 1 & 2. ISBN 0-12-544360-9 (1998)
[4] Eberhard Altstadt et.al Fluid Structure Interaction Investigations for piping. Wissenschaftlich-Technische Berichte FZR-393. Dec-2003 ISSN 1437-322X
[5] Ki Yong Chei et.al Direct Contact Condensation Heat Transfer Model in RELAP5/ MOD3.2 with/without Non Nondensable Gas for Horizontally Stratified Flow. NED 211(2002) pp139-151