Simplified Approach to Consider Cracking
Effect on the Behavior of Laterally Loaded
RC Piles
Ahmed M. Ebid
Lecturer, Structural Department, Faculty of Engineering & Technology, Future University, Cairo, Egypt
ABSTRACT: Laterally loaded pile is a famous case of soil-structure interaction problem which was intensively studied by many researchers before. The techniques used to predict the behavior of laterally loaded piles were developed with increasing of the available computational capabilities from closed mathematical formulas to finite differences technique and finally linear finite elements technique. Recently, very sophisticated 3D elasto-plastic non-linear finite element models were used to accurately predict that behavior. Unfortunately, those sophisticated models are too complicated to be used in practical design. Hence, the aim of this research is to introduce a much simpler and practical approach to predict the behavior of the laterally loaded concrete piles considering the nonlinear effect of concrete cracking. Special calculating tool based on finite elements is developed to carry out a parametric study of the behavior of a set of 24 piles with different aspect ratios, reinforcement ratios, relative stiffness and head constrains. The validity of the calculating tool is checked against case history field tests. The results of the parametric study show three different failure modes according to the flexibility of the pile. Comparing the results with the formulas of ECP (202/4) shows the matching in the ultimate lateral capacity, while the ultimate lateral deformations are about (127 to 132%) of the code prediction.
KEYWORDS: laterally, piles, nonlinear, cracked, simplified.
I. INTRODUCTION
The analysis of laterally loaded piles depends on compatibility of deformations between the structure and the adjacent soil in addition to the static equilibrium conditions. The case of laterally loaded piles was intensively studied by many researchers before. Early researches were mainly interested in the ultimate state and strength evaluation. Due to the leak of computational capabilities, earlier researchers classified the laterally loaded piles into four cases and developed closed form mathematical model for each case to predict the maximum lateral displacement and bending moments. Those four cases are fixed head-flexible pile, fixed head-rigid pile, free head- flexible pile and free head-rigid pile [1]. The availability of hardware and software gave later researchers the ability to use more advanced mathematical techniques in studying the laterally loaded piles such as finite differences and finite elements. Those techniques allow the researchers to study not only the maximum values of deflections and moments but also the distribution of them along the pile. Besides that, the effect of non-uniformity of soil profile could be considered in the analysis. The behavior of pile under lateral loads was described by a curve known as P-Y curve. Many commercial software were developed based on those techniques to calculate the P-Y curve for any specific pile in a certain soil profile. However, the available commercial software still can’t simulate the accurate nonlinear behavior of soil and concrete, hence, they can’t accurately predict the deformation of the pile.
Some applications are not sensitive to deformation like shoring systems and the accuracy of the available software satisfies their requirements. On the other hand, some applications are sensitive to deformations such as foundations of communication towers. Such applications need more accurate calculations for deformations.
II. RESEARCHMETHODOLOGY
In order to study the effect of cracked section on the behavior of laterally loaded pile, the following research plan is considered:
a) Developing a calculating tool to carry out the parametric study.
b) Verifying the accuracy of the calculating tool using available case studies.
c) Determining the reasonable variation rang for each effective parameter.
d) Carrying out parametric study using the selected range for each parameter.
e) Comparing the results of calculating tool with the design formulas of ECP (202/4).
f) Summarizing the comparison results and concludes the recommendations.
III.CALCULATINGTOOL
In order to carry out the parametric study, a special non-linear finite element analysis calculating tool was developed using Microsoft Office Excel software. In order to facilitate the programming and the debugging process, the calculating tool was divided into three modules as follows:
a) A module to calculate gross, cracked and effective moment of inertia of circular reinforced section.
b) A module to carry out a simple linear-elastic finite element analysis to solve beam on elastic support problem
using lateral spring technique.
c) Controlling module to divide loading process to number of steps, after each step, it adjusts the effective
inertia of each element according to corresponding bending moment, update model geometry according to deflections, and finally prepare the model for the next loading step.
Each module will be described in the following paragraphs:
Cross section properties module
The task of this module is to calculate the mechanical properties of a given pile section to be used in the finite element analysis. The given data are concrete strength (Fcu), yield stress of reinforcement steel (Fy), pile diameter (D), concrete cover (c), area of longitudinal steel (As) and finally the actual bending moment (Ma). The module calculates the following mechanical proprieties for the given section, Gross moment of inertia (Ig), cracked moment of inertia (Icr), cracking bending moment (Mcr), ultimate bending moment (Mu) and finally the effective moment of inertia (Ie). As recommended by ECP (203-2012), calculations were carried out considering the modular ratio (n) equals to 10 for un-cracked sections and 15 for cracked sections.
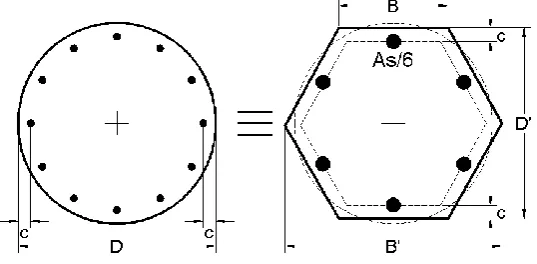
Circular pile section is idealized to equivalent area hexagonal section. Longitude reinforcement steel is idealized as six bars arranged on a hexagonal shape offset from the concrete edge hexagonal by the concrete cover. The six bars are located in the middle of six sides of the reduced hexagonal. Three bars are located above the neutral axis and the other three below neutral axis in symmetric arrangement. The areas of each bar sixth the total reinforcement area of the pile. This standard arrangement facilitates the calculations. (Fig. 1)
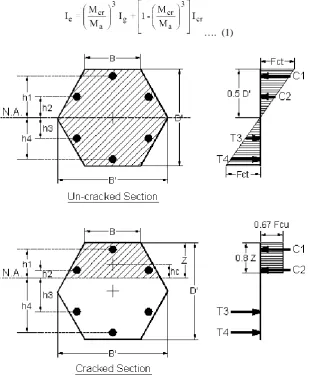
Gross moment of inertia (Ig) is calculated as symmetric composite section consists of concrete circular section with six steel bars. Due to symmetrical arrangement; the neutral axis is horizontal passes in the center of the section and (Ig) equals to the summation of the inertias and the product of areas multiplied by squared distances to neutral axe. Cracking moment (Mcr) is calculated by multiplying the modulus of concrete circular section by the tensile strength of concrete (Fct). In order to calculate cracked moment of inertia (Icr), the neutral axis should be determined first. Due to the symmetrical arrangement about the vertical axis through the center, the neutral axis is horizontal, the distance between neutral axis and the extreme compression fiber is called (Z). Distance (Z) is d etermined by when the first moment of inertia around the neutral axis equals zero. The closed form equation of (Z) is very complicated to be solved mathematically; alternative solution is to use the built-in solver tool in Excel to solve it by iteration. Once the neutral axis is determined; the cracked moment of inertia (Icr) is calculated as the summation of the inertias and the product of areas multiplied by squared distances to neutral axe. (Fig. 2)
Ultimate bending moment (Mu) is calculated as the summation of ultimate capacity of each element of the cracked section multiplied by its distance to the neutral axe.
Finally, the effective moment of inertia (Ie) is calculated using (Ig),(Icr),(Mcr) and (Ma) according to following formula [3],[4]:
…. (1)
Simple linear-elastic finite element module
The aim of this module is to carry out the finite element calculations for a single load step as simple linear -elastic analysis. In order to do that, a simple and limited capacity finite element spreadsheet is used. This spreadsheet is developed using Microsoft Office Excel software.
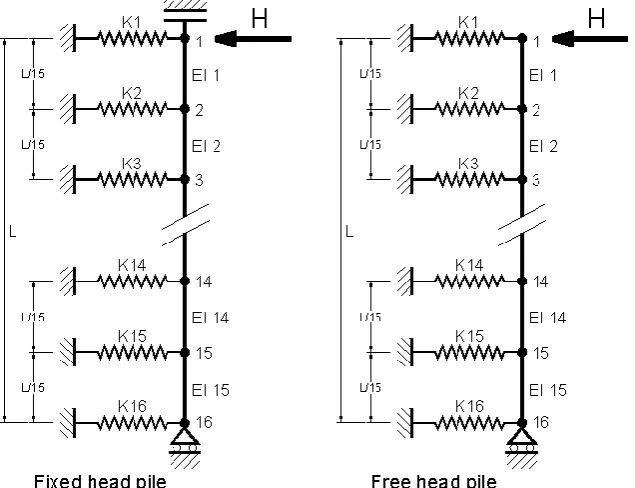
The laterally loaded pile is modeled as 15 equal vertical segments connected to each other in series; a lateral elastic spring at each node is used to simulate the soil while the vertical stability is achieved by restraining the pile vertically at the bottom node. In case of fixed head pile, the top node of the pile is rotationally restrained. The model is loaded by lateral load at the top node of the pile. (Fig. 3)
For the simple 2D linear-elastic finite element tool, the standard 2D frame element is used to simulate the pile segments. The 2D frame element has three degrees of freedom at each node; it can experience axial load, shear load and bending moment [7]. (Fig. 4)
According to standard procedure of finite element technique, the developed spreadsheet forms local axes stiffness matrix for each element. Because the local axes of the elements are matching the global axes of the pile, the local stiffness matrices are used directly to form the global matrix without any axes transformation.
The Excel built-in matrix invertor is used to invert the global stiffness matrix. Then the inverted matrix is multiplied by the load vector to get the deformation vector. Finally the deformation vector is used to get the forces and moments at the nodes. Because the local axes of the elements are matching the global axes of the pile, then, the forces and the moments at the nodes equal to the straining actions of the members directly.
Fig. (3) Schematic diagram for the finite element model of free & fixed head piles
Controlling module
This module is used to simulate the non-linear behavior of the laterally loaded pile by dividing the loading process into five equal steps. 20% of the total lateral load is applied in each loading step. After each loading step, the effective moment of inertia of each element is updated according to its bending moment from the previous loading step, and then the updated stiffness matrix is used in the next loading step.
To apply this technique in the developed spreadsheet, Five identical copies of the linear analysis modules are linked sequentially so that the straining actions from pervious spreadsheet is used to update the stiffness matrix of current spreadsheet, while the straining actions of current spreadsheet is used to updated the stiffness matrix of the next spreadsheet and so on. It should be noted that the stiffness of soil springs are maintained unchanged in the five spreadsheets of the non-linear analysis.
Besides the five spreadsheets that used to carry out the non-linear analysis, a sixth spreadsheet is used to carry out a full linear analysis where the model is loaded with full lateral load in one step and gross moment of inertia (Ig) is considered for all the elements.
After full run, the module checks two failure criteria for both linear and non-linear analysis. The first criteria is strength limit presented by the ultimate bending moment of the pile section, while the other one is serviceability limit presented by the limit of excessive lateral displacement at pile top, there is no specific value for this criteria, it depends on project specifications, hence, it is assumed as 10% of pile diameter as same as the ultimate vertical settlement. Pile capacity is determined by increasing the external lateral load gradually till one of the failure criteria occurs.
In order to facilitate the controlling process, a single main user interface spreadsheet is developed to distribute the input data and collect the outputs from the calculating spreadsheets.
IV.VERIFICATIONOFCALCULATINGTOOLUSINGFIELDTESTS
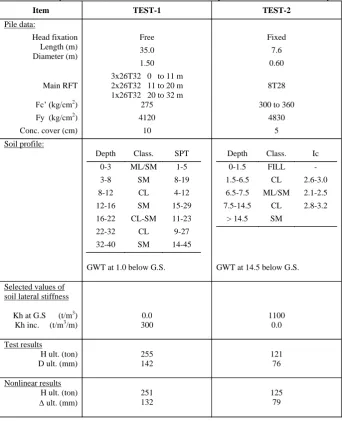
Two full scale field tests are used to verify the accuracy of software results. The first (TEST -1) was carried out on a free head pilot pile as a part of an elevated viaduct for a high speed rail way project in Taiwan [2], while the second (TEST-2) was carried out on a fixed head test pile by civil engineering department, California university as a part of a research program on laterally loaded group of piles [5]. Data of the two tests and comparison between their results and nonlinear analysis are summarized in table (1).
Soil profile in (TEST-1) is mainly granular soil and normally consolidated clay, hence, the lateral stiffness of soil is zero at ground surface and increased with depth. The rate of increase is chosen based on the average (SPT) value along the pile length (which is 16), as per ECP (202/3,4) [1],[6] this value is corresponding to relative density of 45%
and stiffness increasing rate of 600 (t/m3/m), and half of this value should be used below ground water table, hence,
the chosen (n) is 300 (t/m3/m).
Soil profile in (TEST-2) is mainly over consolidated clay; hence, the lateral stiffness of soil is constant with depth. The value of lateral stiffness is chosen based on the average consistency index (Ic) value along the pile length (which is 2.8), as per ECP (202/3,4) [1],[6] this value is corresponding to un-drained shear strength of 2.0 kg/cm2 and average lateral stiffness of 1100 (t/m3). As shown in table (1) and fig. (5), the calculated ultimate lateral loads and displacements are showing good matching with the experimental ones (unfortunately, there is no graphical presentation for TEST-2 results); hence, the calculating tool is accurate enough to carry out the parametric study.
V. RESULTSOFPARAMETRICSTUDY
The developed software is used to carry out a parametric study on a set of 24 piles with different aspect ratios, reinforcement ratios, relative stiffness and head constrains. The values of each parameter are chosen to be in the practical range. Input and output data of the 24 piles are summarized in table (2).
For all tests, the characteristic strength of concrete, the yield stress of reinforcement and concrete cover are kept
constant (Fcu = 250 kg/cm2, Fy = 3600 kg/cm2 and 50 mm respectively). Also, for all tests, lateral stiffness of soil is
considered zero at ground surface and increased linearly with depth with increment (n).
In order to normalizing the study results, the outputs are presented by five dimensionless variables, displacement () is
presented by (EI/Ht3), bending moment (M) is presented by (M/H.t), depth (Z) is presented by (Z/L), relative stiffness
which is (As/Ac). Where (t) is the elastic length of pile and equals to (EI/n)0.2, (n) is the rate of lateral stiffness increasing with depth, (H) is the external lateral load at ground surface, (L) is the pile length, (E) is the elastic modulus of concrete and (I) is the un-cracked second moment of inertia of pile section.
Table 1: Summary of full scale tests data and results comparison with nonlinear analysis
Item TEST-1 TEST-2
Pile data:
Head fixation Length (m) Diameter (m)
Free Fixed
35.0 7.6
1.50 0.60
Main RFT
3x26T32 0 to 11 m 2x26T32 11 to 20 m 1x26T32 20 to 32 m
8T28
Fc’ (kg/cm2
) 275 300 to 360
Fy (kg/cm2) 4120 4830
Conc. cover (cm) 10 5
Soil profile:
Depth Class. SPT 0-3 ML/SM 1-5 3-8 SM 8-19 8-12 CL 4-12 12-16 SM 15-29 16-22 CL-SM 11-23 22-32 CL 9-27 32-40 SM 14-45
GWT at 1.0 below G.S.
Depth Class. Ic 0-1.5 FILL - 1.5-6.5 CL 2.6-3.0 6.5-7.5 ML/SM 2.1-2.5 7.5-14.5 CL 2.8-3.2
> 14.5 SM
GWT at 14.5 below G.S.
Selected values of soil lateral stiffness
Kh at G.S (t/m3) Kh inc. (t/m3/m)
0.0 300
1100 0.0
Test results
H ult. (ton) D ult. (mm)
255 142
121 76
Nonlinear results H ult. (ton) ult. (mm)
251 132
Fig. (5): Cracked and un-cracked analysis results of (TEST-1) - Ultimate bending moment and lateral displacement
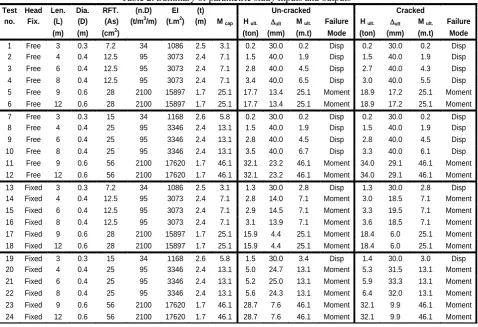
Table 2: Summary of parametric study inputs and outputs Table 2: Summary of parametric study inputs and outputs
Test Head Len. Dia. RFT. (n.D) EI (t) Un-cracked Cracked
no. Fix. (L) (D) (As) (t/m3/m) (t.m2) (m) M cap H ult. ult M ult. Failure H ult. ult M ult. Failure
(m) (m) (cm2) (ton) (mm) (m.t) Mode (ton) (mm) (m.t) Mode
1 Free 3 0.3 7.2 34 1086 2.5 3.1 0.2 30.0 0.2 Disp 0.2 30.0 0.2 Disp 2 Free 4 0.4 12.5 95 3073 2.4 7.1 1.5 40.0 1.9 Disp 1.5 40.0 1.9 Disp 3 Free 6 0.4 12.5 95 3073 2.4 7.1 2.8 40.0 4.5 Disp 2.7 40.0 4.3 Disp 4 Free 8 0.4 12.5 95 3073 2.4 7.1 3.4 40.0 6.5 Disp 3.0 40.0 5.5 Disp 5 Free 9 0.6 28 2100 15897 1.7 25.1 17.7 13.4 25.1 Moment 18.9 17.2 25.1 Moment 6 Free 12 0.6 28 2100 15897 1.7 25.1 17.7 13.4 25.1 Moment 18.9 17.2 25.1 Moment
7 Free 3 0.3 15 34 1168 2.6 5.8 0.2 30.0 0.2 Disp 0.2 30.0 0.2 Disp 8 Free 4 0.4 25 95 3346 2.4 13.1 1.5 40.0 1.9 Disp 1.5 40.0 1.9 Disp 9 Free 6 0.4 25 95 3346 2.4 13.1 2.8 40.0 4.5 Disp 2.8 40.0 4.5 Disp 10 Free 8 0.4 25 95 3346 2.4 13.1 3.5 40.0 6.7 Disp 3.3 40.0 6.1 Disp 11 Free 9 0.6 56 2100 17620 1.7 46.1 32.1 23.2 46.1 Moment 34.0 29.1 46.1 Moment 12 Free 12 0.6 56 2100 17620 1.7 46.1 32.1 23.2 46.1 Moment 34.0 29.1 46.1 Moment
13 Fixed 3 0.3 7.2 34 1086 2.5 3.1 1.3 30.0 2.8 Disp 1.3 30.0 2.8 Disp 14 Fixed 4 0.4 12.5 95 3073 2.4 7.1 2.8 14.0 7.1 Moment 3.0 18.5 7.1 Moment 15 Fixed 6 0.4 12.5 95 3073 2.4 7.1 2.9 14.5 7.1 Moment 3.3 19.5 7.1 Moment 16 Fixed 8 0.4 12.5 95 3073 2.4 7.1 3.1 13.9 7.1 Moment 3.6 18.5 7.1 Moment 17 Fixed 9 0.6 28 2100 15897 1.7 25.1 15.9 4.4 25.1 Moment 18.4 6.0 25.1 Moment 18 Fixed 12 0.6 28 2100 15897 1.7 25.1 15.9 4.4 25.1 Moment 18.4 6.0 25.1 Moment
VI.ANALYZINGRESEARCHRESULTS
Reviewing the values in tables (2), (3) indicates the following failure modes:
Failure due to excessive top displacement before concrete cracking
In this mode, the pile has the same behavior in both linear and nonlinear analysis (Same M ult., H ult. & ult.) because
the concrete section is still un-cracked till failure. This mode occurred mostly in free head rigid piles (L/t ≤2) and light
reinforced rigid fixed head piles (tests 1, 2, 7, 8, 9 and 13).
Failure due to excessive top displacement after concrete cracking but before concrete failure
In this mode, the pile acts with gross inertia till concrete cracking, when concrete cracks, it redistribute the developed bending moment at the cracked section. By increasing the lateral load after cracking, the lateral soil reactions are redistributed along the pile according to the actual cracked inertia of each section. Further increasing of the lateral load, the developed bending moment increases but the failure occurs due to excessive top displacement before the pile reaches the ultimate bending moment. This mode of failure occurred mostly in free head semi-rigid piles and heavy reinforced rigid fixed head piles (tests 3, 4, 10, and 19) and could be recognized by the following conditions:
• (M ult. Linear > M ult. Nonlinear) due to redistribution of moment
• (H ult. Linear > H ult. Nonlinear) due to reduction of inertia, maximum allowable displacement occurs
by smaller lateral force.
• ( ult. Linear = ult. Nonlinear) equals to maximum allowable displacement
Failure in concrete pile before excessive top displacement
This mode occurs in free head flexible piles (L/t > 4) (tests 5, 6, 11, 12) and in fixed head flexible and semi- flexible
piles (L/t ≥ 2) (tests 14 to 18 & 20 to 24). The pile on this mode behaves as the previous mode but the pile reaches the
bending moment capacity (M cap) before excessive top displacement occurs. This mode could be recognized by the following conditions:
• (M ult. Linear = M ult. Nonlinear), equals to bending moment capacity (M cap)
• (H ult. Linear<H ult. Nonlinear), because of moment redistribution, more lateral loads is needed to achieve
the moment capacity of the pile.
• (ult. Linear < ult. Nonlinear), due to reduction of inertia and increase of lateral load causes larger displacement.
This mode of failure controls the behavior of the flexible and semi- flexible fixed head piles because the total fixation at pile head is much stiffer than any type of soil; hence, it drags most of the bending moment on the pile. The developed bending moment at the fixed head increases quickly and causes redistribution of lateral reaction when reaches the cracking limit and failure when exceeds the bending moment capacity (M cap).
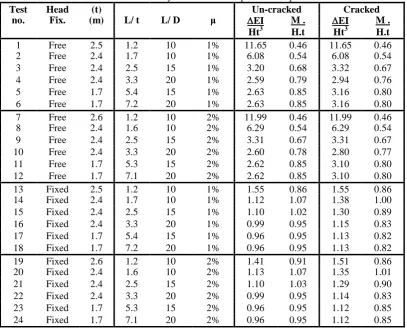
Table 3: Summary of normalized inputs and outputs
Test Head (t) Un-cracked Cracked no. Fix. (m) L/ t L/ D μ EI M . EI M .
Ht3 H.t Ht3 H.t
1 Free 2.5 1.2 10 1% 11.65 0.46 11.65 0.46
2 Free 2.4 1.7 10 1% 6.08 0.54 6.08 0.54
3 Free 2.4 2.5 15 1% 3.20 0.68 3.32 0.67
4 Free 2.4 3.3 20 1% 2.59 0.79 2.94 0.76
5 Free 1.7 5.4 15 1% 2.63 0.85 3.16 0.80
6 Free 1.7 7.2 20 1% 2.63 0.85 3.16 0.80
7 Free 2.6 1.2 10 2% 11.99 0.46 11.99 0.46
8 Free 2.4 1.6 10 2% 6.29 0.54 6.29 0.54
9 Free 2.4 2.5 15 2% 3.31 0.67 3.31 0.67
10 Free 2.4 3.3 20 2% 2.60 0.78 2.80 0.77
11 Free 1.7 5.3 15 2% 2.62 0.85 3.10 0.80
12 Free 1.7 7.1 20 2% 2.62 0.85 3.10 0.80
13 Fixed 2.5 1.2 10 1% 1.55 0.86 1.55 0.86
14 Fixed 2.4 1.7 10 1% 1.12 1.07 1.38 1.00
15 Fixed 2.4 2.5 15 1% 1.10 1.02 1.30 0.89
16 Fixed 2.4 3.3 20 1% 0.99 0.95 1.15 0.83
17 Fixed 1.7 5.4 15 1% 0.96 0.95 1.13 0.82
18 Fixed 1.7 7.2 20 1% 0.96 0.95 1.13 0.82
19 Fixed 2.6 1.2 10 2% 1.41 0.91 1.51 0.86
20 Fixed 2.4 1.6 10 2% 1.13 1.07 1.35 1.01
21 Fixed 2.4 2.5 15 2% 1.10 1.03 1.29 0.90
22 Fixed 2.4 3.3 20 2% 0.99 0.95 1.14 0.83
23 Fixed 1.7 5.3 15 2% 0.96 0.95 1.12 0.85
24 Fixed 1.7 7.1 20 2% 0.96 0.95 1.12 0.85
VII. COMPARINGRESULTSWITHECP(202/4)
Egyptian Code of Practice (ECP) (202/4) for deep foundations recommends three formulas to estimate ultimate bending moment and displacement for free and fixed head laterally loaded piles, the first is “Hetenyi, 1946” formula for flexible piles, the second is “Duncan, 1995” for semi-rigid piles and the third is “Barber, 1953” for rigid piles. Flexibility of pile could be classified by its (L/t) ratio, the pile is considered flexible if (L/t)>4 and rigid if (L/t)<2 and semi-rigid otherwise.
Failure mode mainly depends on pile flexibility, flexible pile always fails in concrete mass, while rigid piles always fails in soil mass. Semi-rigid pile may fails in concrete or soil. Hence, it is expected that flexible pile behavior is more affected by concrete cracks than the others.
According to “Hetenyi, 1946”, the ultimate bending moment and head displacement due to lateral load at ground surface could be calculated as follows:
M ult. = 0.85 H.t for fixed head pile (2)
= 0.77 H.t for free head pile (3)
ult. = 0.88 H.t3 / EI for fixed head pile (4)
= 2.40 H.t3 / EI for free head pile (5)
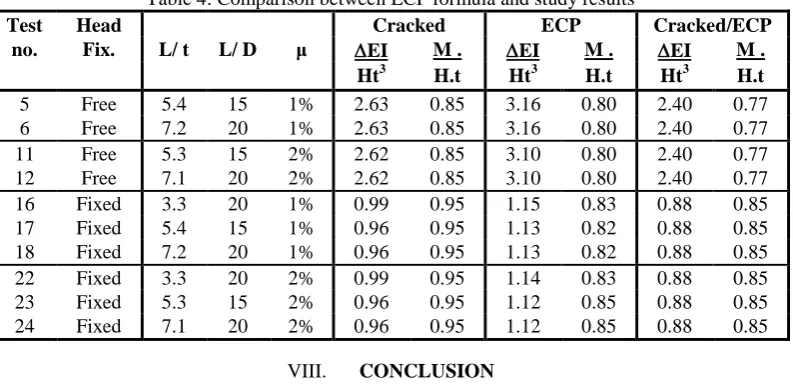
Table 4: Comparison between ECP formula and study results
Test Head Cracked ECP Cracked/ECP no. Fix. L/ t L/ D μ EI M . EI M . EI M .
Ht3 H.t Ht3 H.t Ht3 H.t
5 Free 5.4 15 1% 2.63 0.85 3.16 0.80 2.40 0.77
6 Free 7.2 20 1% 2.63 0.85 3.16 0.80 2.40 0.77
11 Free 5.3 15 2% 2.62 0.85 3.10 0.80 2.40 0.77
12 Free 7.1 20 2% 2.62 0.85 3.10 0.80 2.40 0.77
16 Fixed 3.3 20 1% 0.99 0.95 1.15 0.83 0.88 0.85
17 Fixed 5.4 15 1% 0.96 0.95 1.13 0.82 0.88 0.85
18 Fixed 7.2 20 1% 0.96 0.95 1.13 0.82 0.88 0.85
22 Fixed 3.3 20 2% 0.99 0.95 1.14 0.83 0.88 0.85
23 Fixed 5.3 15 2% 0.96 0.95 1.12 0.85 0.88 0.85
24 Fixed 7.1 20 2% 0.96 0.95 1.12 0.85 0.88 0.85
VIII. CONCLUSION
The results of this study could be concluded in the following points:
1) The developed calculating tool results are close enough to the full scale field tests; hence, it could be used
to carry out this parametric study.
2) Analyzing the study results shows three failure modes as follows:
a. Failure due to excessive top displacement before concrete cracking (Mostly for rigid free head
piles and light reinforced rigid fixed head piles)
b. Failure due to excessive top displacement after concrete cracking (Mostly for semi-rigid free head
piles and heavy reinforced rigid fixed head piles)
c. Failure in concrete before excessive top displacement (for fixed head flexible and semi- flexible
piles and flexible free head piles)
3) Comparing cracked analysis results with ECP formula for flexible piles shows that cracked ultimate
bending moments and lateral loads matched the ECP formula, while the cracked ultimate head displacement is about (127% to 132%) of the ECP formula.
4) For laterally loaded flexible RC piles, it is recommended to use effective moment of inertia (Ie) equals to
75-80% of the gross moment of inertia (Ig) of pile section in deflection calculation to account for concrete cracked section.
REFERENCES
[1] ECP committee 202. Egyptian Code for Soil Mechanics and Foundations - Part 4- Deep Foundation. Cairo: housing and building national research center "HBRC"; 2001.
[2] Chao-KuangHsueh, San-Shyan Lin, and Shuh-GiChern, Lateral Performance Of Drilled Shaft Considering Nonlinear Soil And Structure Material Behavior, Journal of Marine Science and Technology, 2004; 12(1), 62-70.
[3] ECP committee 203. Egyptian Code for Design and Construction of Concrete Structures. Cairo: housing and building national res earch center "HBRC"; 2012.
[4] San-Shyan Lin and Jen-Cheng Liao, Lateral Response Evaluation Of Single Piles Using Inclinometer Data, JOURNAL OF GEOTECHNICAL AND GEOENVIRONMENTAL ENGINEERING © ASCE / December 2006, 1566-1573.
[5] Anne Lemnitzer, Eric R. Ahlberg, PaymanKhalili-Tehrani, ChangsoonRha, ErtugrulTaciroglu, Jonathan P. Stewart and John W. Wallace, Experimental Testing of a Full-Scale Pile Group Under Lateral Loading, The 14th World Conference on Earthquake Engineering , Beijing, China, October 2008.
[6] ECP committee 202. Egyptian Code for Soil Mechanics and Foundations - Part 3- Shallow Foundation. Cairo: housing and building national research center "HBRC"; 2001.