ABSTRACT
SANKARAN, SRIRAM. Retrofitting an Effective Air Conditioning System for a Hybrid Vehicle Conversion. (Under the direction of Dr. Eric Klang).
In times when customers look for safe, comfortable, fuel efficient and eco-friendly
automobiles, hybrid vehicles are one of the definite way forwards for the automobile
industry. Hybrid vehicles have risen in popularity over the last 2 decades. But, the increase in
popularity has not mirrored into a huge demand, primarily, due to the high costs associated
with hybrid vehicles. Consequently, the interest in converting existing IC engine powered
vehicles into hybrid vehicles has grown considerably. There are number of companies
specializing in this field offering their services to interested parties. This is the motif of
“EcoCAR”, an advanced vehicle technology engineering competition series, where collegiate
teams are challenged to convert conventional IC engine models into vehicles run on alternate
vehicle technology. Teams are expected to model and build such a vehicle while maintaining
market acceptable performance, comfort and safety standards. One of the automotive systems
responsible for safety and comfort is the air conditioning system. It is the single largest
parasite of the vehicle power source. This results in an adverse impact on the vehicle
performance by reducing fuel economy, acceleration and increasing tail pipe emissions.
Research has shown that this impact is higher on high fuel economy vehicles like hybrid
vehicles. Hence, it could be stated that AC systems adversely impact the very advantages
which bolster the cause of hybrid vehicles. “EcoCAR2: Plugging In to the Future”, the second edition of the series, requires a fully functioning air conditioning system that can cool
effective air conditioning system for a vehicle that has been converted into a hybrid. It was
modeled for EcoCAR2 developed by a team of NCSU students. The step by step procedure
involved a heat load analysis, a performance analysis, heat load reduction and finally,
selection of components. A peak vehicle cooling/heat load of 2175 W was calculated that
resulted in an accessory electrical load of 3590 W. The performance of the vehicle running
on a UDDS drive cycle with the above electrical load was performed to enumerate its impact.
3500 W of electrical load resulted in a 12.1 mpg drop in the fuel economy. The cooling load
was finalized after considering various methods to reduce the vehicle heat load. With the
finalized cooling load, a compressor of 18 cc/rev was selected along with a condenser of 0.20
m2 and an evaporator of 0.054 m2.
© Copyright 2012 by Sriram Sankaran
Retrofitting an Effective Air Conditioning System for a Hybrid Vehicle Conversion
by Sriram Sankaran
A thesis submitted to the Graduate Faculty of North Carolina State University
in partial fulfillment of the requirements for the degree of
Master of Science
Mechanical Engineering
Raleigh, North Carolina
2012
APPROVED BY:
___________________________ Dr. Eric Klang
Committee Chair
DEDICATION
BIOGRAPHY
Sriram Sankaran was born in Chennai, a south-eastern city in the state of Tamil Nadu,
India to Sankaran Subramanian and Srimathi Sankaran. He has an older sibling, Kousalya
Sankaran. His father, an electrical engineer, was responsible for his curiosity and interest in
understanding objects, motion of objects, etc from an early age. Keen interest in Physics and
Mathematics coupled with a passion for automobiles led to a Bachelors degree in Mechanical
Engineering at Rajalakshmi engineering college, an Anna University affiliated institution.
SAE MINI Baja, India played an important role in his decision to pursue a Masters degree in
Mechanical Engineering at North Carolina State University. After graduation, he will be
taking up an offer from Cummins Inc., Rocky Mount to begin his career as a ‘Rapid problem
ACKNOWLEDGMENTS
Given an opportunity, I would rename this page “gratitude”. More than acknowledging
people, I would like to express my heartfelt gratitude to a number of people who have helped
me in getting to where I am today.
My parents have always had and will always have a positive influence on me. My
mother wanted me to have the best and highest level of education, right from childhood. My
father, my greatest source of inspiration, has stood by me during my mistakes (quite a few
big ones) and made sure I got back into the right path. My sister was my earliest challenger
and has always believed in me, more than I do. These people are the foundation on which I
have built my life and I cannot repay them enough in this lifetime.
I have always been blessed with the best of friends and they have been instrumental
in building my personality and confidence. Right from Arun Prasadh who kindled my
passion for automobiles to Rajmohan Selvaraj who stood forth for my place in SAE MINI
BAJA, I would like to thank each and every single friend who has supported me through
thick and thin. It would take at least 2 pages to mention every single one of them. But, they
would personally know who all I am referring to (Outlaws & Lalli). As always with any
international student, it would have been tough without my friends in Raleigh who made it a
home away from home.
I would like to thank my teachers who helped me shaped my academic life and
I would like to express my gratitude to Dr. Robert Nagel for accepting to review my
work as a committee member at a late stage, inspire of his imminent retirement. His insights
and queries during the outline discussion helped me a lot during my writing.
I would like to thank Dr. Gracious Ngaile for taking time out of his busy schedule
(numerous times) and listening patiently to me every single time. His thoughts and guidance
helped shape this thesis.
I would also like to thank Dr. Richard Johnson and Dr. Ewan Pritchard for providing
their expert guidance, going out of their way, in different stages of this thesis. I can, honestly,
say that this effort would not have been possible without their help.
Last, but definitely the biggest ones, there are 2 important people without whom none
of this would have been possible. One is my advisor, Dr. Eric Klang. His support and his
encouragement during the bad days are definitely, unparalleled. His effort in helping me
build a thesis, in a field which is not is part of his expertise, deserves more than a note of
gratitude. I feel blessed to have worked under such a wonderful person. The other person is
my ‘better half-to-be’, Vidya Seshadri. From my high school days to this moment, she is
responsible for my every single success.
TABLE OF CONTENTS
LIST OF TABLES ... viii
LIST OF FIGURES ... ix
LIST OF SYMBOLS & ABBREVIATIONS ... x
1. INTRODUCTION ... 1
1.1. Importance of Automobile AC systems and its adverse impact on vehicle performance ... 1
1.1.1. Significance of effective modeling of automobile AC systems ... 3
1.1.2. Introduction to EcoCAR ... 4
1.1.3. Introduction to High Voltage Automotive AC systems ... 5
1.1.4. Market demand on hybrid conversions ... 7
1.2. Statement of Intent ... 8
1.3. Approach ... 8
2. LITERATURE REVIEW ... 10
2.1. Previous literature on automobile AC systems design, modeling and passenger comfort ... 10
2.2. Previous literature on automobile AC components ... 11
2.3. Previous Literature on heat load calculations for automobiles ... 12
2.4. Previous literature on adverse impact of air conditioning on vehicle performance ... 14
2.5. Previous literature on reduction of vehicle cooling load ... 15
2.6. Conclusion ... 15
3. VEHICLE HEAT/COOLING LOADS CALCULATION ... 17
3.1. Introduction ... 17
3.2. Calculation approach ... 17
3.3. Data procurement for calculation ... 18
3.3.1. Vehicle physical characteristics ... 18
3.3.2. Ambient conditions ... 19
3.3.3. Glazing ... 19
3.3.4. Solar irradiation ... 20
3.3.5. Vehicle state & Occupants ... 20
3.3.6. Conditioned air characteristics ... 21
3.4. Cab temperature estimation at end of 2 hours of parking ... 21
3.4.1. Solar irradiation data ... 22
3.4.2. Heat gain calculation ... 24
3.5. Vehicle heat load ... 31
3.6. Conclusion ... 34
4. PERFORMANCE ANALYSIS USING ADVISOR ... 36
4.1. Introduction to ADVISOR... 36
4.2. Performance Analysis ... 38
4.2.1. Determination of accessory electrical load ... 38
4.2.2. Vehicle Modeling ... .42
4.2.3. Setup ... 46
4.2.4. Simulation & Results ... 47
4.3. Conclusion ... 55
5. REDUCTION OF VEHICLE COOLING LOAD ... 57
5.1. Introduction ... 57
5.1.2. Reduction of heal load from outside air ... 59
5.1.3. Reduction through interior design improvements ... 60
5.1.4. Reduction through opaque surface ... 60
5.1.5. Reduction through insulation ... 61
5.2. Conclusion ... 61
6. AC SYSTEM AND COMPONENTS ... 62
6.1. Type of AC system ... 62
6.1.1. Vapor compression cycle ... 63
6.2. Type of Refrigerant ... .67
6.3. Components ... 67
6.3.1. Compressor... 67
6.3.2. Heat Exchangers ... 76
6.3.3. Expansion Valve ... 77
6.4. Component location ... 79
6.5. Conclusion ... 80
7. FUTURE WORK ... 82
8. CONCLUSION ... 84
9. REFERENCES ... 85
10. APPENDICES ... 89
LIST OF TABLES
Table 1. Time and temperature - (4 PM - 6 PM) ... 23
Table 2. Net Heat gain between 4 PM and 6PM... 27
Table 3. Temperature difference and Cab temperature ... 28
Table 4. Temperature difference and Final Cab temperature (11 AM - 1 PM) ... 30
Table 5. State Values of the AC system ... 41
Table 6. Results comparison ... 55
LIST OF FIGURES 1. INTRODUCTION
Figure 1. 1. GM donated Chevrolet Malibu ... 5
Figure 1. 2. Belt driven Automotive AC system ... 6
3. VEHICLE HEAT/COOLING LOADS CALCULATION Figure 3. 1. Hour Vs Temperature ... 22
Figure 3. 2. Time of the day Vs Final Cab Temperature (4 – 6 PM) ... 29
Figure 3. 3. Time of the day Vs Final Cab Temperature (11 AM - 1 PM) ... 31
4. PERFORMANCE ANALYSIS USING ADVISOR Figure 4. 1. ADVISOR - Matlab File snapshot ... 37
Figure 4. 2. HV-AC system ... 39
Figure 4. 3. Biodiesel values in Matlab file ... 43
Figure 4. 4. Vehicle model – ADVISOR ... 45
Figure 4. 5. UDDS Cycle ... 46
Figure 4. 6. 0 W Accessory electrical load ... 48
Figure 4. 7. 700 W Accessory electrical load ... 50
Figure 4. 8. 1400 W Accessory electrical load ... 51
Figure 4. 9. 2100 W Accessory electrical load ... 52
Figure 4. 10. 2800 W Accessory electrical load ... 53
Figure 4. 11. 3500 W Accessory electrical load ... 54
Figure 4. 12. Results ... 56
6. AC SYSTEM AND COMPONENTS Figure 6. 1. Vapor compression cycle ... 64
Figure 6. 2. Cascade vapor compression cycle ... 65
Figure 6. 3. Multi stage vapor compression cycle ... 66
Figure 6. 4. Classification of compressors ... 69
Figure 6. 5. Comparison between belt driven compressors & electrical compressors ... 70
Figure 6. 6. Fuel economy comparison ... 71
Figure 6. 7. Under the hood ... 74
LIST OF SYMBOLS & ABBREVIATIONS
1. CO2: Carbon dioxide
2. VOC: Volatile organic compounds 3. AC: Air conditioning
4. IC: Internal Combustion 5. TR: Ton of Refrigeration
6. USEPA: United States Environmental Protection Agency
7. ASHRAE: American Society of Heating, Refrigerating and Air Conditioning Engineers 8. CFM – Cubic feet per minute
9. V: volume, m3 10. HV: High voltage
11. ESS: Energy Storage system
12. ADVISOR: Advanced vehicle simulator 13: NREL: National renewable energy laboratory 14. m: meters
15. CLTD: Cooling load temperature difference 16. SCL: Solar cooling load
17: CLF: Cooling load factor 18. Q: Heat gain, W
19. A: Area, m2
20. U: Overall heat transfer coefficient, W/m2. K 21: Tcab: Vehicle cabin temperature, °C
22: Tamb: Ambient temperature, °C 23: ṁ: Mass flow rate, kg/s
24. CFH: Cubic feet per hour 25. α: absorptivity
26. τ: transmissivity
27. I: specific enthalpy, J/kg.K 28. γ: angle of incidence, degrees 29. ρ: reflectance
30. ∑: Surface tilt angle to horizontal, degrees 31. HEV: Hybrid electric vehicle
1. INTRODUCTION
Automobile vehicle technology has been steadily moving towards alternate vehicle
technologies due to a variety of reasons ranging from rapid depletion of non-renewable
resources to global warming issues. The advantages are aplenty and the passenger car
manufacturers have understood that hybrid vehicles are here to stay. There has been a steady
increase in the number of hybrid or fully electric passenger car models in the last decade.
Many conventional IC engine models have hybrid variants as well. Still hybrid vehicle
technology is primarily viewed as a vehicle propulsion technology. The vast reserve of
hybrid/electrical technology could also be tapped to energize vehicle accessory systems
instead of relying on the usual 12V auxiliary battery and/or the power derived from engine.
The air conditioning system is one such system and is also the accessory which extracts the
largest quantity of power from the engine. In the following sections, the motivation behind
the entire thesis is explained by reasoning out the needs of an effective automobile air
conditioning system.
1.1.
Importance of automobile AC systems and its adverse impact on
vehicle performance
An automobile air conditioning system is an integral member of automotive systems
because it is not only responsible for the thermal comfort of a passenger but also the safety of
the passenger, to an extent. The primary purpose of an automobile air conditioning system is
It is also responsible for recirculation of air inside the cabin and preventing stagnation of
stale air which will consist of CO2 from the passengers, VOCs and other particulate contaminants.
Modeling of automobile air conditioning system varies from an ordinary AC
system of buildings due to various reasons. Dynamicity of the ambient conditions, more
occupancy per unit area, more glass windows per unit volume are few of the reasons which
complicate of the modeling of automobile air conditioning systems. Once the initial
modeling issues of adapting HVAC design of buildings to automobile AC systems is
circumvented, focus shifts to finalizing the optimum amount of air conditioning required to
provide cooling. Passenger vehicles manufacturers are, generally, accused to have over sized
AC systems. Conventional automobile AC systems draw their power from the engine in the
form of belt driven compressors. Hence, oversized systems tend to draw more power from
the engine resulting in lesser fuel economy and also higher emissions. Research suggests that
for vehicles with higher fuel economy, air conditioning systems at peak load will reduce fuel
economy by 50% and increase emissions considerably (Nox by nearly 80% and CO by 70%).
Farrington and Ruth record in their paper that the power to drive the compressor could be as
high as the power to drive the vehicle at a constant speed of 35mph[1]. They also observe
that a vehicle might use 612 gallons of gasoline on an average per year. More gasoline means
more emissions. Vehicle owners are spending a lot more on fuel and spare parts unknowingly
and governments are fighting adverse environmental after effects of automobile air
conditioning. This could be ‘nipped in the bud’ with effective modeling. Further evidence of
1.1.1. Significance of effective modeling of automobile AC systems
Modeling of automobile AC system is one section which has received the least
attention from automobile manufacturers. There have been minimal changes to the
fundamental design of AC systems over the past 5 decades. The term “effective” is included
in the title because the objective is to shed light on the areas that need improvement in
automobile AC modeling. There are 2 important sections which suffer due to ill advised
modeling. One is, as explained in the previous section, vehicle performance and emissions.
Other is the comfort of the passengers.
Though AC systems affect fuel economy and emissions, vehicle performance testing
is usually done without the AC system. In 1995, a technical report of the U.S.E.P.A detailed
the needs to include an emissions test which will test the vehicle emissions with the AC
system running [2]. This resulted in the introduction of Supplemental Federal Test Procedure,
SFTP. SFTP had a phased introduction starting from 2001 with 25% of cars being subjected
to SFTP in the starting year. By 2005, all cars were subjected to SFTP [1]. This is a
significant step in AC modeling improvement because it will prevent over sizing AC
systems. At the same time, it will lead to improved research on heat load calculations for
automobiles which determine the size of an AC system. This will, in turn, result in finding
ways to reduce heat load of a vehicle.
Improper modeling compromises the thermal comfort and safety of a passenger in a
number of ways. Oversized AC systems tend to provide uncomfortable amount of cooling
and might also result in a drier cab condition than necessary. Undersized AC systems results
necessary duty cycle. Also, oversized systems will cause condensation and fogging of
glasses. Fogging is a safety issue. Even blowers used in AC systems need to be properly
sized because very high velocity of air through the vents tends to cause uneasiness [3]. Thus,
sufficient evidence has been provided to support the need for effective modeling.
1.1.2. Introduction to EcoCAR
EcoCAR, as explained in its website, is an advanced vehicle technology engineering
competition established by the United States Department of Energy and General Motors. The
first edition was conducted by Argonne National Laboratory. The second edition of the
series, “EcoCAR2: Plugging In to the Future”, is the competition concerned with this thesis. Students of 16 North American universities have to design and incorporate “advance vehicle
technology solutions” into GM donated vehicles. The solution should be able to reduce the
fuel emissions, improve fuel economy, vehicle energy efficiency while maintaining
acceptable standards of performance, utility and safety on the basis of consumer experience.
A properly working AC system is also part of the requirement and carries 25 points. 25
points will be awarded if the AC system is able to cool down the cabin air temperature by at
least a temperature of <5.5°C (10°F) under ambient conditions within 2 to 5 minutes.
The advanced vehicle technology adopted by NC State University EcoCAR team is series
powertrain architecture with a smaller engine in place of the engine in the GM donated car.
The car donated for EcoCAR2 is a stock Chevrolet Malibu. The competition, at this stage in
2012, is about to have the “Year One” competition. This end of the first year competition is
conducted to evaluate the team’s design and analysis. The team does not get the vehicle till
this stage and in this thesis, are all based on CAD files provided by GM and various other
sources.
Figure 1. 1. GM donated Chevrolet Malibu
1.1.3. Introduction to High Voltage Automotive AC systems
The quintessential hybrid passenger vehicle, Toyota Prius, is an excellent advocate to
the success of HV-AC systems. As explained earlier, conventional automobile AC
compressors are belt driven off the engine. The compressor creates very low pressure in its
inlet and sucks in the saturated vapor from the evaporator. The vapor is compressed into a
high pressure superheated vapor which will drop the heat gained across the condenser.
Saturated liquid flows out of the condenser and into the expansion valve/orifice tube where it
Figure 1. 2. Belt driven Automotive AC system
HV-AC system is similar except for the fact that, the compressor is driven by a motor
powered by the energy storage system (ESS) on board. These are usually hermetic
compressors. The motor of the compressor is driven using the AC power supplied through a
3 phase AC inverter. Caution is required while working with these HV systems as they could
prove to be fatal. There are numerous advantages to such a system which will be explained
1.1.4. Market demand on hybrid conversions
With increasing fuel prices and high level of consumer awareness on emission issues,
the interest in hybrid vehicles has risen steadily in the past decade. As mentioned earlier,
high profile and established automobile manufacturers like GM, Toyota, Honda, Ford,
BMW, etc. have been developing hybrid models or creating hybrid variants from
conventional models. The sports utility vehicle from Ford, Escape is an example of hybrid variants of existing IC engine models. Hybrid models have gradually increased to a market
share of around 3% of all vehicles sold in the later part of last decade. Though the increase in
number of models has provided the consumers with a wide variety of options, there has never
been a dramatic increase in the demand. Experts feel that the main reason is cost. When
buyers can opt for an IC engine which offers more value for money at the same cost, the
competition becomes one-sided [4].
An indirect consequence of this issue is people trying to convert their old vehicles
into hybrids. A testimony to this fact could be increasing number of online forums where
people discuss and get opinions to convert. A number of companies are trying to use this
opportunity to build a stable market out of such conversions. Some of these companies did
their first conversion even before Prius was announced. Evtransportal.org provides a list of such conversion companies [5]. Most of these companies have fleet vehicle conversions as
their major focus, passenger vehicle conversions will be their target. A recent interaction
with an executive from one such company confirmed their desire to foray into passenger
vehicle segment. AC systems will not need much attention in case of fleet vehicles but it is
affect the fuel economy more in case of vehicles with more fuel economy. Simulations and
tests conducted on hybrid and conventional gasoline vehicles prove the fact [6].
1.2. Statement of Intent
The objective of the previous sections in this chapter is to build a reasonable
foundation to explain the intention behind this thesis. The purpose is to model, select
components and retrofit an AC system for a hybrid vehicle-convert. This exercise will be
attempted on EcoCAR2. The constraints are the team’s design targets and competition
requirements. The team’s design targets are primarily higher fuel economy, lesser emissions,
better passenger comfort and vehicle performance. Competition requirement has already
been outlined in the “Introduction to EcoCAR” section. The numbers behind the team’s
design targets will be outlined in the following sections.
1.3. Approach
Any air conditioning system design process starts with the calculation of cooling
needs. The cooling load calculation inputs include details about geographical location of
vehicle, orientation of vehicle, hour of the day, vehicle interior & exterior specifications,
vehicle condition and ambient conditions. Once the required tonnage has been calculated, the
performance of the vehicle with AC as the accessory load will be tested using ADVISOR, a
vehicle simulation tool developed by NREL. The simulation results will be analyzed to
determine the adverse impact on the vehicle performance and determine the accessory load
applied, in order to size the AC system appropriately. The reviewed cooling load will be used
to determine the compressor mass flow rate, cubic capacity and the rest of the components.
The compressor physical size will be chosen to suit the space available under the hood and
vehicle weight limitations (Team target). Further recommendations on other components will
also be provided.
2. Literature Review
2.1. Previous literature on automobile AC systems design, modeling and passenger comfort
AC systems modeling for automobiles vary considerably from AC systems modeling
for building. There are numerous books and papers available for AC systems modeling.
However, automotive AC systems are given less to no attention at all in most of these books.
ASHRAE handbook- HVAC applications, 2007 gives a brief and excellent introduction to Automotive AC systems, important variables to consider while modeling it and its
components[3]. For further understanding of automotive air conditioning systems, Boyce
H.Dwiggins’s Automotive air conditioning and Steven Daly’s Automotive air-conditioning
and climate control systems provide ample information on the subject[7][8]. Still, even these books do not provide a detailed understanding about the modeling steps and methods for
these systems.
Chapter 9 of The CRC Handbook of Mechanical Engineering, Second Edition offers
quick and precise information on AC systems, the different types of AC systems, air
conditioning processes and cycles, components involved, design criteria, load calculations
and various other basics involved with air conditioning[9]. Alternative Technologies for Automobile Air Conditioning, a paper by B. Multerer and R. L. Burton is very
comprehensive. It explains about AC sizing and heat load reduction. The paper also
compares and analyzes in detail, the different types of available automotive air conditioning
differ in control strategies and present a virtual model of vehicle compartment and the
variations of many state properties including vehicle compartment temperature and humidity.
The paper helps us understand the intricacy of automotive AC system modeling and also its
relative complexity when compared to an residential AC system modeling [11].
Evaluation of Advanced Automotive Seats to Improve Thermal Comfort and Fuel Economy by Jason Lustbader, explains about the importance of modeling seats to provide better thermal comfort and thereby aid effective AC modeling. In a specially developed
laboratory by NREL, tests were conducted on the effect of improved seating. The results
proved that a reduction of around 4°C for the contact temperature was possible with an
advanced seat and a low mesh mass back seat.[12]. The author uses ADVISOR to enumerate
an increase of 4.5% on an EPA city cycle due to these changes. Similarly, the advantages and
the impact of effective AC modeling on the thermal comfort of the passengers are elaborated
in Julian Weber’s Automotive development processes: processes for successful customer
oriented vehicle development [13]. Eugene Talley’s Hybrid Air Conditioning Systems Overview deals with hybrid and electric air conditioning systems. The paper provides an overview of AC systems in hybrid models in the market, electric compressors in AC systems
and hybrid compressors[14]. A web article by Dave Hobbs, Mastering Hybrid HVAC
2.2. Previous literature on automobile AC components
Alternative Technologies for Automobile Air Conditioning, gives a good introduction to hermetically sealed electric compressors and scroll compressors (most common
compressor in automotive AC systems nowadays)[10]. Eugene Talley’s paper and Dave
Hobbs’s article, provide good exposure to electrical compressors, compressor manufacturers
and their functioning[14] [15].
For information on conventional AC components, HVAC handbook by
Robert.C.Rosaler and Heating and cooling of buildings by J.F.Kreider et al discuss in detail about these components, their functioning and design in entirety[16][17].
2.3. Previous Literature on heat load calculations for automobiles
Heat load calculation for buildings is an area which has been thoroughly researched
and the information available on this topic is widespread. But heat load for automobiles has
not received as much attention as it warrants. Heat load calculation of buildings and
automobiles vary in numerous ways. One of the earliest papers concerning heat load
calculations of automobiles is Analysis on Air-Conditioning Heat Load of a
Passenger Vehicle. It is a pioneering paper which covers the topic completely and helps to understand the methodology behind heat load calculation of automobiles[18]. Different kind
of contributing factors to heat load and impact of vehicle conditions are explained clearly.
In the efforts to build an automobile passenger comfort model, Ingersoll et al, explain the vehicle cab cool down calculation. It is another excellent resource for cooling cold
calculation procedure. They built a virtual thermal comfort model which solves to predict the
thermal comfort of a passenger considering inputs ranging from clothing of the passenger to
the speed of the vehicle[19]. Zheng et al provide a step by step procedure to calculate the vehicle heat load using Microsoft Excel. They use the CLTD/CLF/SCL method to calculate
the heat gain through the vehicle body and glazing, heat loss through convection, heat gain
through infiltration, utilities and occupants. Once the vehicle heat load was calculated
theoretically, vehicle testing was done to compare the values under specific conditions
similar to the theoretical calculation [20]. Previously mentioned Alternative Technologies for Automobile Air Conditioning also summarizes a brief vehicle cooling load calculation values without explaining the calculation methodology. Malik and Bullard give an account about
cooling load contributing factors without providing any calculations. The paper is
specifically for hybrid electric vehicles and explains about AC load during intermittent stops
in a duty cycle (signal stops) They calculate the vehicle heat load using a technique similar to
above mentioned papers and employ ADVISOR to compare heating/cooling options based
on energy efficiency. They conclude that an effective AC system on a HEV should consume
only about 3-4 gallons/year during traffic stops [21].
Heat load through the glass is a major contributor to the vehicle cooling load due to
the high percentage of glass in vehicle cab surface area. Above mentioned papers in this
section provide brief information about calculating the glass heat load. For a more focused
Parker and Spitler is a preferred book among experts. ASHRAE handbook cites the book as a
reference. The book explains methods to calculate solar irradiation depending on hour of the
day, incidence angle, material, etc. and provides examples to elaborate the same[22]. Another
book which offers excellent material on the same subject is Solar engineering of thermal processes by Duffie et al. It talks in depth about solar radiation through glass and its effects on the heat load [23].
2.4. Previous literature on adverse impact of air conditioning on vehicle performance NREL has published considerable research papers on this topic. Impact of Vehicle Air-Conditioning on Fuel Economy, Tailpipe Emissions, and Electric Vehicle Range, by Farrington and Rugh highlights the problem with the help of simulations run on ADVISOR.
The paper elaborates on the different tests run, the drive cycles used and the required vehicle
specifications. Using ADVSIOR, they compared a conventional IC engine powered vehicle,
an electrical vehicle and a hybrid vehicle to prove that the impact of AC systems on fuel
economy and emissions is worse. The tests are run on 4 different duty cycles and all four
cycle results are compared to form the above conclusion [1].
V.H. Johnson, in her paper, explains the impact of air conditioning on vehicle fuel
economy and approaches the problem through thermal comfort. Obtaining TMY data from
the NSRDB for a particular region for a specific time and day, she models a passenger
thermal comfort which could predict passenger’s comfort and thereby, produce an
approximate value for the time for which AC is switched on. This time is used to predict the
2.5. Previous literature on reduction of vehicle cooling load
Farrington and Rugh outline the methods briefly in their paper and explain
opportunities to reduce vehicle cooling load. They tested the impact of an advanced UV and
IR reflectance glass and advantages of using recirculated air to condition the vehicle
compartment. Results of these enumerate the reduction possible in the heat load.
An Overview of Vehicle Test and Analysis from NREL’s A/C Fuel Use Reduction Research, a
report presented at VTMS-8 provides a comprehensive view of the subject. NREL
researchers conducted tests by changing the insulation, ventilating a parked vehicle, using
solar reflective glazing and providing instrument panel cooling to reduce the vehicle heat
load. The results of their test prove that a considerable reduction is possible [25].
2.6. Conclusion
Automotive air conditioning has been around since the late 1930’s and has not
changed a lot in terms of operations and components. ASHRAE handbook and other HVAC
handbooks provide the required amount of data to understand the various types of AC
systems and components. As mentioned earlier, it was not until recent, that the adverse
impacts of AC systems on performance have received the required amount of attention.
NREL has been a leader in this field and it is evident from the number of papers produced by
researchers associated with NREL.
The areas, pertaining to this thesis, that require more literature or focused research
work, are methods to reduce vehicle cooling load, modeling an automotive AC system and
section are informative but this is a significant area which requires much more attention in
order to improve AC modeling and performance. Papers which detail the ill effects of over
sizing air conditioning systems for automobiles are required. Instruction or approach to
model an automotive air conditioning system is another area which lacks material. Books,
journal articles and magazine papers explain design of components and selection criteria.
But none of them explain design specifications to cater to a specific cooling load or ways to
pick components based on cooling load. This is a very important topic because wrong
component selection could lead to disastrous performance both on the vehicle front and the
AC front. Also, concentrated research on methods to reduce vehicle cooling load could
benefit automotive AC system and automobiles on the whole as they will reduce fuel
3. Vehicle cooling loads calculation 3.1. Introduction
The first step in retrofitting an automotive AC system to the Hybrid-convert is
calculating the vehicle cooling load. Steps to do the calculation for a generalized vehicle will
be explained in the following section. The cooling load for the EcoCAR2 vehicle has been
calculated as an example to aid the explanation and also, because, EcoCAR2 is the prime
focus of this research endeavor.
3.2. Calculation approach
Traditional approach to vehicle cooling load/heat load calculation involves picking a
time of the day, geographical location, ambient conditions and vehicle state (stationary or
moving) for the calculation. Then information on vehicle physical specifications and various
materials in the car (seats, dashboards, etc.) are gathered from the vehicle. Since the vehicle
was not available, most of these values had to be derived from the CAD files available with
the EcoCAR2 team. Some information like materials of seats, windows and dashboards was
assumed. To compensate for assumptions involved in the vehicle calculation, the traditional
approach was altered slightly to include heat gain due to parking in an open garage under
direct sunlight. This will take care of any shortfalls in the heat load calculation. To check if
the adjustment is reasonable, at the end of the calculation, comparison with heat load of a
3.3. Data procurement for calculation
For a vehicle cooling load calculation, the inputs required were split into six categories.
1. Vehicle physical characteristics
2. Ambient conditions
3. Glazing surfaces
4. Solar Flux
5. Vehicle state and occupants
6. Conditioned air characteristics
3.3.1. Vehicle physical characteristics:
1. Type of vehicle: Type of vehicle is the input which will specify if it is a 2 seater or
a 4 seater, a passenger vehicle or a fleet vehicle. The significance behind the passenger or
fleet vehicle specification is the difference in air conditioning requirements for different
vehicles. The vehicle used in the calculation was a 4 seater passenger vehicle.
2. Vehicle geometry: Vehicle geometry is obtained from the CAD file obtained by the
EcoCAR2 team from GM. The required vehicle geometry inputs are
1. Length of vehicle cabin at floor level: 1.566 m
2. Width of vehicle cabin at floor level: 1.465 m
3. Height of vehicle cabin from floor level: 0.97 m
4. Dashboard material: No information was available and hence, ABS plastic
the most common dashboard plastic material was chosen for the calculations. The dashboard
area was approximated using common knowledge and the width of the car. ABS material
5. Seat material: Since the vehicle is not available, seat material of the vehicle
base model was obtained from the vehicle website [27]. Seat material chosen was leather.
Properties for leather were obtained from internet[28].
3.3.2. Ambient conditions:
A very important step in the cooling load calculation process is selection of the
ambient conditions.
1. Geographical location: Usual expectation among vehicle users/designers is that the
thermal comfort should not be compromised during Arizona summers or the Canadian
winters. The one extreme that concerns this thesis is the Arizona summer. Added to that, the
EcoCAR AC testing will be conducted at Mesa, Arizona which is close to Phoenix. Hence
the city chosen was Phoenix, Arizona. The geographical location of Phoenix, Arizona is
33° 26' 53" N / 112° 4' 23" W.
2. Day and time: July 21 was chosen because it is the only date for which ASHRAE
handbook has the required data for calculation. Time of the day was chosen by a trial and
error method which will be elaborated upon later.
3. Orientation of passenger compartment: 0° East.
3.3.3. Glazing:
As mentioned earlier, heat load through the glass contributes to a major portion of the
vehicle heat load. Hence, glass properties require proper attention during the calculation.
1. Glass surface area: The area covered by glass was calculated from the CAD files.
Front door side window: 0.11 sq.m.
Windshield: 0.88 sq.m.
Rear window: 0.856 sq.m.
2. Thickness of the glass: 3-5 mm.
3. Type of glass: Tinted single pane glass. The values for the glass was obtained from
[22].
3.3.4. Solar irradiation:
Values pertaining to the specific time and day are obtained from NSRDB[29].
NSRDB has solar radiation data which can be accessed by the public. Typical meteorological
year (TMY) data is acquired from 1961-1990 and 1991-2005 National Solar Radiation Data
Base (NSRDB) archives. TMYs are hourly data sets of solar radiation and meteorological
data over a 1 year period. They are averages and do not represent extremes. Hence, these data
are not suitable for calculating worst case scenarios. The data is available for 1020 locations
and Phoenix, Arizona is one of them. The data will be provided in the following calculation
section.
3.3.5. Vehicle state & Occupants:
Vehicle was considered to be in motion at a steady 35 mph (56.32 kph) moving in the
same direction as it was parked (0° East). A driver and a passenger in the front seat with
summer clothing were considered to be inside the vehicle. The level of activity for the driver
and passenger are driving and sitting respectively. The respective heat gains was obtained
3.3.6. Conditioned air characteristics:
1. Volume rate: ASHRAE standard 62, Ventilation for Acceptable Indoor Air Quality, provides data on required occupancy and air requirements. A table dedicated to outdoor air
requirements for ventilation of vehicles provided in the standards was used to obtain the
required numbers[30].
2. Percentage of Outside air: AC systems could condition 100% outside air, 100 %
recirculated air or a mixture of both. Depending on the difference in the ambient and cab
conditions, the load on AC could get higher or lower. For EcoCAR, the rules prescribe 100%
recirculated air at full fan speed.
3. Cab conditions: Cab condition inputs include cab temperature and relative
humidity. The cab temperature was estimated from a calculation shown in the following
section. Relative humidity was not considered because of the very dry climate of phoenix and
humidifiers are not part of the heat load calculations.
3.4. Cab temperature estimation at end of 2 hours of parking
The cab temperature estimation is a bulk modeling analysis conducted to estimate the
average temperature of the cab materials (including air). The bulk modeling clubs together
the seats, the cabin air, the dashboards, glass surface and the floor carpets. This simplifies the
calculation while maintain reasonability because when considered individually each of the
cab components differ in the temperature. The dashboard and steering wheel could easily be,
80-100 °C and cabin air temperature could go as high as up to 60 °C [31]. Hence, the bulk
3.4.1. Solar irradiation data
The TMY hourly data was obtained for July 21for Phoenix, Arizona from TMY 3
data files. The file includes an enormous amount of data. Of which, the ones required for the
calculation has been listed out in the appendix section. The first and foremost information
required is the ambient temperature on July 21. To obtain a better resolution for the
calculation, interpolation of data was done to acquire temperatures for every 15 minutes. This
was done using MS Excel and a snapshot of the Excel graph has been shown below.
The time of the day chosen was 4 – 6 PM and the car was assumed to be parked
between the hours under the sun in an open garage. The temperatures between 4- 6 PM
obtained after the interpolation was
Table 1. Time and temperature - (4 PM - 6 PM)
These temperatures were adjusted to make sure the mean temperature of the actual
and interpolated data remain the same. The mean temperature of the actual data was 35.3°C
and the interpolated data was 33.9°C. The mean temperature was then brought up to 35.3°C.
Time (PM) Temp (°C)
4 41.2
4.15 41.3
4.30 41.4
4.45 41.5
5 41.5
5.15 41.6
5.30 41.6
5.45 41.6
3.4.2. Heat gain calculation
The heat gain/loss during the 2 hours of parking was split into different categories as
mentioned below:
1. Heat load through the roof, doors
2. Heat load through the glass
4. Heat load due to radiation
5. Heat load due to convection
Heat load calculation method: There are, basically, 3 methods of heat load calculation. They
are
1. Total equivalent temperature differential method
2. Transfer function method
3. CLTD/SCL/CLF method
CLTD/SCL/CLF method is the popular method of all the 3, as mentioned in ASHRAE
handbook Fundamentals [32]. It is also the preferred method amongst heat load calculation experts[19][20][9]. Since the calculation is largely based on the above citations, CLTD was
the method chosen. The method has been explained in the following section.
CLTD/SCL/CLF Method:
CLTD is a method which considers the impact of temperature difference between the
ambient conditions and the vehicle compartment conditions, the range of the day’s
temperature, solar irradiation and the heat stored in the vehicle mass to calculate a theoretical
factors. The time of the day, the day of the year, the orientation of the material and the glass
will also be accounted for.
There is a time lag between the solar irradiation entering the AC controlled space and
the radiant energy becoming a cooling load. CLF accounts for this important fact. SCL
accounts for heat transmission by the glass surfaces.
1. Heat load through the roof, doors:
Heat load through the roof and doors (excluding the glass) of the vehicle cabin is
calculated by using the following formula.
Qroof = Aroof*Uroof*CLTD --- ① Similarly, Qdoor = Adoor*Udoor*CLTD
(i) The roof and door area were obtained from the CAD files.
Adoor = 1.54 sq.m. (On each side); Aroof = 1.70 sq.m.
(ii)The coefficient of convection, U was determined using a formula prescribed in
[18].
Uroof = 2.63*(Tcab - Tamb) 0.25; Udoor = 1.98*(Tcab - Tamb) 0.25
(iii) The CLTD values were obtained from ASHRAE handbook fundamentals [32].
CLTD was corrected, as per ASHRAE instructions, before being used in the formula.
The calculation was performed for every 15 minutes between 4 and 6 PM. The values
are available in the appendix.
2. Heat load through the glass
The heat load calculation through the glass can be split into 2 categories:
2. Heat load calculated through SCL.
(i) Heat load through CLTD: This is similar to the calculation in the previous section.
The convection coefficient U was found out using,
Uglass = 1.98[(Tcab-Tamb)*cos (θ – 90)] 0.25
(ii) Heat load through SCL: Since glass is a transparent object and allows solar
radiation through to heat the interior, Solar cooling load factor (SCL) has to be calculated.
SCL is calculated using the following formula,
Qglass, SCL = A*SC*SCL
SC and SCL values were obtained from [32]. The glass, as mentioned before, was
assumed to be a single pane glass. The windshield is considered to be 0% tinted and the other
glasses (windows, rear glass) are considered to be 60% tinted.
3. Heat gain through convection
Convection through the glass, doors and windows can be calculated using the
formula,
Qconv = U*A*(Tcab - Tamb)
The calculation was performed in MS excel and the values are listed in appendix.
4. Heat loss through radiation
Heat loss through radiation occurs from the body and the glass. The body’s radiation
capacity depends on the color of the body.
Radiation loss was calculated using,
Qrad = ε*σ*(Tcab4-Tamb4)
5. Net heat gain and temperature rise
(i) Heat loads from the previous sections were summed up to obtain the net heat gain.
Qnet = Qroof + Qdoor + Qglass + Qglass, SCL + Qconv + Qrad The Qnet values between 4 – 6 PM are tabulated below.
Table 2. Net Heat gain between 4 PM and 6PM
Time (PM) Qnet, W
4.00 1405.66
4.15 -737.57
4.30 -154.32
4.45 -38.61
5.00 -70.35
5.15 -153.67
5.30 -47.51
5.45 -15.59
6.00 -144.23
` The values, shown above, were obtained when the initial cab temperature, Tcab was
assumed at 50°C.
(ii) Temperature rise calculation: The corresponding temperature rise was calculated
Q = ṁ *cp*Δt
Since this is a bulk modeling analysis, ṁ*cp is actually ∑ [(ṁ air* cpair) + (ṁ glass* cpglass) + (ṁ body* cpglass) + (ṁ interiors* cpinteriors)]. The Δt and the respective Tcab calculated corresponding to Table 2 are provided below.
Table 3. Temperature difference and Cab temperature
Time Δt, °C Tcab, °C
4.15 14.96 64.96
4.30 -7.85 57.11
4.45 -1.64 44.46
5.00 -0.41 55.05
5.15 -0.75 54.30
5.30 -1.64 52.67
5.45 -0.51 52.16
6.00 -0.17 52.00
To verify the calculations and that the assumptions made were not too radical, the
Figure 3. 2. Time of the day Vs Final Cab Temperature (4 – 6 PM)
The above graph was formed using values calculated for every 15 minutes between 4
– 6 PM with the initial cab temperatures ranging from 35 °C - 52 °C. The graph depicts that
irrespective of the initial cab temperature, the cab temperature tends to reach an equilibrium
temperature around 52°C at 6 PM. This suggests that the assumptions are proper and also,
that the initial cab temperature selection does not impact the heat load calculation.
Armed with the cabin temperature rise value, a preliminary vehicle cooling load
calculation was conducted to determine if the final cab temperature was reasonable. The
vehicle cooling load was found to be around 1 KW. Comparing this to common peak heat
load values calculated in other papers for sedans, it was found to be at least 50% less than
commonly obtained values. The reason behind the disparity was that the time period chosen
for the calculation was not the most suitable for a heat load calculation. Though 4 – 6 PM
occurs during noon. Hence, the entire calculation was repeated for time period between
11AM – 1 PM. The net gain and Δt values for a initial cab temperature of 50°C
corresponding to 11 AM – 1 PM are tabulated below. Also, a graph of temperature variation
over the time period similar to the one in Fig# has been provided.
Table 4. Temperature difference and Final Cab temperature (11 AM - 1 PM)
Time (PM) Net Gain, W Δt, °C Tcab, °C
11.00 -25.45 - 50
11.15 -131.44 -0.27 49.73
11.30 -30.77 -1.40 48.33
11.45 4.74 -0.33 48.00
12.00 14.51 0.05 48.05
12.15 86.06 0.15 48.20
12.30 42.63 0.92 49.12
12.45 26.39 0.45 49.58
Figure 3. 3. Time of the day Vs Final Cab Temperature (11 AM - 1 PM)
The heat load calculation for 11 AM – 1 PM was done and the calculation is shown in
the following section.
3.5. Vehicle heat load
The initial conditions used for the vehicle heat load calculation were:
1. Location: Phoenix, Arizona
2. Time & day: 1 PM, July 21st
The vehicle heat load calculation is very similar to the calculation done to find the
temperature rise. The heat load calculation was split, as before, into different categories:
i. Heat load through roof, doors, glass:
The heat load was calculated using the CLTD method and equation 1 was used to
determine the heat load. As before, solar cooling load factor of glass is also calculated. The
calculated values were
Qroof = 1838.90 W; Qdoors = 140.34 W; Qwindshield = -350.60 W Qrear glass= -418.42 W; Qside windows = -545.72 W;
Solar cooling load factor: Qwindshield = 101.16 W; Qrear glass = 149.69 W Qside windows = 80.55 W
ii. Heat load due to occupants:
The occupants assumed were a driver and a passenger in the front seat. A driver while
driving contributes 220 Watts and an idle passenger contributes 102 Watts. iii. Heat load due to infiltration:
Vehicle cabin is not a controlled volume and ambient air infiltrates the cabin through
various gaps. The heat load due to infiltration was calculated using the following
equation[20],
Qinfiltration = ṁ*(Icab - Iamb) Mass flow rate is estimated using [20],
ṁ = 1.5 * 40 cfh
Specific enthalpies, I, could be obtained from [33]
iv. Heat load due to absorption by interiors:
The solar radiation which passes through the glass will be absorbed by the vehicle
interiors. The absorbed heat will add to the vehicle heat load as it cannot be radiated back to
the atmosphere through the glass.
Qa = A*α*I*τ
(a) Calculation of solar radiation, I: It can be split into direct radiation and diffuse
radiation.
Direct radiation, ID = IND* cos γ (horizontal surface)
IND = A/ [exp (B/sin β)]; sin β = (cos l* cos d* cos h) + (sin l* sin d) For a vertical or inclined surface,
Iv = ID*ρ*[(1- cos ∑)/2]
The calculations are provided in the appendix section and the values obtained were,
Qa, windshield = 161.61 W; Qa, rear glass = 83.12 W; Qa, side windows = 22.04 W v. Heat load due to utilities:
The component which contributes to the heat load is the blower motor which is
present inside the dashboard. The heat gain value for a blower motor was obtained from [32].
Qblower = 439 W.
vi. Air conditioning load:
The load on the air conditioning system to cool the cabin was also taken into
account. The formula used to calculate the load was,
Qac = mair * cpair * Δtac
cpair – specific heat capacity of air in the cab, J/kg.K Δtac – required rate of temperature decrease, °C /s.
The rate of temperature decrease was set at 14 °C in 4 minutes to satisfy to EcoCAR2
competition requirements.
Qac = 2.5 *1008*.06 Qac = 147 W vii. Net heat gain:
Qnet = Qroof, CLTD + Qdoors, CLTD + Qglass, CLTD+ QSCL, glass + Qoccupants + Qinfiltration + Qinteriors absorption + Qutilites + Qac load
Substituting values from previous sections,
Qnet = 2175.2 W
The above value is the amount of cooling that AC system has to provide to reduce the
temperature of the cab by at least 6°C in less than 5 minutes.
3. 6. Conclusion
The vehicle cooling load, found above, was compared to cooling load values
calculated for similar vehicle [18] and then deemed reasonable. Noticeable exclusions from
the vehicle heat load calculation are latent heat load, heat load through radiation and heat
load through convection. Latent heat load was not considered because Phoenix is not a humid
place. Calculations of heat load through radiation were found to be negligible. Heat load
through convection causes depreciation of the net heat load until the vehicle cab temperature
It could also be argued that, for a humid place like Miami, the precautionary
peak heat load calculation will compensate for the extra latent load. Similarly when
convection contribution to heat load reaches a significant level, other loads such as interior
4. Performance analysis using ADVISOR
The adverse impact of air conditioning systems on vehicle performance has been well
documented in the initial sections of this thesis. This is, mainly, due to the amount of power
drawn from vehicle power sources. Air conditioning systems constitute a major portion of the
accessory power load on the engine, which could be as high as 7-8 bhp.
The first step in reducing the accessory power load on the engine is an efficient heat
load analysis. If the heat load analysis is not efficient, the vehicle will either have an over
sized or under sized AC system. Once the heat load analysis is done, the next step is
calculating the required amount of mechanical or electrical power to supply the necessary
cooling for the vehicle. In case of a conventional AC system, the load is mechanical. For
hybrid electric vehicles like a Toyota Prius, the load is electrical.
The objective of this chapter is to explain the benefits of a performance analysis for a
Hybrid-convert running with the accessory load of the air conditioning system. The analysis was done for the EcoCAR2 vehicle and the results will be discussed below.
4.1. Introduction to ADVISOR
The performance analysis of the vehicle was done using ADVISOR, ADvanced Vehicle
SimulatOR. ADVISOR was developed in 1994 by NREL to develop, simulate, analyze and understand hybrid electric vehicles. ADVISOR is, primarily, a tool that could analyze vehicle
powertrains and provide details on power flow among components. ADVISOR is user
ADVISOR was chosen for the analysis purpose because of various advantages.
Previous experience with the software and amount of ADVISOR expertise available were
major deciding factors. ADVISOR is very flexible and user friendly. Unlike most
commercially available component simulation and performance analysis software,
ADVISOR offers the user to work in the background, meaning, with the codes instead of the
graphical user interface.
The vehicle model in ADVISOR is made up of a number of .m files (Matlab
extension), each containing specific data on the vehicle. For instance, a snapshot from one of
the Matlab files which was used in the analysis, “Vehicle” data file is shown below.
The base file, originally, belonged to a Toyota Prius model. The numerical values
were changed to accommodate it to the EcoCAR2 hybrid-convert. The values in the above picture belong to the EcoCAR2 model developed for this analysis. Hence, flexibility was a
major advantage. Added to all these advantages, ADVISOR was a free software developed
by NREL, a government funded research lab.
4.2. Performance Analysis
Before developing the vehicle model in ADVISOR, the amount of electrical load on
the vehicle was determined. This was found out so that the performance could be analyzed in
incremental steps of electrical power load.
4.2.1. Determination of accessory electrical load
The electrical load could be determined from the amount of power required to run the
compressor. The compressor is the “heart” of any air conditioning system. The mass flow
rate of the refrigerant is an important factor in the performance of AC system and it is
dictated by the compressor. To determine the mass flow rate of the refrigerant,
Qin = mR134A*(h1-h4) Where
Qin: heat gain across evaporator, W. R134A: refrigerant
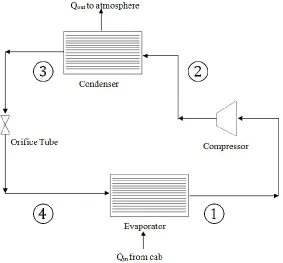
Figure 4. 2. HV-AC system
Using the Figure 4.2,
State 1: Saturated R134A Vapor from evaporator to compressor
Temperature, T1; Specific enthalpy h1; Specific volume, V1; State 2: Compressor super heated, high pressure vapor to condenser
Temperature, T2; Specific enthalpy h2; Specific volume, V2; State 3: High pressure saturated liquid to orifice tube
Temperature, T3; Specific enthalpy h3; Specific volume, V3; State 4: Low pressure, low temperature liquid to evaporator
Ideally,
Process 1: State 1 – State 2 (constant volume process)
Process 2: State 2 – State 3 (Isothermal process)
Process 3: State 3 – State 4 (Isenthalpic process)
Process 4: State 4 – State 1 (Isothermal process)
Assumptions for the calculation include:
1. Processes are ideal.
2. Temperature of refrigerant at evaporator, T1 = 12 °C. 3. Temperature of refrigerant at condenser, T3 = 100 °C.
Temperatures T3 and T1 assumptions are valid because it is common practice to have a difference of 10- 15 °F (6- 8 °C) between the refrigerant and the air which passes
though the heat exchanger. Since a temperature of at least 20 °C is desired at the outlet of the
evaporator and 80-90 °C is a common temperature under the hood[3], the assumptions were
deemed realistic.
Based on the assumptions and knowledge about the process,
T2=T3; T4=T1; h3=h4.
Also, V1=V2. But since volumetric efficiency of scroll compressors is, typically, around 90%, V2=V1*.90.
Table 5. State Values of the AC system
State Tsuffix, °C
Specific enthalpy,
kJ/kg
Specific volume,
m3/kg
Density,
kg/ m3
1 12 405.51 .04636 -
2 100 453.20 - 150.47
3 92 374.02 - 646.7
4 12 374.02 - 1253.3
Using the values in the above table, mass flow rate of refrigerant can be determined.
Since Qin = 2175 W (cooling load),
2175 = mR134A*(405.51 - 374.02) *103
mR134A = 0.07 kg/s
With the mass flow rate mR134A,
Electrical power required to run the compressor,
E = mR134A*(h2-h1) + heat loss Heat loss is, typically, 5-7% of the electrical load.
(1-.07) E = 0.07 (453.20-405.51)*103 E = 3590 W
This electrical load is the amount of power required to run the compressor to provide
analysis with accessory load being added in incremental steps of 700 W. The five step
analysis and the results are provided in the next section.
4.2.2. Vehicle Modeling
The vehicle model was built in ADVISOR using data procured from the EcoCAR2
team. The vehicle specifications used in the analysis are provided below:
Vehicle data:
Base weight: 950 kg
Frontal area: 2.3 m2; Coefficient of drag: 0.3; Weight fraction: 0.45 front/0.55 rear
Wheelbase: 2.738 m
Center of gravity: 0.569 m
Cargo mass: 140 kg
Engine Data:
A Kubota 1.5 L diesel engine is the engine chosen by the team. Due to the
non-availability of the engine physically, a 1.5L diesel engine, already available in
ADVISOR, was sized and modeled to suit the purpose.
Size: 1.5 L
Power: 44.2 bhp at 3000 rpm
Fuel used: Biodiesel.
Weight: 114 kg
Changes were made to the Matlab file to use biodiesel in the analysis. A snapshot of
Figure 4. 3. Biodiesel values in Matlab file
Driveline mode: Series
Battery Specifications: Li-ion battery with 6 modules. Weight: 151 kg
Nominal Voltage: 340V DC
Peak Discharge: 177 kW
Minimum pack energy: 18.9 kW-hr
Generator Specifications: Continuous power: 37 kW
Generator Specifications (Contd): Peak power: 80 kW
Voltage: 220 – 400 V DC
Weight: 33.5 kg
Motor Specifications:
Continuous power: 45 kW
Peak power: 103 kW
Voltage: 250 – 403 V DC
Weight: 66 kg
Radius: 0.34 m
Weight: 4 x 35 kg.
With the above specifications, the vehicle was built in ADVISOR. A picture of the
vehicle model built in ADVISOR is shown in the next page. Points to note with respect to
vehicle model are:
1. The number of battery packs in the model is 26, instead of the original 6. This was
done because of the specification of Li-ion batteries available in ADVISOR. Since the
battery model of A123 Li-ion batteries was not available, the available battery model was
altered to suit the requirement. The number of modules had to be increased to 26 to reach the
nominal voltage of 340 V DC.
2. ADVISOR selected the generator as per the series model developed and the
generator was sized to meet the requirement.
3. The transmission in the EcoCAR2 vehicle is automatic. But, ADVISOR does not
have automatic transmission options for series driveline option.
4. The vehicle gross weight was over ridden to reach 2182 kg which is the calculated
4.2.3. Setup
The most important step of the simulation setup is the selection of drive cycle. The drive cycle chosen to represent the
conditions is the Urban Dynamometer Driving Schedule (UDDS). UDDS is commonly known as “LA4” or “the city
test”[35]. This cycle is the perfect choice because it is used to test light duty vehicle testing. Also, EcoCAR2 team runs their
simulations with UDDS cycle. Other settings during the setup include allowing a linear correction of state of charge, SOC. A
4.2.4. Simulation & Results
Once the vehicle model was finished and the simulation was setup, the simulation
was run six times with incremental steps of 700 W from 0 W to 3500 W. Running the vehicle model over only one cycle of UDDS resulted in the vehicle running in pure electric mode.
Hence, the simulation was run twice over the UDDS cycle to get significant results. The
result was judged based on 2 factors. They are
1. Fuel Economy
2. History of SOC
Fuel economy is a very common term and does not require explanation. SOC, state of
charge is the value which indicates the percentage of charge remaining. 0% SOC means no
charge and 100% SOC means fully charged. Both these values where compared for each of
the six simulations.
Simulation results of 2 of these tests will be analyzed and discussed below to
understand the adverse impact of the accessory load.
1. Benchmark (No accessory load)
Fuel economy tests of commercial passenger vehicles are run without
switching on their air conditioning system. The EcoCAR team also determines the fuel
economy running a no accessory load test. The simulation result of the 0 Watt test is given
Tested by EPA, the Chevrolet Malibu stock vehicle’s fuel economy inside the city is 25mpg
(10.6 kpl) [36]. The vehicle designed by the EcoCAR2 team and modeled for this analysis
has an improved fuel economy of almost 36mpg (15.3 kpl). The SOC has reduced 15 % to
0.66 in 46 minutes (2 UDDS cycles).
2. Simulation Results
The results obtained from the rest of the 5 simulations are shown below. At the end of
4.3. Conclusion
It is evident from the results above or the tabulated comparison below, that the AC
system has an adverse impact on the vehicle performance. To produce target cooling of 2125
W or 0.60 TR, which is the vehicle peak heat load, nearly 3500 W of electrical power is
required. At 3500 W, the vehicle fuel economy drops 12.1 mpg and the SOC drops another
11%. This is less than the 25 mpg of the stock Malibu 2013 before the conversion.
Table 6. Results comparison
However, the entire simulation was run at a constant electrical load. Realistically, the
accessory load keeps varying according to the thermal comfort of the passenger.0.6 TR is
necessary, only, initially and once a steady, comfortable cab temperature has been reached,
Electrical load, W Fuel economy, mpg SOC at 46 minutes
0 (benchmark) 35.9 .66
700 32.4 .645
1400 29.9 .63
2100 27.5 .61
2800 25.6 .59
the load on the AC also drops linearly. Consequently, the electrical load drops. Hence, the
12.1 mpg drop in the fuel economy or the 11 % less SOC is strictly, a worst case scenario.
Figure 4. 12. Results
Thus, even with peak air conditioning load, the fuel economy of the Hybrid-convert is as high as the fuel economy of the original stock Chevrolet Malibu 2013. This could be