Available online: https://edupediapublications.org/journals/index.php/IJR/ P a g e | 231
Thermal and Cfd Analysis of Plastic Switch Box Base to Find Out
the Optimum Shrinkage Value
Mohammed Abdul Ayub
1,Debashis Mishra
2, D. Maneiah
31M - Tech Student of Thermal Engineering, CMR Technical Campus Hyderabad
2 Assistant professor of mechanical Department,CMR Technical Campus Hyderabad
3. Professor and HOD of mechanical Department,CMR Technical Campus Hyderabad
Abstract— Injection Molding is a one of the most Conspicuous processes for producing the plastic Items. A contextual analysis on plastic Electrical switch box is considered to Research on the optimization of process parameters (temperature, pressure, and time). It is carried out for the Injection Molding machine. Quality of characteristic (shrinkage) of the injection molding product is made by Polycarbonate material is calculated by using L-9 Taguchi Array for Design of experiment. Signal-to-noise ratio and Analysis of variance (ANOVA) were used to calculate the influence of these parameters of the Shrinkage value. A multiple linear regression equation has been developed and through the finding predicted Shrinkage value. An Analytical approach is (Thermal and CFD analysis), component design, cooling profile, assembling, discussed to solving the Shrinkage problem. Experimental data and Analytical results are Discuss to investigate the significant Shrinkage value.
Keywords–ANOVA Analysis, Thermal and CFD
Analysis, Injection molding, Taguchi method, Shrinkage.
I. INTRODUCTION
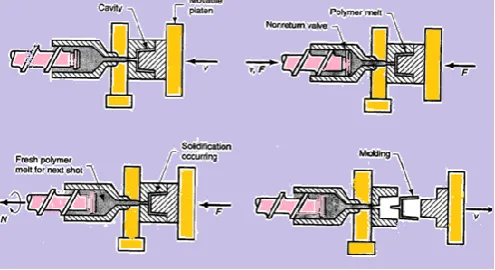
Injection molding is a manufacturing process used to produce the plastic components. The process is by means of foaming a shape by forcing molten plastic material under pressure into the mould. Where it is then cooled, solidified and subsequently released by opening of the two halves of the mould. For efficient use of machine control parameters such as injection speed, injection pressure, holding pressure, melting temperature, holding time and cooling time which are need to be optimized in order to produce the finished plastic component with good quality and low be shrinkage. The Present work is to find out the suitable conditions of injection molding process and to optimize the injection molding process parameters for the optimum shrinkage value of the plastic switch box. The polycarbonate material is used for the manufacturing of plastic switch box.
Fig 1 -Injection Molding Machine process
Thermal analysis is done on the plastic switch box to determine variation in temperature distribution to analyze the thermal properties by varying molten material and thickness of the component. Transient thermal analysis used to determine the temperature, molten material behavior and thermal quantities with respect to time. Computational fluid dynamics is used to Numerical analysis and data structure to solve and analyze problems that involve in the particular problem. CFD analysis is used to calculate material filling time, pressure and liquid fraction values. In Taguchi Method, the word "optimization" implies "determination of best levels of control factors". This log functions of desired
Available online: https://edupediapublications.org/journals/index.php/IJR/ P a g e | 232 levels and to point out the impact of the process
parameters on shrinkage.
II. DESIGN REQUIREMENT AND USES
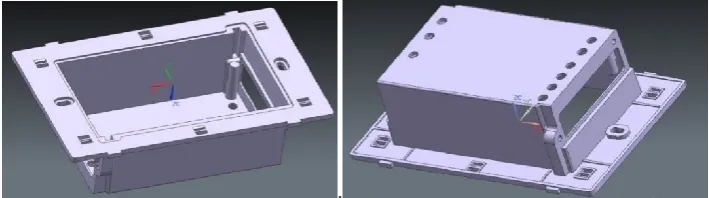
The 3D model of component Electrical Switch Box Base model is designed in the parametric software UNIGRAPHICS. The component is one of the main
parts used in the PCB controlling and monitoring of the switches. This device system is devolved to reduce the House hold power waste and Consequent accidents. Addition channels are designed to Adjustment of the Material filling (wall thickness is 2.5mm) and cool the molten Plastic material.
.
Fig 2 - Top view and Bottom view of model
Fig 3- Mould assembled and Explode View
III. THERMAL ANALYSIS OF HEAT TRANSFER RATE
Thermal Analysis is used to determining the Temperature profile and computer fluid simulation values of existing model. Transient thermal analysis Conducted to the four different types of materials
(Polyvinylchloride, Nylon, ABS and polycarbonate) using Melting temperature is 300°c (A), normal water Temperature 30°c (B) and Atmospheric air temperature is 22°c (C), used to finding the heat flux and temperature distribution profiles. Results were provided to verify the best material, better understanding and developing a good product to having better life.
Table1 – Material Properties
Material name Density (p) – g/cm^3 Thermal conductivity (K) - W/mk Spefic Heat (Cp) - J/K kg
Polycarbonate 1.2-1.22 0.19-0.22 1200
ABS 1.0-1.05 0.14 1300
PVC 1.3-1.45 0.12-0.25 1000-1500
Nylon 1.15 0.24-0.28 1700
Available online: https://edupediapublications.org/journals/index.php/IJR/ P a g e | 233
Fig 4- Imported, Meshed and Boundary conditions model
Case :1 material –polycarbonate
Fig 5 - Temaparature and Heat flux results from at 10,12,14 seconds
Case :2 material –ABS
Fig 6 - Temaparature and Heat flux results at 10,12,14 seconds
Case : 3 material –Nylon
Fig 7- Temaparature and Heat flux results at 10,12,14 seconds
Case : 4 material –PVC
Fig 8 - Temaparature and Heat flux results at 10,12,14 seconds
Thermal analysis is done for the four materials. The material for the original model is consideration of their densities and thermal conductivity. By observing the thermal analysis results, thermal flux is more for Nylon than other three materials, but compare to
polycarbonate it is having low shrinkage and stable for different atmospheric temperatures. So we can conclude that using Polycarbonatematerial and taking wall thickness thickness of 2.5mm is better.
Table 2 - Analytical results listed by using Transient analysis
Material Time Temperature Heat Flux
Min Max
PC 10 12 0.725 1.223 275.58 285 1.4196 e5 1.375e5 14 4.4409 303.51 1.5189 e5
Available online: https://edupediapublications.org/journals/index.php/IJR/ P a g e | 234 Nylon 10 12 1.1838 1.8436 267.58 283.68 1.7976 e005 1.8053 e005
14 2.9082 301.12 1.924 e005
PVC 10 12 1.8575 1.115 267.84 284.17 90161 90466
14 3.0726 300.99 96222
The material for the original model is consideration of their densities and thermal conductivity. By observing the thermal analysis results, thermal flux is more for Nylon than other three materials, but compare to polycarbonate, It is having a wide range of advantages such as high strength-to-weight ratio, high transparency, high flexibility, recyclability, corrosion resistance, and fast processing times, low shrinkage rate and stable for different atmospheric conditions. So it can be conclude
to using Polycarbonate material and taking wall thickness of 2.5mm is better.
3.2CFD Analysis
An analytical approach is discussed by using in Ansys Fluent to analyze the behavior of molten metal at different stages of time by observing the results of temperature variations, pressure variations and liquid fractions by applying the input parameters.
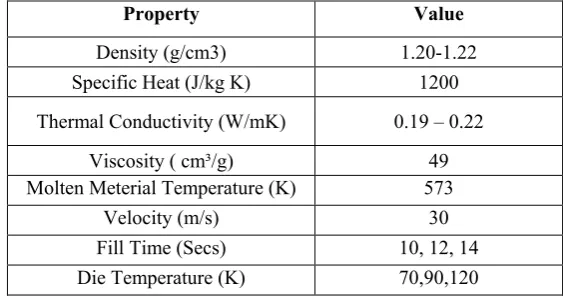
Table 3 - Polycarbonate Material Properties and Using Parameters
Case a – Temperature – 573 K, Fill time – 14secs
Fig 9 - Static Temperature, Pressure and Liquid Fraction at 14seconds
Case b – Die temperature – 573K, Fill time – 12secs
Fig 10- Static Temperatures, Pressure and Liquid Fraction at 12seconds
Case c – Die temperature – 573K, Fill time – 10secs
Property Value
Density (g/cm3) 1.20-1.22
Specific Heat (J/kg K) 1200
Thermal Conductivity (W/mK) 0.19 – 0.22
Viscosity ( cm³/g) 49
Molten Meterial Temperature (K) 573
Velocity (m/s) 30
Fill Time (Secs) 10, 12, 14
Available online: https://edupediapublications.org/journals/index.php/IJR/ P a g e | 235
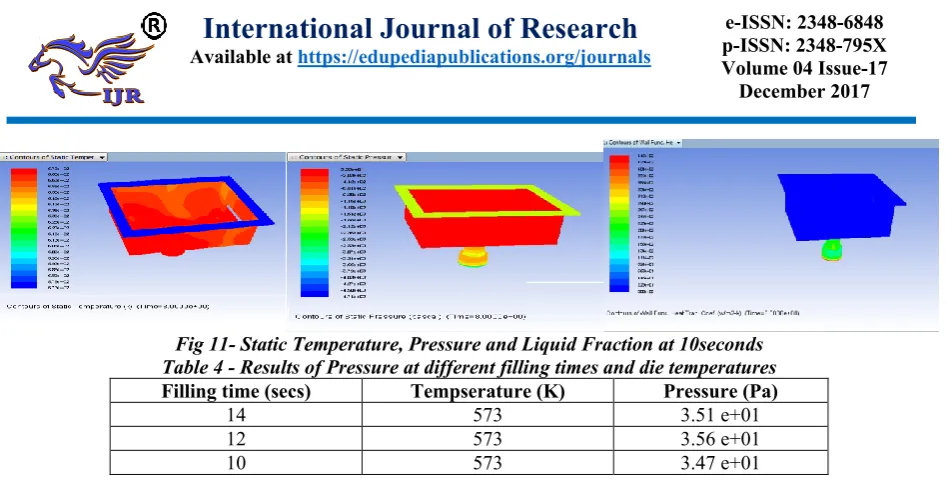
Fig 11- Static Temperature, Pressure and Liquid Fraction at 10seconds Table 4 - Results of Pressure at different filling times and die temperatures
Filling time (secs) Tempserature (K) Pressure (Pa)
14 573 3.51 e+01
12 573 3.56 e+01
10 573 3.47 e+01
In this Results, the optimum filling time, injection pressure and die temperature for better solidification of the filling material are analyzed by taking the input parameters molten metal temperature, velocity at sprue , injection time and die temperature.Solidification analysis is done in Ansys CFD. From the results, the following conclusions can be made:
The better solidification occurs at 12secs injection time, 3.56 e+01 Pa pressure and 3000C die temperature.
Solidification of molten metal at high pressure and less die temperature
IV. TAGUCHI ANALYSIS
4.1 DOE of Taguchi Method
Nine setoff Experiment has been designed for selected process parameters to do this work- Pressure (A), Temperature (B) and Cycle time (C)as per the Taguchi L9 Array design system. The signal to noise ratio (S/N ratio) is used to measure the sensitivity of the quality characteristic being investigated in a control manner. In this Taguchi method the term Signal represents the desirable effect (Mean) and Noise Represents the Undesirable effect (Signal Disturbance). The equation of “smaller-the-better” was selected for the calculation of S/N ratio.
S/N = -10*log10 (Σ (Y2)/n))………… (1)
Table 5 - The Shrinkage values measured from the experiments and their corresponding S/N ratio and, Mean value
S.no Pressure Temperature Cycle time
Shrinkage-1 Shrinkage-2 S/N ration
Mean
1. 50 280 40 0.6116 0.6356 4.10027 0.6236
2. 50 290 45 0.6207 0.6247 4.11438 0.6227
3. 50 300 50 0.6457 0.6497 3.77248 0.6477
4. 55 280 45 0.6051 0.6041 4.37063 0.6046
5. 55 290 50 0.6418 0.6468 3.81817 0.6443
6. 55 300 40 0.8005 0.8095 1.88395 0.8050
7. 60 280 50 0.6622 0.6952 3.36388 0.6787
8. 60 290 40 0.6369 0.6869 3.57796 0.6619
9. 60 300 45 0.8094 0.8394 1.67580 0.8244
4.2 Analaysis of Variance
Analysis of simulation results of shrinkage through design of experimental (DOE) are carried out with analysis of variance (ANOVA), it is used to determining the factor significantly affecting the shrinkage. The ANOVA contains a table consisting of
Available online: https://edupediapublications.org/journals/index.php/IJR/ P a g e | 236
Table 6 - Analysis of Variance for S/N Ratio, using Adjusted SS for Test
Source DF Adj SS Adj MS F-Value P- Value
Regression 3 0.034149 0.011383 3.82 0.092
Pressure 1 0.008855 0.008855 2.97 0.145
Temperature 1 0.023650 0.023650 7.93 0.037
Cycle time 1 0.001643 0.001643 0.55 0.491
Error 5 0.014907 0.002981 - -
Total 8 0.049056 - - -
Shrinkage 0.0546023, R2=69.61%, R2(Adj), =69.61%
4.3 Linear Regression Model Analysis
Linear Regression uses Least Squares to calculate the minimum error between the actual values and the predicted values. The response variable is the shrinkage (S), while the predictors are mold Injection pressure (A), melt temperature (B) and Cycle time(C). Using multiple regression analysis, the correlation between the factors and the parametric characteristic is presented in equation (1),
Shrinkage(S) = 1.424+ 0.00768 x (A) +0.00628x (B) -0.00331x (C)…..… (2)
V. RESULTS AND DISCUSSIONS
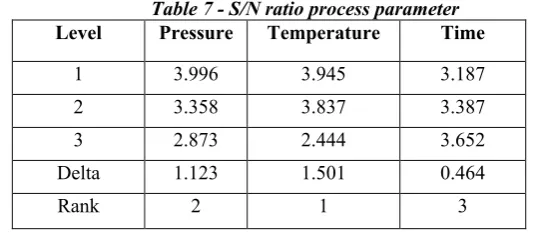
The response of the table 7 is give the best set of combination parameter can be determined by selecting the level with highest value for each factor. As the result the optimal process parameters of polycarbonate material is A1, B1and C3 i.e. 3.996,3.945 and 3.652.The graph represent to the Better performance of processes parameters are represent at pressure 50 Psi. Temperature 280 °C, and cycle time is 50 seconds.
Fig 12 - Effect of Injection Molding machine parameters on force for S/N ratio and Means
Table 7 - S/N ratio process parameter
Level Pressure Temperature Time
1 3.996 3.945 3.187
2 3.358 3.837 3.387
3 2.873 2.444 3.652
Delta 1.123 1.501 0.464
Rank 2 1 3
The response of the table 6.1 is give the the best set of combination parameter can be determined by selecting the level with highest value for each factor. As the result the optimal process parameters of polycarbonate material is A1, B1and C3 i.e. 3.996,3.945 and
Available online: https://edupediapublications.org/journals/index.php/IJR/ P a g e | 237 Comparison was carried out between the Shrinkage
values from the model developed in the present work (Equation 2) and, with the values obtained
experimentally. From the analysis of the referred table we can observe that the calculated error varies from 1.83% to 12.22%.
Table8 - Predicted and Experimental Shrinkage values through Evaluate the Error factor
Predicted value Experimental value Error %
0.586 0.6 116 4.18
0.6323 0.6207 1.83
0.6785 0.6457 4.83
0.63345 0.6051 4.47
0.6541 0.6418 1.88
0.750 0.8005 6.30
0.6297 0.6622 4.90
0.7256 0.6369 12.22
0.7719 0.8094 4.63
A Small Difference between the Experimental and Analytical is 0.00116mm.this indicates that the experiment value is close to the Analytical value.
Regression Equation is used to minimize the actual and predicted values to draw the best possible regression curve for the best prediction accuracy
Figure13- Comparison test between Experimental values and predicted values
VI. CONCLUSION
The optimum filling time, injection pressure and die temperature for better solidification of the filling material are analyzed by taking the input parameters for molten metal (Pc) is consider to take temperature, Pressure, and Cycle time. Solidification analysis is done in Ansys based on result polycarbonate material is selected and optimum filling time (12 seconds) is calculated.
From the ANOVA and Taguchi L-9 results, the following conclusions can be made:
a. The better solidification occurs at 50 sec injection time, 50 Psi pressure and 280°C material melting temperature. Solidification of molten metal at high pressure and less die temperature and less cycle time.
b. The optimum shrinkage value is finding by using Regression Equation i.e. 0.6323mm.
These parameters can be applied practically to the experimental investigation. From this work, trial and error methods in manufacturing process of pressure injection molding can be avoided thereby reducing the total cycle time and also Minimize the material wastage in Production process.
VII. REFERENCES
[1] Prof.S.B.Khedkar, Prof.R.D.Thakre, “Study of Implementing 5S Techniques in Plastic Moulding”, International Journal of Modern Engineering Research (IJMER), Vol-2, Sep-2012.
[2] Mr.M.G.Rathi, Mr.Manoj Damodar
Available online: https://edupediapublications.org/journals/index.php/IJR/ P a g e | 238 [3] JohnVlachopoulos and David Strutt, “Basic heat
transfer and some applications in polymer processing”, Vol- 2, Pages 21-33, Spet-2002.
[4] Allwin Arulanandan, K Ramesha.N,“Mould flow and structural analysis of injection mould tool for hooter body cover component”, International Journal of Research in Engineering and Technology (IJERT), Vol -04, May-2015.
[5] Alireza Akbarzadeh and Mohammad Sadeghi, “Parameter learn in Plastic Injection Molding approach utilizing Statistical approaches and IWO Algorithm”, Worldwide Journal of Modeling and Optimization, Vol- 1, No- 2, June 2011.
[6] Prof. Patil Satish, Prof.Shinde, Prof. Borkar,“Design & analysis of plastic injection mould utilising nx-ug & delcam software”, international journal of strengthen in research in science and engineering, vol-5.
[7] H. Radhwan, M. T. Mustaffab, “An Optimization of Shrinkage in Injection Molding materials by using using Taguchi process”, Malaysia Journal of developed study in utilized Mechanics, Vol- 10, No- 1. 2015. [8] Kalpesh s.Kamble and baliram jadhav,“Investigation and analysis of the energetic reasons to deal with the defect in plastic injection Molding procedure proceedings”,7th IRF international convention, Pune, India,April-2014.
[9] S. Kamaruddin, Zahid, A. Khan, S. H.Foong,“Application of Taguchi process within the Optimization of Injection Moulding Parameters for Manufacturing merchandise from Plastic mixtures”, IACSIT worldwide Journal of Engineering and technology, Vol-2, No-6, Dec- 2010.
[10] Z. Shayfull, M.F.Ghazali1, M. Azaman, S.M. Nasir,“Outcome of differences Core and Cavity Temperature on Injection Molded section and decreasing the Warpage by Taguchi system”,
Worldwide Journal of Engineering & technological know-how IJET-IJENS Vol-10 No- 06, Dec- 2010. [11] Vaatainen, pentti, “Effect of processing parameters on quality of injection molded parts using Taguchi parameter design method” plastic Rubber Compos1994:21:2117.
[12] Z.Shayfull,M.F.Ghazali,“Effect of Differences Core and Cavity Temperature on Injection Molded Part and Reducing the Warpage by Taguchi Method”, International Journal of Engineering & Technology IJET-IJENS Vol-10, No-06, Dec- 2010.
[13] Tom Kimerling,“Injection molding cooling time Reduction and thermal stress Analysis”, University of Massachusetts, Amherst MIE 605, Finite Element Analysis Spring 2002.
[14] K. Krishnaiah, P.Shahabudeen,“Applied design of experiment and Taguchi method”, PHI learning private limited, Delhi-110092. 2013.
[15] Alireza Akbarzadeh, Mohammad Sadeghi,“Parameter Study in Plastic Injection Moulding Process using Statistical Methods and IWO Algorithm”, International Journal of Modeling and Optimization, Vol-1, No. 2, June- 2011.
[16] K. Prashantha, J. Soulestin1, M. F. Lacrampe,“Taguchi analysis of shrinkage and warpage of Injection-moulded polypropylene/multiwall carbon nano-tubes nano-composites”, express Polymer Letters, Vol-3, No-10, (2009) 630–638.
[17]Kingsun Lee , Jui-Chang Lin,“Optimization of injection molding parameters for led lampshade”, Transactions of the Canadian Society for Mechanical Engineering, Vol. 37, No. 3, 2013.