Available online: https://edupediapublications.org/journals/index.php/IJR/ P a g e | 5980
Cost Management Practices in Passenger Road Transport
Undertakings in Karnataka
RAGHAVENDRA N.R
Assistant professor,
Department of studies & Research in Commerce,
Vijayanagara Sri Krishandevaraya University,
Jnanasagara campus,
Ballari, Karnataka.-538105
Phone no: 91-9901871264, 91-9482484485
E-mail: narara_ma@yahoo.co.in, nrrma@rediffmail.com
&
Dr. Usha Devi N.
Associate Professor,
Dept of Commerce,
MLA First Grade College for Women,
Malleswaram, 15th Cross, Bengaluru-560003
E-mail:usha09_n@rediffmail.com
ABSTRACT
Transportation plays a vital role in the economic development of a country. In India,
the cost of transportation is huge due to several reasons. The study is conducted from the cost
management perspective with special reference to Passenger Road Transport undertakings in
Karnataka state. The aim of the paper is to study the relationship between Operating cost and
Total cost in the passenger road transportation of Public Sector undertakings and Private sector
undertakings. 6 Passenger Road Transport Undertakings are selected for the study purpose. In
Public sector KSRTC, NEKRTC and NWKRTC are selected and in Private sector operators are
selected on the basis of the ownership, which are registered in the state as a Public Limited
Companies before March 31st 2010, those are S.G.M.T,Co. Ltd. Sagara, Shivamogga Dist
(1944) and VRL logistics Ltd, Hubballi. (1983) Transport in Co-operative Services
Available online: https://edupediapublications.org/journals/index.php/IJR/ P a g e | 5981 Operating cost and its relationship between total cost along with its profitability in passenger
road transportation of Public Sector and Private sector undertakings.
Secondary data were collected from published sources like Annual administration
reports of the undertakings, Govt bulletins. Collected data were tabulated and cost per
Kilometre is taken into consideration for comparison purpose. Secondary Data regarding
operating cost were classified on the basis of five major parameters like a) Labour cost, b)
Material cost, c) Tax cost, d) Depreciation cost and e) Administration and General Expenses.
The data regarding revenue; cost incurred by the undertakings were collected for 6 consecutive
years from 2010-11 to 2015-16. Both descriptive and inferential statistics applied for the data
analysis. Employee /Labour cost and Material Cost (Fuel, oil and Lubricants, tyres ,tubes and
Spare parts) are significantly differ in both the public sector and private sector undertakings
than Tax Cost, Depreciation on Vehicles and Administrative Expenses & General charges.
Hypothesis is accepted there is no significant difference in the relationship between total cost
and operating cost in the passenger road transportation of Public Sector and private sector
undertakings. Hypothesis is accepted that there is no significant difference in the cost and
profitability of passenger road transportation of Public Sector and private sector undertakings.
Some suggestions are given to reduce the Labour cost like Administrative cost can be
controlled by streamlining systems in accounting, establishment and personnel etc. Adoption of
time and motion study, works study and methods should be followed to reduce the repairs and
maintenance staff. Measures to control material cost: Measures for improvement like
Watching on the vehicles giving less than 4.5 kms per litre of diesel (kmpl), concentration on
vehicles having less than 4.0 kmpl. Classification of driver wise kmpl performance will help to
group the drivers into ABC to bring in focus the drivers who need training and persuasion.
Incentive scheme may be developed to motivate the workers at depot level for fuel economy.
Study concluded that passenger road transport undertakings should develop their own strategy
to control these costs.
Key Words: Passenger road transport, operating cost, total cost, labor cost, material cost.
Available online: https://edupediapublications.org/journals/index.php/IJR/ P a g e | 5982 Transportation plays a vital role in the economic development of a country. The cost of
transportation is huge due to several reasons. Hence, need arises to study the cost management
in the passenger road transportation sector. The study is conducted from the cost management
perspective with special reference to few passenger road transport undertakings operating in
Karnataka state. The topic of the thesis is broadly relating to the area of passenger road
transportation sector with special focus on cost aspect in selected passenger road transport
undertakings.
Meaning of Transportation
Transport or transportation is the movement of people, animals and goods from one location to
another. Modes of transport include air, rail, road, water, cable, pipeline and space. The field
can be divided into infrastructure, vehicles and operations. Transport is important since it
enables trade between people, which in turn establishes civilizations.
Road transport (British English) or road transportation (American English) is the
transport of passengers or goods on roads.
Passenger Road Transport Enterprise/Undertaking
Road transport enterprise offering and performing services in the transport of one or more
persons (passengers), not including the driver, and whose main activities in the field of road
transport, according to value-added, is road passenger transport.
2. Transport Sector in Karnataka
Karnataka, a state in South India has a well-developed transport system. The road
transport is well developed in the state with many National and State highways providing means
for fast transportation. Buses, cars and trains are the means of transport for moving across
distant places in Karnataka. For transportation within the city or town limits; motorbikes, cars,
auto rickshaws and buses are used.
The public bus transport in Karnataka is managed by the Karnataka State Road
Transport Corporation (KSRTC). It was set up in 1961 with the objective of providing adequate,
efficient, economic and properly coordinated road transport services. For better management of
public transport, KSRTC was bifurcated into three Corporations viz., Bangalore Metropolitan
Available online: https://edupediapublications.org/journals/index.php/IJR/ P a g e | 5983 Corporation, Hubballi on 1st Nov 1997 and North-East Karnataka Road Transport Corporation,
Gulbarga on 1st Oct 2000. Buses run by private persons are allowed to operate in few districts
of Karnataka. Inter district transportation are run by private operators, connecting capital
Bangalore and main cities like Mangalore and Dharwad to district headquarters. Intra district
transportation by private operators is currently allowed in Dakshina Kannada, Shivamogga,
Chitradurga, Chikkamagalur and Udupi districts.
3. Significance of the Study
The study analyzes the various elements of cost incurred in the passenger road transport
sector.
The study provides the benefit for the state Road Transport Undertakings to know the
ways and means of reducing the cost as well as fixing an adequate fare during all the
seasons.
The study is ultimately benefiting to the public as well passengers who are mainly
depending on the passenger road transportation, through the fixation of fair fares.
4. Statement of the Problem
In India, the cost of operation in the Passenger Road transportation sector is increasing
tremendously due to various reasons like, hike in the prices of the petroleum products,
increase in the cost of labour, administration and other overheads etc. Raising the
passenger fares again and again will adversely affect on the middle class people who are
mainly depending on the public road transportation.
Material and personnel costs, constituted higher share both in total cost of operation and
revenue and shows that they have recorded increasing trend (R.R Krishna, S Annamalai,
2005).
Performance of the STUs have not improved over the earlier three years. Fleet size, Total
staff cost and Fuel consumption cost were showing an increasing trend.(Shivi Agarwal,
2009).
Corporations have to concentrate more on the cost factors which are fully within the
control of the corporations and they should lay greater emphasis on the cost management
Available online: https://edupediapublications.org/journals/index.php/IJR/ P a g e | 5984 Therefore, a study is undertaken to find out the relationship between total cost and
operating cost along with profitability. Some suggestions are recommended to reduce the
unnecessary cost through adoption of some cost control techniques.
5. Scope of the Present Study.
The present research study is confined to few Passenger Road Transport Undertakings in
Karnataka state only. The passenger Road transport undertakings included public sector
passenger road transport undertakings (KSRTC, NEKRTC, and NWKRTC) and few big private
passenger road transport corporations that are carrying the passengers on route permit basis as
well as tourist basis.
6. Research Location and Rationale
The Research is conducted within the state of Karnataka. 6 Passenger Road Transport
Undertakings are selected for the study purpose. The following criteria is used for the Selection
of the undertakings. Three from the Public Sector and three from the private sector.
Justification for the selection of Sample undertakings
In Public sector 4 Public sector undertakings are operating in Karnataka at present. KSRTC,
NEKRTC and NWKRTC are selected for the study purpose. BMTC is not taken into
consideration for the study purpose, because it is operating in the city area only and its cost
components are different from other Public sector undertakings. In Private Sector, passenger
Road Transport undertakings were selected on the basis of their ownership pattern, i.e only
Public Limited Companies and Co-operative Society registered in Karnataka state before March
31st 2010 is considered. Only 2 companies registered before 31st March 2010. They are 1)
S.G.M.T,Co. Ltd. Sagara, Shivamogga Dist (1944) 2) VRL logistics Ltd, Hubballi. (1983). In
co-operative sector 3) Transport in Co-operative Services (TCS-Sahakara Sarige) koppa,
Chikkamagalur dist. (1991).
Available online: https://edupediapublications.org/journals/index.php/IJR/ P a g e | 5985 The research was conducted for a time span of five years. The data regarding revenue; cost
incurred by the undertakings were collected for 6 consecutive years from 2010-11 to 2015-16.
There is no significance in selecting the period except the availability of data consistency.
7. Review of Literature
Review of Literature is conducted to identify the research gap and to formulate the conceptual
framework on the topic.
Made Gowda (1999) studied the implication of cost of concessional Travel on the working of
State Road Transport Corporations (SRTCs) in India. Examined 36 SRTCs and found that the
cost of concessional travel had remarkable bearing on the profit of the STUs and suggested that
the Government should subsidise the same.
Vohra (1999) made an analytical study about the growing role of private Sector in passenger
road transport service. He revealed that the private bus operators control the lion's share
(around 77 per cent) in the bus transport operations and this share is on the increase. He
suggested that public sector should hire buses from private operators and concluded that, both
public and private sector should join together and play a complimentary role.
Raghbendra Jha, Sanjay Kumar Singh (2000) Attempted to measure cost-inefficiency of
nine major Indian State Road Transport Undertakings (STU) for the period 1983-84 to
1996-97. Found that given the size distribution of the STUs and relevant measures of their working
conditions, the potential for reduction in cost inefficiency was very high. Study found that
there has been stability in the cost-inefficiency ranks across STUs.
R.R Krishna, S Annamalai, (2005) Presented an analysis of the structure of total cost of operation and variations in the proportions of various cost components of selected STC’s in
Tamil Nadu. He found that Material and personnel costs, constituted higher share both in total
cost of operation and revenue and shows that they have recorded increasing trend.
Shivi Agarwal, (2009) measured technical and scale efficiencies of public transport sector in
Available online: https://edupediapublications.org/journals/index.php/IJR/ P a g e | 5986 the DEA Model with categorical DMUs (STUs transported in Rural, Hill and Urban area).
Concluded that performance of the STUs have not improved over the earlier three years and
Fleet size, Total staff and Fuel consumption were considered as inputs and Passenger
kilometers as output.
Mahalingu and Dr J Madegowda (2012), 19 State Road transport corporations were selected
for the study and 5 years data (2004-05 to 2008-09) regarding operating costs and
non-operating costs were taken. Relative shares of each major element of cost (personnel cost,
material cost, depreciation, motor vehicle taxes and non-operating cost) to total cost are
computed. Suggested that corporations have to concentrate more on the cost factors which are
fully within the control of the corporations and they should lay greater emphasis on the cost
management.
The survey of various literatures, authored by various authors’ emphasis on the
Importance of public transport for the economic development of any nation. They examined various
factors which influence on the cost of public transport, like material cost, labour cost and other
administrative overheads, etc in a different manner. Literature also revealed that the public sector
transport undertakings should reduce the unnecessary cost to run their organisations without loss.
8.
Objectives of the Study
1. To study the Operating cost in passenger road transportation of Public Sector and Private
sector undertakings.
2. To study the relationship between Operating cost and Total cost in the passenger road
transportation of Public Sector undertakings and Private sector undertakings.
3. To study the Profitability of passenger road transportation of Public Sector and Private
sector undertakings, considering the revenue generated.
9. Hypotheses of the Study
The following hypotheses have been formulated for the present study.
1. There is no significant difference in the operating cost in passenger road
Available online: https://edupediapublications.org/journals/index.php/IJR/ P a g e | 5987
2. There is no significant difference in the relationship between Operating cost and
total cost in the passenger road transportation of Public Sector undertakings and private
sector undertakings.
3. There is no significant difference in the profitability of passenger road
transportation of Public Sector and private sector undertakings.
10.
Research Design / Method of Research
The data for the study is collected from secondary Sources like Annual administration
reports of the sample undertakings and Govt bulletins. Collected data were tabulated and cost
per Kilometre is taken into consideration for comparison purpose. Secondary Data regarding
operating cost were classified on the basis of five major parameters like a) Labour cost, b)
Material cost, c) Tax cost, d) Depreciation cost and e) Administration and General Expenses.
Collected data were tabulated and findings were drawn.
11
.
Plan of Analysis
1. After data obtained from secondary sources classification and tabulation carried out.
2. Both descriptive and inferential statistics applied for the data collected.
3. Descriptive statistics consist of numbers, percentages, mean, standard deviation, and
Co-efficient of variation.
4. Statistical inference drawn based on the result obtained and tested for 5% level of
significance.
12. Data Analysis and Interpretation
STRUCTURAL COMPOSITION OF TOTAL COST
Cost Components
KSRTC NEKRTC
NWKR TC
VRL LOGISTI CS LTD
TCS, Koppa
S.G.M.
T Co
Ltd
Material Cost 46.01 44.71 43.47 35.53 61.19 57.79
Available online: https://edupediapublications.org/journals/index.php/IJR/ P a g e | 5988 Table -1: Structure of Total cost of Selected Undertakings (Average of 6 years Percentage from 2010-11 to 2015-16)
OBJECTIVE-1
12.1 To study the Operating cost in passenger road transportation of Public
Sector and Private sector undertakings.
12.1.1 LABOUR COST
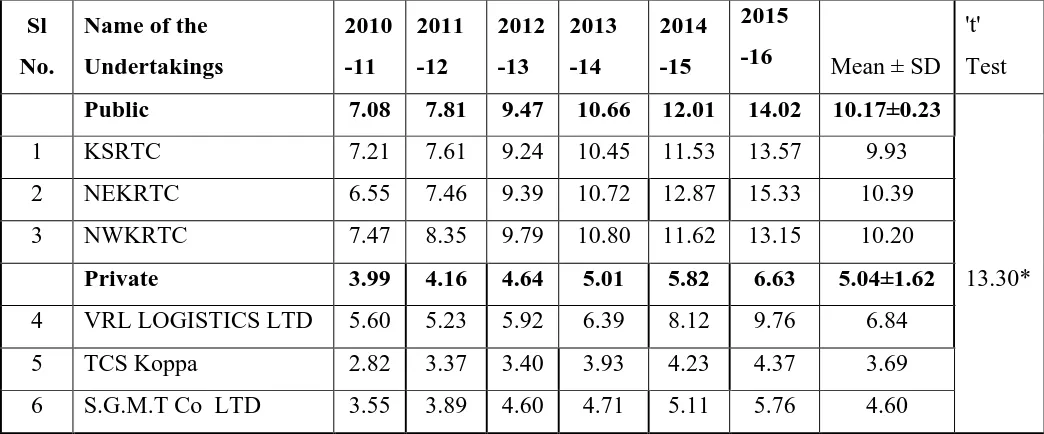
Table -2: Labour cost Per Kilometer of selected Undertakings from 2010-11 to 2015-16
Sl
No.
Name of the
Undertakings 2010 -11 2011 -12 2012 -13 2013 -14 2014 -15 2015
-16 Mean ± SD
't'
Test
Public 7.08 7.81 9.47 10.66 12.01 14.02 10.17±0.23
1 KSRTC 7.21 7.61 9.24 10.45 11.53 13.57 9.93
13.30*
2 NEKRTC 6.55 7.46 9.39 10.72 12.87 15.33 10.39
3 NWKRTC 7.47 8.35 9.79 10.80 11.62 13.15 10.20
Private 3.99 4.16 4.64 5.01 5.82 6.63 5.04±1.62
4 VRL LOGISTICS LTD 5.60 5.23 5.92 6.39 8.12 9.76 6.84
5 TCS Koppa 2.82 3.37 3.40 3.93 4.23 4.37 3.69
6 S.G.M.T Co LTD 3.55 3.89 4.60 4.71 5.11 5.76 4.60
Source: Annual Reports of sample Passenger Road Transport Undertakings of 2010-11 to
2015-16, * Significant at 5% level,
Table 2 depicts that Labour cost per Kilometer of all the undertakings found to be an
increasing trend from 2010-11 to 2015-16. Except VRL it is found reduced in the year 2011-12.
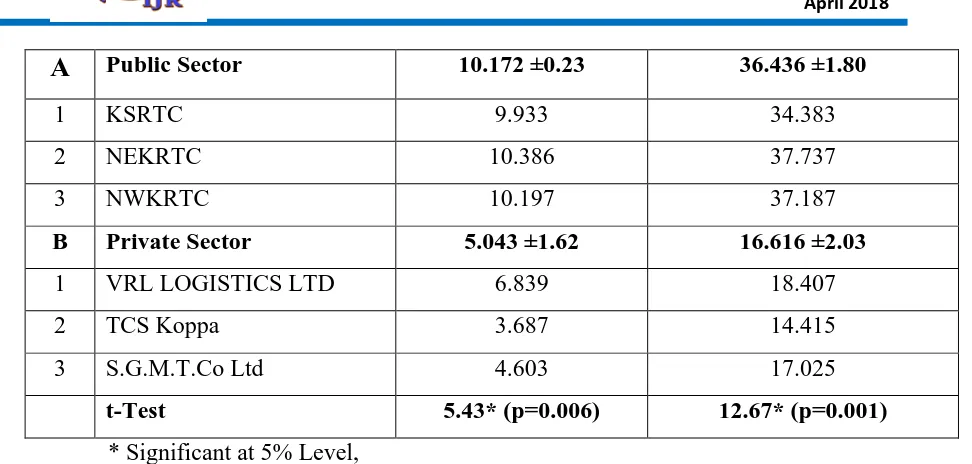
Table -3: Analysis of Labour cost with T-Test
Sl No.
Name of the Undertakings Average Labour Cost/km
Average Labour cost
share/total cost (%)
Motor Vehicles Tax 4.90 4.62 4.18 2.55 5.32 5.08
Depreciation cost 7.51 6.32 6.63 8.83 3.39 6.04
Admin & Other Cost 4.11 3.03 4.09 29.78 12.79 11.97
Financial Cost (Interest) 0.99 1.42 2.21 4.90 2.21 2.10
Non-operating cost 2.10 2.16 2.23 0.00 0.69 0.00
Available online: https://edupediapublications.org/journals/index.php/IJR/ P a g e | 5989
A
Public Sector 10.172 ±0.23 36.436 ±1.801 KSRTC 9.933 34.383
2 NEKRTC 10.386 37.737
3 NWKRTC 10.197 37.187
B Private Sector 5.043 ±1.62 16.616 ±2.03
1 VRL LOGISTICS LTD 6.839 18.407
2 TCS Koppa 3.687 14.415
3 S.G.M.T.Co Ltd 4.603 17.025
t-Test 5.43* (p=0.006) 12.67* (p=0.001)
* Significant at 5% Level,
H0 (1): There is no significant difference in the Labour cost in passenger road
transportation of Public Sector and private sector undertakings.
Interpretation: Regarding the average cost of labour per kilometer under public sector found
to be higher in NEKRTC (10.386) followed by NWKRTC (10.197) and KSRTC (9.933).In
private sector highest average labour cost notices under VRL LOGISTICS LTD (6.839)
followed by S.G.M.T.Co Ltd (4.603) least of these is in TCS Koppa (3.687).Further, the
Average labour cost per Km found higher in Public sector (10.172) as compared to Private
sector (5.043).
The data subjected for statistical test reveals that the difference in the average labour cost
per Km between public sector and private sector found to be significant (t=5.43*, P=0.006)
Result: Hypothesis is rejected that there is a significant difference in the Labour cost in
passenger road transportation of Public Sector and private sector undertakings. Because
benefits provided to the employees are more in Public sector than private sector, hence
average labour cost is more in Public sector than private sector.
12.1.2: MATERIAL COST PARAMETER
Table - 4: Total
Material Cost Per Kilometer of selected Undertakings
(2010-11 to 2015-16) (Cost Per Kilometer)
Sl
No.
Name of the
Undertakings
2010-11
2011
-12
2012
-13
2013
-14
2014
-15
2015
-16 Mean ±SD
't'
Test
Available online: https://edupediapublications.org/journals/index.php/IJR/ P a g e | 5990
1 KSRTC 11.03 12.04 12.96 14.75 15.06 12.66 13.08
6.92
*
2 NEKRTC 9.82 10.77 11.72 13.74 13.97 11.63 11.94
3 NWKRTC 10.22 10.94 11.50 13.30 13.42 11.23 11.77
Private 11.67 13.07 14.66 16.40 17.60 15.30 14.79±1.38
4
VRL LOGISTICS
LTD 9.27 10.29 13.00 14.19 17.25 15.14 13.19
5 TCS Koppa 12.84 14.35 15.30 17.44 18.16 15.44 15.59
6 S.G.M.T Co LTD 12.91 14.56 15.69 17.58 17.39 15.33 15.58
Source: Annual Reports of sample Passenger Road Transport Undertakings from 2010-11 to
2015-16, * Significant at 5% level,
Table- 4 depicts that Total Material cost per Kilometer of all the undertakings found to be an
increasing trend from 2010-11 to 2014-15. But in the year 2015-16 it is found decreased in all
the undertakings because of reduction in diesel prices.
Table -5: Statistical Analysis of Undertakings by Total Material cost
Sl
No.
Name of the
Undertakings
Average Material Cost/km Average Material cost
share/Total Cost (%)
A
Public Sector 12.266 ±0.71 44.732 ±1.271 KSRTC 13.084 46.009
2 NEKRTC 11.942 44.714
3 NWKRTC 11.771 43.472
B Private Sector 14.785 ±1.38 51.503 ±13.90
1 VRL LTD 13.191 35.532
2 TCS Koppa 15.587 61.187
3 S.G.M.T.Co Ltd 15.578 57.788
t-Test 2.81* (p=0.048) 0.84 NS (0.450)
* Significant at 5% Level, NS : Non-significant
H0: There is no significant difference in the Total Material cost in passenger road
transportation of Public Sector and private sector undertakings.
Interpretation:
Regarding the average cost of material per kilometer under public sector
Available online: https://edupediapublications.org/journals/index.php/IJR/ P a g e | 5991 (11.771).With respect to the private sector it is evident from the findings that the highest
average material cost notices under TCS Koppa (15.587) followed by S.G.M.T.Co Ltd (15.578)
least of these is in VRL LOGISTICS LTD (13.191). Further, the Average Material cost per Km
found higher in Private sector (14.785) as compared to Public sector (12.266).
Significant. (t=-2.81*, P=0.048)
Result: Hypothesis is rejected that there is a significant difference in the total material cost
in passenger road transportation of Public Sector and private sector undertakings.
Average material cost is more in Private sector than public sector. Because Expenses
relating to spares, consumables, tyres and tubes are more in Private sector than public
sector. Public sector undertakings are purchasing materials in a bulk manner and they
can enjoy the benefits of economy, than private sector undertakings.
12.1.3: OTHER OPERATING COST (TAX, DEPRECIATION& ADMIN &GENERAL
EXPENSES)
Table-6: Other Operating COST (Tax, Depreciation& Admin &General Expenses) Per
Kilometer of selected Undertakings (2010-11 to 2015-16)
(Cost Per Kilometer)
Sl
No.
Name of the
Undertakings
2010-11
2011
-12
2012
-13
2013
-14
2014
-15
2015
-16 Mean±SD
Public 3.58 3.73 3.98 4.44 4.68 4.53 4.16±0.49
1 KSRTC 4.13 4.39 4.53 4.79 5.27 5.04 4.69
2 NEKRTC 3.26 3.34 3.81 4.00 4.08 3.78 3.71
3 NWKRTC 3.35 3.45 3.62 4.52 4.69 4.77 4.07
Private 7.65 7.74 8.72 9.06 9.83 10.66 8.94±5.43
4 VRL LTD 12.40 11.94 14.36 15.27 18.15 19.06 15.19
5 TCS Koppa 4.83 5.33 5.51 5.26 4.98 6.77 5.45
6 S.G.M.T.Co LTD 5.71 5.96 6.29 6.65 6.37 6.15 6.19
Source: Annual Reports of sample Passenger Road Transport Undertakings of 2010-11 to
2015-16, * Significant at 5% level,
Table -6 depicts that other operating cost (Tax, Depreciation & Admin & General
Available online: https://edupediapublications.org/journals/index.php/IJR/ P a g e | 5992 to 2014-15 and it is decreased in the year 2015-16 in public sector undertakings. But in Private
sector it is found fluctuating trend from 2010-11 to 2015-16.
Table-7: Analysis of Undertaking by Other Operating cost (Tax, depreciation, Admin &General Expenses)
Sl No.
Name of the Undertakings
Average Material Cost/km
Average Material cost share/Total Cost (%)
A
Public Sector 4.157 ±0.497 15.130 ±1.2941 KSRTC 4.692 16.525
2 NEKRTC 3.711 13.968
3 NWKRTC 4.066 14.899
B Private Sector 8.944 ±5.425 28.577 ±10.915
1 VRL LOGISTICS LTD 15.193 41.147
2 TCS Koppa 5.448 21.498
3 S.G.M.T.Co Ltd 6.190 23.085
t-Test 1.52*NS (p=0.202) 2.11 NS (0.101)
* Significant at 5% Level, NS: Non-significant
H0 : There is no significant difference in the Other operating cost (Tax, depreciation, admin
& other cost) in passenger road transportation of Public Sector and private sector undertakings.
Interpretation: Regarding the average other operating cost (Tax, depreciation admin &other
cost) per kilometer under public sector found to be higher in KSRTC (4.692) followed by
NWKRTC (4.066) and NEKRTC (3.711). With respect to the private sector, the highest
average Other operating cost (Tax, depreciation admin &other cost) notices under VRL
LOGISTICS LTD (15.193) followed by S.G.M.T.Co Ltd (6.190) least of these is in TCS Koppa
(5.448). Further, the Average other operating cost (Tax, depreciation admin &other cost) per
Km found higher in Private sector (8.944) as compared to Public sector (4.157). Data found
non-significant. (t=-1.52*, P=0.202)
Result: Hypothesis is accepted that there is no significant difference in the other operating
cost (Tax, depreciation admin &other cost) in passenger road transportation of Public
Sector and private sector undertakings.
Available online: https://edupediapublications.org/journals/index.php/IJR/ P a g e | 5993 Table -8: Total operating Cost per Kilometers (Total Operating cost/No. of Kilometers) of
selected Undertakings (2010-11 to 2015-16) (Cost Per Kilometer)
Source: Annual Reports of sample Passenger Road Transport Undertakings of 2010-11 to
2015-16, NS : Non-significant,
Table 8 depicts that Total Operating Expenses per Kilometer of all the undertakings
found to be an increasing trend in Public sector undertakings from 2010-11 to 2014-15 but it is
reduced in the year 2015-16 in all the public sector undertakings. But in Private sector it is
found fluctuating trend from the year 2010-11 to 2015-16 in S.G.M.T co but in VRL
LOGISTICS LTD and TCS Koppa shows increasing trend upto 2014-15.
Table -9: Analysis of Undertakings by Total Operating Cost
Sl No.
Name of the Undertakings Average Operating Cost/km
Average Operating cost share/Total Cost (%)
A
Public Sector 26.594 ±0.96 96.298 ±0.691 KSRTC 27.709 96.917
2 NEKRTC 26.039 96.418
3 NWKRTC 26.035 95.558
B Private Sector 28.772 ±5.65 96.695 ±1.45
1 VRL LOGISTICS LTD 35.223 95.086
2 TCS Koppa 24.722 97.102
3 S.G.M.T.Co Ltd 26.371 97.898
Sl
No.
Name of the
Undertakings 2010 -11 2011 -12 2012 -13 2013 -14 2014 -15 2015 -16
Mean ±
SD
't'
Test
Public 21.01 22.79 25.52 29.03 30.84 30.39 26.59±0.97
1 KSRTC 22.37 24.04 26.73 29.99 31.86 31.27 27.71
1.61
NS
2 NEKRTC 19.63 21.57 24.92 28.46 30.91 30.74 26.04
3 NWKRTC 21.03 22.75 24.91 28.63 29.74 29.15 26.03
Private 23.31 24.98 28.02 30.47 33.25 32.60 28.77±5.65
4 VRL LTD 27.27 27.46 33.28 35.85 43.52 43.96 35.22
5 TCS Koppa 20.49 23.05 24.21 26.63 27.37 26.58 24.72
Available online: https://edupediapublications.org/journals/index.php/IJR/ P a g e | 5994
t-Test 0.66 NS (p=0.550) 0.43 NS (0.690)
NS : Non-significant
H0 : There is no significant difference in the total operating cost in passenger road
transportation of Public Sector and private sector undertakings.
Interpretation: Regarding the average Total operating cost per kilometer under public sector
found to be higher in KSRTC (27.709) followed by NEKRTC (26.039) and NWKRTC
(26.035). The highest average Total operating cost notices under VRL LOGISTICS LTD
(35.223) followed by S.G.M.T.Co Ltd (26.371) least of these is in TCS Koppa (24.722).
Further, the Average total operating cost per Km found higher in Private sector (28.772) as
compared to Public sector (26.594). data found non-significant. (t= -0.66*, P=0.550).
Result: Hypothesis is accepted that there is no significant difference in the total operating
cost in passenger road transportation of Public Sector and private sector undertakings.
12.1.5: Total Cost
Table -10: Total Cost Per Kilometer
of selected Undertakings (2010-11 to
2015-16)
(Cost Per Kilometer)Sl
No.
Name of the
Undertakings
2010
-11
2011
-12
2012
-13
2013
-14
2014
-15
2015
-16 Mean±SD
't'
Test
Public 21.90 23.71 26.45 30.03 32.11 31.44 27.61±0.85
1 KSRTC 23.16 24.88 27.51 30.79 32.87 32.30 28.59
1.46
NS
2 NEKRTC 20.41 22.36 25.72 29.51 32.40 31.67 27.01
3 NWKRTC 22.14 23.90 26.12 29.79 31.07 30.35 27.23
Available online: https://edupediapublications.org/journals/index.php/IJR/ P a g e | 5995 4
VRL
LOGISTICS LTD 29.26 29.50 35.07 37.55 45.36 44.90 36.94
5 TCS Koppa 21.18 23.62 25.08 27.30 27.97 27.58 25.46
6 SGCo PVT LTD 22.59 24.87 27.15 29.51 29.57 27.96 26.94
Source: Annual Reports of sample Passenger Road Transport Undertakings of 2010-11 to
2015-16, NS : Non-significant,
Table 10 depicts that Total cost per Kilometer of all the undertakings found increasing trend
from the year 2010-11 to 2014-15 in all the undertakings but in 2015-16 it is found reduced in
all the undertakings except NEKRTC.
Table -11: Analysis of Undertakings by Total Cost
Sl
No.
Name of the
Undertakings
Average Total
Cost/km
Sl
No.
Name of the
Undertakings
Average Total
Cost/km
A
Public Sector 27.609 ±0.85 B Private Sector 29.779 ±6.251 KSRTC 28.585 1 VRL LOGISTICS LTD 36.939
2 NEKRTC 27.010 2 TCS Koppa 25.456
3 NWKRTC 27.231 3 S.G.M.T.Co Ltd 26.942
t-Test 0.60 NS (p=0.580)
10) NS: Non-significant
H0 (): There is no significant difference in the total cost in passenger road transportation
of Public Sector and private sector undertakings.
Interpretation: Regarding the average Total cost per kilometer under public sector found to be
higher in KSRTC (28.585) followed by NWKRTC (27.231) and NEKRTC (27.010). With
respect to the private sector, the highest average Total cost notices under VRL LOGISTICS
LTD (36.939) followed by S.G.M.T.Co Ltd (26.942) least of these is in TCS Koppa (25.456).
Further, the Average Total cost per Km found higher in Private sector (29.779) as compared to
Public sector (27.609). Data found non-significant. (t=-0.60*, P=0.580).
Result: Hypothesis is accepted that there is no significant difference in the total cost in
Available online: https://edupediapublications.org/journals/index.php/IJR/ P a g e | 5996 12.1.6: TOTAL REVENUE
Table -12: Total Revenue Per Kilometer of selected Undertakings (2010-11 to 2015-16)
Sl
No.
Name of the
Undertakings
2010-11
2011-12
2012-13
2013-14
2014-15
2015-16 Mean±SD
't'
Test
Public 21.87 23.49 25.98 29.14 31.63 31.25 27.23±1.22
1 KSRTC 23.87 25.09 27.53 30.02 32.43 32.83 28.63
1.96*
2 NEKRTC 20.22 21.95 25.50 28.81 32.30 31.22 26.67
3 NWKRTC 21.51 23.43 24.92 28.58 30.15 29.69 26.38
Private 26.80 27.67 30.67 32.79 36.40 36.71 31.84±9.98
4 VRL LTD 36.50 34.96 40.32 42.60 52.72 52.97 43.35
5 TCS Koppa 21.26 23.72 25.19 27.39 28.07 27.70 25.55
6 S.G.M.T Co LTD 22.64 24.33 26.49 28.39 28.42 29.46 26.62
Source: Annual Reports of sample Passenger Road Transport Undertakings of 2010-11 to
2015-16, * Significant at 5% level,
OBJECTIVE-2
12.2.1 To Study the relationship between Total cost and the Operating cost in passenger
road transportation of Public Sector and Private sector undertakings.
Table -13:
Relationship between Average Total Cost and Average operating cost per
Available online: https://edupediapublications.org/journals/index.php/IJR/ P a g e | 5997 Sl
No
Name of the
Undertakings
Average Total
Cost/km
Average
Operating
cost/km
Standard
Deviation
Correlation
coefficient
(r)
A
Public Sector 27.609 26.594 0.7171 KSRTC 28.585 27.709 0.619
0.9912*
2 NEKRTC 27.010 26.039 0.686
3 NWKRTC 27.231 26.035 0.846
B Private Sector 29.777 28.772 0.712
1 VRL 36.939 35.223 1.213
0.9996*
2 TCS Koppa 25.456 24.722 0.519
3 S.G.M.T.Co Ltd 26.942 26.371 0.403
t-Test 0.60 NS (p=0.580) 0.66 NS (0.550)
* Significant at 5% level, NS : Non-significant
Hypotheses-2: H
0 : There is no significant difference in the relationship between total costand operating cost in the passenger road transportation of Public Sector and private sector
undertakings.
Interpretation:
a) The Average Total cost found to be 27.609 Rs Per Km among Public sector as against
Average operating cost found to be 26.594 Rs per Km. To measure the relationship between
Average Total cost and Average operating cost of Public sector correlation Co-efficient is
employed. The result indicate that there exists significant positive relationship between
Average Total cost and Average operating cost (r=0.9912*)
b) It is evident from the findings that the Average Total cost found to be 29.777 Rs Per Km
among Private sector as against Average operating cost found to be 28.772 Rs per Km.
Correlation Co-efficient result indicate that there exists significant positive relationship
between Average Total cost and Average operating cost (r=0.9996*)
The overall Average Total cost between Public sector and private sector (t=0.60,
p=0.580) and Average operating cost between Public sector and private sector (t=0.66 NS, p=
Available online: https://edupediapublications.org/journals/index.php/IJR/ P a g e | 5998 Result: Hypothesis is accepted that there is no significant difference in the relationship
between total cost and operating cost in the passenger road transportation of Public
Sector and private sector undertakings.
OBJECTIVE -3
12.3 To study the profitability of passenger road transportation of Public Sector and
Private sector undertakings, considering the revenue generated.
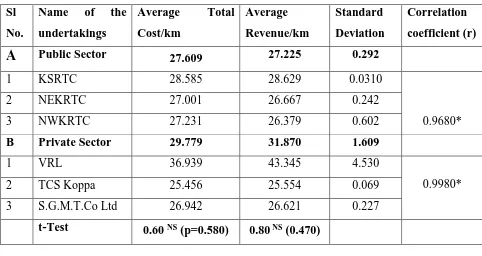
Table -14: Relationship between Average Total Cost and Average Total
revenue
Sl
No.
Name of the
undertakings
Average Total
Cost/km
Average
Revenue/km
Standard
Deviation
Correlation
coefficient (r)
A
Public Sector 27.609 27.225 0.2921 KSRTC 28.585 28.629 0.0310
0.9680*
2 NEKRTC 27.001 26.667 0.242
3 NWKRTC 27.231 26.379 0.602
B Private Sector 29.779 31.870 1.609
1 VRL 36.939 43.345 4.530
0.9980*
2 TCS Koppa 25.456 25.554 0.069
3 S.G.M.T.Co Ltd 26.942 26.621 0.227
t-Test 0.60 NS (p=0.580) 0.80 NS (0.470)
* Significant at 5% Level, NS : Non-significant
Hypotheses-3 :
H0 : There is no significant difference in the profitability of passenger roadtransportation of Public Sector and private sector undertakings.
a) Interpretation: It is evident from the findings that the Average Total cost found to be
Available online: https://edupediapublications.org/journals/index.php/IJR/ P a g e | 5999 per Km. Correlation Co-efficient result indicate that there exists significant positive
relationship between Average Total cost and Average revenue (r=0.9680*)
b) The Average Total cost found to be 29.779 Rs Per Km among Private sector as against
Average revenue found to be 31.870 Rs per Km. Correlation Co-efficient result indicate
that there exists significant positive relationship between Average Total cost and Average
revenue (r=0.9980*)
The overall Average Total cost between Public sector and private sector (t=0.60,
p=0.580) and Average revenue between Public sector and private sector (t=0.80 NS, p=0.470)
found to be non-significant.
Result: Hypothesis is accepted that there is no significant difference in the Total cost and
profitability of passenger road transportation of Public Sector and private sector
undertakings.
13. Summary of Major Findings of the Study
The Average labour cost per Km found higher in Public sector (10.172) as compared to
Private sector (5.043).
The Average Material cost per Km found higher in Private sector (14.785) as compared to
Public sector (12.266). The percentage of contribution of fuel expenses in the total cost is
36% to 37% in public sector, but in private sector it constitutes 50 % to 54 %.
Motor vehicle tax, depreciation and administration and other expenses are found similar in
both public sector and private sector passenger Road transport.
The Average total operating cost per Km found higher in Private sector (28.772) as
compared to Public sector (26.594).
The Average Total cost per Km found higher in Private sector (29.779) as compared to
Public sector (27.609).
There exists significant positive relationship between Average Total cost and Average
operating cost (r=0.9996*) among public sector and Private sector undertakings.
There exists significant positive relationship between Average Total cost and Average
revenue (r=0.9980*) among public sector and Private sector undertakings.
Available online: https://edupediapublications.org/journals/index.php/IJR/ P a g e | 6000 From the study we can conclude that labour cost and material cost are the major
components of cost of operation. There is a significant difference found in public sector as well
as private sector undertakings regarding the labour cost and material cost component only. But
other cost factors are almost same in both the types of undertakings.
In a highly competitive environment, State Transport Undertakings (STUs) cannot raise
the fare beyond the affordability of common man. It is observed that personnel wage level
overtook all other inputs in STUs. It is also observed that 70% to 80 % cost is shared by
personnel and material. With the principle of selectivity, cost control can be effective only in
these areas. Further, analysis of Labour cost revealed that crew productivity is the key to control
labour cost, while in case of fuel and tyre, controlling rate of consumption will help to control
the material costs. STUs could develop their own strategy to control material and labour costs.
15. Scheme of suggestions
15.1 Suggestions to Passenger Road Transport Undertakings
15.1.1 Measures to control Labour cost: Labour cost is more in public sector
undertakings(10.972) than private sector (5.043) undertakings the following suggestions are
given here.
KSRTC, NEKRTC and NWKRTC should streamline their accounting system,
administration, establishment and personnel etc. Administrative cost can be controlled
by streamlining systems in accounting.
Public sector undertakings can reduce their labour cost through reduction in number of
hierarchy of officers.
Customized ‘personnel information system’, ‘accounting information system’,
‘inventory management system’ ‘MIS’ etc. software packages not only bring in
efficiency but also control the staff strength. (Bagade,M.V 2005)
KSRTC, NEKRTC and NWKRTC can adopt time and motion study, works study and
Available online: https://edupediapublications.org/journals/index.php/IJR/ P a g e | 6001
The administrative overhead cost can be controlled by modernization of systems and
full-fledged computerization, while mechanical staff needs to be revised as and when
vehicle technology is improved with works study techniques, in case of operational staff,
crew productivity is the key result area.
Span of control in the administration can be widened to large number of employees in
public sector undertakings.
Incentives and benefits should be introduced to the employees and officers only based
on their performance not on seniority basis.
Periodical training should be provided to drivers, it will increase their efficiency and reduces
cost per KMs. Only experienced drivers should be hired after the driving test.
15.1.2. Controlling material cost
Average material cost is found more in private sector (14.785) than public sector (12.266).
Especially TCS and S.G.M.T co are spending (15.00) more on material cost. some suggestions
are given n this regard.
1. Private sector undertakings are advised to purchase diesel, lubricants, spare parts in bulk
manner either separately or through a co-operative basis.
2. Repair and maintenance of buses should be done in their own garage and stop the repairs of
vehicles in outside agencies.
3. Especially TCS and S.G.M.T co are having more number of old model TATA, Ashok
Leyland buses. These old model buses are consuming more fuel. It is more expensive to them.
Other transport operators are purchasing new model of buses like TATA starbus, Eitcher which
are giving more KMPL 7 to 8. It will save the fuel cost. It will helpful to these undertakings
which are operating in hilly areas. TCS and S.G.M.T should replace their old model buses.
4. TCS should establish own workshop/Garages or franchised garages in some centre places like
thirthalli, N.R Pura, Jayapura etc. to reduce cost. S.G.M.T Co should establish its own
Available online: https://edupediapublications.org/journals/index.php/IJR/ P a g e | 6002 5. Incentive scheme may be introduced to drivers and mechanics who are showing their
efficiency in the reduction of cost .
15.1.3. Measures to reduce Tax, depreciation and administration cost.
1. Govt should reduce tax in some areas like customs, GST etc. to the passenger transport
undertakings. GST should be covered to petroleum products, it will reduce the tax on fuel.
2. While purchasing the buses more attention should be given on the vehicle efficiency than cost
, durability, own service centres etc.
3. Administration & other cost: Unnecessary spending on publicity, advertisements should be
avoided and more number of offices should be reduced. Administration should be decentralized
and they can establish branches in other places.
15.2 Suggestions to Government to reduce the cost.
Toll charges are high and it leads to wastage of time and fuel. It should be reduced to
passenger road transport undertakings.
Government has to subsidize the diesel prices or reduce the tax on diesel prices for
passenger road transport undertakings.
Employee benefits and student pass amount should be reimbursed by State Govt in time
to the passenger road transport undertakings.
Better roads should be constructed and maintained in a proper manner.
16. References
1.Annual Administration Reports of all the sample undertakings from the year 2010-11
Available online: https://edupediapublications.org/journals/index.php/IJR/ P a g e | 6003 2. Bagade M.V (2005), Key Result areas for cost Control in STUs, Special Publication on
Cost Management, CIRT Publication Department, 2005, Pg No.35-44.
3.Eshetie Berhan, Birhanu Beshah , Daniel Kitaw (2013), Performance Analysis on Public
Bus Transport of the City of Addis Ababa, International Journal of Computer Information
Systems and Industrial Management Applications. ISSN 2150-7988, Volume 5 (2013) pp.
722-728.
4. Jha, Raghbendra and Singh, Sanjay Kumar (2000), Small is Efficient: A Frontier
Approach to Cost Inefficiencies in Indian State Road Transport Undertakings (March 2000).
Princes Risborough, Buckinghamshire: Osprey Publishing. p. 4
5. Madegowda J. (1999) - Implications of concessional Travel facility on the Commercial
viability of SRTCs in India, Journal of Transport Management, March 1999, p.150.
6 Mahalingu and Dr J Madegowda, (2012) Performance Evaluation of SRTCs with Special
reference to Cost Management, Indian Journal of Transport Management, Vol. 36, No. 1
(January-March 2012), pp. 4-23.
7. R.R Krishna, S Annamalai, (2005) Structure and Behaviour of Costs- A study of Selected
State Transport Corporations in Tamil Nadu. Special Publication on Cost Management, CIRT
Publication Department, 2005, Pg No.12-34.
8. Sami Jarboui,(2015) Efficiency evaluation in public road transport: a stochastic frontier
analysis, Transport, Volume 30, 2015 - Issue 1.
9. Shivi Agarwal, (2009) “Measuring the Performance of public Transport Sector of India: An
Application of DEA”, 7th International Conference on Data Envelopment Analysis, held at
Temple University, Philadelphia, USA from 10th to 12th July, 2009.
10. Vohra (1999) "Growing Role of Private Sector in Passenger Road Transport Services", in:
'Indian Journal of Transport Management", Vol.23, August 1999, pp.477- 81.
Available online: https://edupediapublications.org/journals/index.php/IJR/ P a g e | 6004 Table -15: Total Number of kilometres operated by the undertakings. (Kms in Lakhs)
Sl no. Name 2010-11 2011-12 2012-13 2013-14 2014-15 2015-16
1 KSRTC 8707.67 9242.56 9415.64 9882.25 9880.66 9684.00
2 NEKRTC 4294.94 4465.86 4488.44 4576.17 4548.43 4809.00
3 NWKRTC 4800.93 4946.74 5272.59 5503.19 5733.85 5840.00
4 VRL Logistics 372.86 630.90 717.59 734.19 634.01 604.00
5 TCS Koppa 63.02 63.03 62.57 61.93 61.31 61.00
6 S.G.M.T.Co 79.16 82.33 82.25 79.14 78.65 76.00
Table -16: Total Operating Cost of all the sample undertakings
Table No.17: TOTAL COST of all the sample undertakings (Rs in Lakhs)
Table-18: Total Revenue of the Passenger Road Transport undertakings from 2010-11 to 2015-16. (Rs in Lakhs)
Sl
No.
Name of the
Undertakings 2010-11 2011-12 2012-13 2013-14 2014-15 2015-16
1. KSRTC 194772.52 222189.99 251694.17 296382.70 314796.18 302769.89
2 NEKRTC 84319.78 96345.42 111844.11 130219.85 140595.15 147854.35
3 NWKRTC 100978.23 112529.50 131332.12 157532.25 170510.43 170262.02
4 VRL Logistics Ltd 10166.96 17324.02 23881.65 26322.54 27592.76 26562.61
5 TCS Koppa 1291.71 1452.55 1514.81 1649.28 1678.00 1628.63
6 S.G.M.T Co LTD 1755.34 2010.48 2186.03 2289.86 2271.06 2081.22
Sl
No.
Name of the
Undertakings 2010-11 2011-12 2012-13 2013-14 2014-15 2015-16
1. KSRTC 201663.34 229922.13 259058.80 304248.11 324817.96 312783.85
2. NEKRTC 87643.35 99842.75 115433.25 135041.87 147354.83 152316.61
3. NWKRTC 106303.92 118250.41 137731.02 163952.68 178164.71 177257.93
4. VRL Logistics Ltd 10909.88 18611.31 25162.79 27567.12 28759.31 27130.65
5. TCS Koppa 1334.62 1488.64 1569.43 1690.93 1714.66 1689.93
Available online: https://edupediapublications.org/journals/index.php/IJR/ P a g e | 6005
Name of the
Undertakings 2010-11 2011-12 2012-13 2013-14 2014-15 2015-16
KSRTC 207868.29 231863.54 259233.00 296692.32 320468.94 317878.99
NEKRTC 86828.23 98035.59 114474.46 131847.21 146919.97 150125.10
NWKRTC 103259.47 115906.85 131399.67 157274.31 172856.72 173379.51
VRL LOGISTICS LTD 13608.59 22056.19 28934.54 31277.92 33423.80 32009.70
TCS Koppa 1339.66 1494.85 1575.82 1696.16 1720.71 1697.29
S.G.M.T Co LTD 1792.31 2003.28 2178.40 2246.71 2235.36 2250.11
Source: Table compiled using the data collected from the Annual Reports of sample Passenger