ODUOR JOSEPH MICHAEL OCHIENG’ REG. NO.: P150/20415/2012
A thesis submitted in partial fulfillment for the award of the Degree of Master of Science in Infectious Diseases (Virology) of Kenyatta University
DEDICATION
In honour of my parents (Mr. Oduor and Mrs. Akoth) and siblings: Paul Santana
ACKNOWLEDGEMENT
I wish to pass my heartfelt gratitude to my supervisors; Dr. Atunga Nyachieo
(IPR) and Dr. Washingtone O. Arodi (KU). They gave me invaluable intellectuel advice. Also, wish to pass my gratitude to the staff of IPR, UoN-Medical School,
Aga Khan University Hospital and Nairobi Water & Sewage Treatment Company for the support accorded to me during this work.
I wish to acknowledge Mrs. Rose Kavurani, Mr. Kennedy Waititu, Ms Caroline Jerono, Mr. Eric, Mr. Deya Mr. Tom Adino and Mr. Jefwa provided lab technical
assistant. Dr. Michael Ndungu (IPR-ASD) and Dr. Feredrick Maloba (Zoo-Dept., KU) assisted with the analysis of histological tissues. Dr. Pius Adoyo (IPR-RHB)
donated lab materials for the experiments. Dr. Lucy Ochola (IPR-T.I.D) facilitated drafting of this work initial concept paper. Prof. Walter Jaoko, Prof. Oumu Anzala, Mr. Jonathan Oloo (UoN-Medical School), and Dr. George Omuse and Dr. Allan
TABLE OF CONTENTS
DECLARATION ... ii
DEDICATION ... iii
ACKNOWLEDGEMENT ... iv
TABLE OF CONTENTS ... v
LIST OF TABLES ... viii
LIST OF FIGURES ... ix
ABBREVIATIONS AND ACRONYMS ... xii
ABSTRACT ... xiii
CHAPTER ONE: INTRODUCTION ... 1
1.1 Background of the study ... 1
1.2 Problem statement ... 3
1.3 Rationale ... 3
1.4 Research questions ... 4
1.5 Hypothesis (H0) ... 4
1.6 Objectives... 5
1.6.1 General objective ... 5
1.7 Study output ... 6
CHAPTER TWO: LITERATURE REVIEW ... 7
2.1 Description of bacteriophage ... 7
2.2 Life cycle of phages ... 8
2.4 Application of phages. ... 11
2.5 Phage therapy ... 12
2.6 Emergence of MDRSA ... 14
CHAPTER THREE: MATERIALS AND METHODS ... 17
3.1 Study area ... 17
3.2 Sampling ... 17
3.2.1 Sampling design ... 17
3.2.2 Sample size determination ... 18
3.2.3 Sample collection ... 18
3.3 Isolation of S.aureus bacteria, S.aureus lytic phage and in vitro study ... 19
3.3.1 Isolation of S.aureus bacteria ... 19
3.3.2. Identification of S.aureus bacteria ... 19
3.3.3 Antibiogram test ... 20
3.3.4 Preservation of isolated multidrug resistant S.aureus (MDRSA) ... 20
3.3.5 Isolation of S.aureus lytic phages ... 20
3.3.6 In vitro screening for phage against MDRSA ... 21
3.4 In vivo Study ... 22
3.4.1 Study animals ... 22
3.4.2 Safety and efficacy study of phage therapy... 22
CHAPTER FOUR: RESULTS ... 27
4.1 Bacterial and phage isolation ... 27
4.1.1 Identification of S. aureus bacterial isolated from waste and sewage water ... 27
4.1.2 Isolation and screening for phage isolates activity against MDRSA in vitro ... 32
4.2 In vivo Study ... 33
4.2.1 Safety of phage therapy ... 33
4.2.2 Efficacy of phage therapy ... 36
CHAPTER FIVE: DISCUSSION, CONCLUSIONS, RECOMMENDATIONS AND SUGGESTION FOR FURTHER RESEARCH ... 62
5.1 Discussion ... 62
5.2. Conclusions ... 68
5.3 Recommendations ... 68
5.4 Suggestion for further research ... 69
REFERENCES ... 70
APPENDICES ... 80
Appendix I... 80
Appendix II ... 81
Appendix III ... 82
LIST OF TABLES
Table 1: Physical appearance score ... 24
Table 2: Interpretation of zones of inhibition (clear patches) around the antibiotics used in the antibiogram test ... 31
Table 3: Cardiac blood bacteria count (mean log CFU/ml + SE) at day 10 post infection ... 39
LIST OF FIGURES
Figure 1: Life cycle of phages. ... 8
Figure 2: Experimental design for in vivo work. ... 25
Figure 3: Staphylococcus species bacteria isolate colonies in (A) mannitol salt agar and (B) modified plate agar medium ... 27
Figure 4: Gram positive cocci (A), catalase positive (B) and coagulase positive (C) tests. ... 28
Figure 5: Positive API STAPH test for Staphylococcus aureus bacteria. ... 29
Figure 6: Negative API STAPH test for Staphylococcus aureus bacteria. ... 29
Figure 7: Antibiogram test of S.aureus isolates was resistant to commonly used local antibiotics. ... 32
Figure 8: Spot assay showing the most virulent phage isolate patch ... 33
Figure 9: Physical appearance graph of mice treated at 24 hrs post infections ... 34
Figure 10: Physical appearance graph of mice treated at 72 hrs post infection. .... 35
Figure 11: Survival rates of mice treated at 24 hrs post infection (A) and 72 hrs post infection (B). ... 36
Figure 12: A graph of 24 hrs p.i treatment bacteremia and viremia levels in treated mice. ... 37
Figure 13: A bacteremia and viremia level graph of mice treated 72 hrs p.i. ... 38
Figure 14: Brain homogenate pour culture plates. ... 41
Figure 15: Lungs homogenate culture plates. ... 42
Figure 17: Kidney homogenate pour plate cultures. ... 44
Figure 18: Liver homogenate plaque assay cultures. ... 46 Figure 19: Brain tissues from; (i) Non-infected group, (ii) Phage infected,
non-treated group ... 48 Figure 20: Brain tissues from MDRSA infected non-infected group ... 49
Figure 21: Brain tissues; i) MDRSA infected non-treated group. ii) MDRSA infeted Antibiotic treated group. ... 50 Figure 22: Brain tissues; i) MDRSA infected phage treated mouse. ii) MDRSA
infected AntiPhag treated mouse. ... 51 Figure 23: Lung tissues i) Non-infected mouse ii). Phage infected non-treated
groups. ... 52
Figure 24: Lung tissues; i) MDRSA infected non-treated mouse. ii) MDRSA infected antibiotic treated mouse. ... 53
Figure 25: Lung tissues; i) MDRSA infected mouse treated with phage. ii)
MDRSA infected mouse treated with combination therapeutic agent. ... 54
Figure 26: Liver tissues from; i) Non-infected mouse. ii) Phage infected non-treated group. ... 55 Figure 27: Liver tissues; i) MDRSA infected non-treated mouse. ii) MDRSA
infected mouse treated with antibiotic... 56 Figure 28: Liver tissues from; i) MDRSA infected mouse treated with phage. ii)
Figure 29: Kidney tissues from; i) Non-infected mouse. ii) Phage infected non-treated mouse. ... 58 Figure 30: Kidney tissues from; i) MDRSA infected, non-treated group and ii)
MDRSA infected, antibiotic treated group... 59 Figure 31: Kidney tissues from; i) Kidney tissue from MDRSA infected mouse
ABBREVIATIONS AND ACRONYMS ASD : Animal Science Department
CA-MRSA : Community acquired methicillin resistant Staphylococcus aureus
CFU : Colony forming unit DNA : Deoxyribonucleic acid
DRSA : Daptomycin resistant Staphylococcus aureus
HA-MRSA : Hospital acquired methicillin resistant Staphylococcus aureus
ICTV : International Committee on Taxonomy of Viruses
LA-MRSA : Livestock acquired methicillin resistant Staphylococcus aureus
MDR : Multi-drug resistant
MDRSA : Multi-drug resistant Staphylococcus aureus
MRSA : Methicillin resistant Staphylococcus aureus PFU : Plaque forming unit
RNA : Ribonucleic acid
RHB : Reproductive Health Biology T.I.D : Tropical Infectious Disease S.aureus : Staphylococcus aureus
UoN : University of Nairobi U.S.A : United State of America
VRSA : Vancomycin resistant Staphylococcus aureus
ABSTRACT
Methicillin resistant Staphylococcus aureus (MRSA) pose a great threat to the global public health. Control of these bacteria has become difficult due to acquisition of resistance against even some of the best antibiotics. Thus, phage therapy could be the better alternative as they are easy to isolate and produce in mass within a short time. However, phage therapy has been a subject of debate over the years but recently there has been a renewed interest due to their proved therapeutic potential and have, therefore, found commercial application in some countries. Thus, this study was specifically designed to evaluate the efficacy of phages against MRSA both in vitro and in vivo. A litre of environmental waste water and sewage samples were collected around the county of Nairobi. The MRSA isolates were obtained from environmental waste water and sewage samples from Nairobi and its environs and evaluated for drug resistance using antibiogram test. In addition, lytic phages were isolated from these samples too. Thereafter, the in vitro efficacy of the phages against MRSA was done by spot assay and tube culture tests. Only the most virulent phage isolate was used for in vivo efficacy study which involved six groups of mice of n=5 per group (BALB/c mice; both sex). The first three groups acted as controls (group 1=only physiological saline, group 2=MRSA bacteria only and group 3=phage only) while the remaining groups were used for efficacy studies using a dosage of 108 CFU/ml for MRSA bacteria, 108 PFU/ml for phage and clindamycin at 8mg/kg. The efficacy study groups (groups 4-6) were first infected by MRSA and observed for 3 days before treatment with either antibiotic (group 4), or phage (group 5) or phage + antibiotic (cocktail therapy group 6). The mice were then observed for an additional 7 days. During the entire 10 days of observation blood samples were collected daily for bacteremia level determination before being euthanized. Different organs including the liver, brain, kidney and lungs were harvested for histopathological studies. All studies were done in accordance with the IPR Institutional Ethical Committee approved protocols. Antibiogram test indicated that MRSA isolated was a multidrug resistant strain (Figure 1). While the in vitro
CHAPTER ONE: INTRODUCTION 1.1 Background of the study
Bacteriophages (phages) are obligate intracellular prokaryotic viruses that devour
bacteria and are ubiquitous (Clokie et al., 2011). Lytic bacteriophages are species specific, as they only invade bacteria that contain compatible surface attachments (Deghorain et al., 2012).
In the quest of vaccine development and drug discovery, phage have been widely
used in phage therapy, phage typing and bio-control (Chhibber et al., 2012;Haq et al., 2012). After the discovery of antibiotics, phage therapy which was widely practiced all over Europe and North America ceased (Summers, 2012). However,
this was not the case in Georgia and Russia where phage therapy is still practiced (Reardon, 2014).
Several antibiotics have been produced for human medication and animal health
care (Davies et al., 2010). However, this has not been easy due to a lot of challenges such as continuous bacterial antibiotic resistance and high cost of research and production. The first case of antibiotic resistance was recorded in
1955, when S.aureus was reported to be resistant to penicillin and later methicillin (a derivative of penicillin) (Chambers et al., 2009). Methicillin resistant S. aureus
Surprisingly, this is the S.aureus strain that predominantly infects humans and livestock making it a great public health risk (Fitzgerald, 2012).
Due to high cost involved; only a few pharmaceutical companies are willing to invest in the research and development of new alternatives geared towards
treatment of bacterial infections (Jagusztyn-Krynicka et al., 2008). Therefore, the rate at which bacteria is developing resistance against the available antibiotics is higher than rate of production of new antibiotics (Castanon, 2007). This has made
the need for alternative measure towards combating these bacterial stains necessary.
The present study sought to establish whether MDRSA isolate exist in the environment of the Nairobi County. The work further explored an alternative way
of combating the ever emerging MDR bacterial isolates using phages as antibacterial agents. Phage therapy is not a new way of treatment (Keen, 2015),
but in this study we chose to extract the lytic phages from sewage and waste water as an economical and cheap way of phage generation. The safety and in vivo
antibacterial potential of environmentally derived phages against MDRSA has also
been investigated. Bacteriophages were considered in this study because they can be obtained, manipulated, and produced easily in the laboratories found in
1.2 Problem statement
Antibiotic resistance developing amongst bacterial isolates is an eminent public health risk toward human health and food security (Laxminarayan et al., 2006).
The problem has resulted into hospital and community epidemics (Dukic et al., 2013; Stefani et al., 2012). These bacteria have caused economic losses that are as
a result of purchasing antibiotic that are not efficient against most of the bacterial infections. In sub-Saharan Africa, antibiotic resistance is on the rise due to uncontrolled dispensation of antibiotics by public health service providers,
veterinarians and drug stores. Humans and animals are largely infected with antibiotic resistant bacterial strains such as MDRSA due to their association and
cross contamination as a result of trade, food production and animal rearing. Management of these bacterial infections is difficult since they are prevalent in the environment, food sources and water. This problem should be solved or else more
MDRSA strains will be causing death in humans and livestock resulting into poor global economic status (Walsh, 2013). The W.H.O has called upon pharmaceutical
companies to engage more on research, development and production of new antibiotics or alternative therapeutic agents like phages against the new and old emerging multidrug resistant bacteria.
1.3 Rationale
The present study sought to determine the safety, efficacy and therapeutic potential
therapeutic potential against the Vibrio cholerae isolate studied (Maina et al., 2014). This findings show that lytic phages are locally available in our ecosystems. They can be used in research, development and production of new therapeutic
agents. In addition, lytic phages that can be manipulated easily in laboratories with minimal equipment compared to manufacturing of new and broad acting
antibiotics. Phages are effective in the control and treatment of bacterial infections caused by multidrug resistant bacteria. The study’s findings were to provide
empirical protocols for isolating phages with therapeutic potential as the ones used
in some parts of Eastern Europe.
1.4 Research questions
i. What is the antibiotic susceptibility of S.aureus bacteria in the environmental waste water and sewage of Nairobi County?
ii. Does the environmental waste water and sewage in Nairobi County harbor
lytic phages against MDRSA bacteria?
iii. What is the in vitro susceptibility of S.aureus to lytic phages?
iv. What is the safety and efficacy level of lytic phages against MDRSA in mice?
1.5 Hypothesis (H0)
The environmentally obtained S. aureus bacteria are not multi-drug resistant
1.6 Objectives
1.6.1 General objective
To evaluate the safety and efficacy of environmentally obtained lytic
phages against MDRSA isolates in waste and sewage water within the Nairobi County.
1.6.2 Specific objectives
i. To determine the presence of MDRSA isolate from environmental waste
water and sewage drainage systems of Nairobi County.
ii. To determine the existence of lytic phage against environmental MDRSA
isolate from Nairobi County.
iii. To determine the in vitro antibacterial potential of lytic phages against environmental MDRSA isolate from Nairobi County
1.7 Study output
The study was geared towards generation of new information on the presence of MDRSA strains in the environment of Nairobi County. Thereafter, determine the
safety and efficacy of the lytic phages against the MDRSA isolated within Nairobi County. This has been achieved by providing the baseline information on the
CHAPTER TWO: LITERATURE REVIEW 2.1 Description of bacteriophage
Bacteriophages are also known as phages. The word “phage” comes from the Greek word “phagein” which means to eat or devour (Wilkinson, 2001). Thus,
bacteriophages mean “bacteria eating viruses”. The microbes were christened by d’ Herelle as bacteriophage, after he observed the virus create clear patches on a
bacterial lawn. In addition, phages are referred to as obligate intracellular parasites of prokaryotic microbes (Drulis-Kawa et al., 2012). Phages parasitize
archeabacteria and eubacteria (Sime-Ngando, 2014).
Phages are classified based on their genomic make-up either as double or single stranded DNA or RNA (Ackermann, 2007; Rohwer et al., 2002). The international committee on taxonomy of viruses (ICTV) classifies phages depending on their
genome, morphology, host specificity, habitat and life cycle. Thus all phages fall into order Caudoviridae which consists of Myoviridae, Podoviridae and
Siphoviridae families(ICTV, 2014).
The most ubiquitous phages are the T4 type which are polyhedral virus that are
composed of icosahedral and helical structural components. Phages are host specific and they are named according to the bacterial species or genus they
animals’ guts, fecal matter and water samples from the rivers are other sources of
phages (Dabrowska et al., 2005).
2.2 Life cycle of phages
Phages have different life cycles that are used to classify them. This includes; lytic, lysogenic, pseudo-lysogenic and chronic life cycle, as shown in the life cycle
below (Drulis-Kawa et al., 2012; Weinbauer, 2004).
Lytic phages are the most destructive types, as they burst the bacterial cell to complete their life cycle. The lysogenic phages establish mutual associations with their host bacteria to form prophages. These kind of phages integrates their
genomes into host bacteria chromosomes or exist as plasmids in the bacteria (Canchaya et al., 2003). They in turn establish stable and long lasting mutual
associations with their host bacteria. In this state the phage is known as a prophage. This association of the lysogenic phage with the host bacterium results in the alteration of bacterial phenotype and genetic expression (Das et al., 2011).
The pseudo-lysogenic phages form unstable association with their host bacteria which ends when the habitat environment changes like exposure to ultra-violet
rays or environmental temperature fluctuations (Chibani-Chennoufi et al.,, 2004; Lunde et al., 2005). The chronic infection life cycle is found in archaeal viruses where the filamentous phages and plasmaviruses like those that infect Mycoplasma
spp (Clokie et al., 2011). The life cycle Mycoplasma bacteriophages involves slow continuous shedding of phage copies by budding from the host bacteria
(Mycoplasma spp) for a long time without lysing the host (Weinbauer, 2004).
2.3 Phage abundance and diversity
Phage abundance within the biosphere varies biogeographically. There is more
phage in the world ocean than on land. The ocean has about 3.5 X1029 phage copies per milliliter while a gram of soil sample on land has 108 phage copies
Where a gram of marine sediments has about 1010 phage copies as compared to one gram fresh water lake sediment which an estimate of 109 phages (Danovaro et al, 2002). In addition, fresh water lakes have about 109 phage particles per
milliliter than sea water of the same volume which has 107 phage particles(Breitbart, 2012). Phage are also present in marine snow (algal flocs), in
which there about 1010 phage copies (Peduzzi et al., 1993). Furthermore, phages are abundant in sea ice; which has an estimate of 106-8 phage particles (Weinbauer, 2004) and air about 105 phage copies (Chibani-Chennoufi et al., 2004).
In animals and plants phage are found where they help to maintain bacteria floral
balance. Amongst animals ruminant bovine have phage count of about 107 per gram of their feces while human’s feces has 109
phage copies per gram (Niu et al., 2009;Rohwer, 2003). Phages ensure that the floral bacterial balance is stable
within the animal host (Reyes et al., 2013). A stable bacterial flora in an organism prevents the upsurge of pathogenic bacteria such as Clostridium defficile which
might result to opportunist infections (Focà et al., 2015). Opportunistic infections are often as a result of broad spectrum antibiotics that eradicate useful bacteria that colonize the gut (Buffie et al., 2012). Phages are also abundant in certain food
eaten by humans and especially dairy products such as yogurt, cheese and raw milk. Cheese has been found to higher phage content of about 109 per gram more
2.4 Application of phages.
Phages are versatile micro-organisms that have been utilized in biomedical research, and food bio-processing, medical and veterinary medicine (Haq et al.,
2012). In biomedical research, phage display is a technology based on direct linkage between phage phenotype and its encapsulated phenotype that results to presentation of molecules libraries on the phage surface. The technique is vital in
processing polypeptides which are useful in drug design (Sidhu, 2000). Phages such as lambda phages, T7 and Escherichia coli (E.coli) filamentous phage (M13)
(Mead et al., 1988) are used as vectors in conjunction with Escherichia coli
plasmid vectors to create a cosmid vector (Lodish et al., 2000). The cosmid vectors carry large DNA fragments and have the ability to replicate into several
copies. This property makes it useful in the discovery and development of vaccines (Benhar, 2001). In addition phages are used in environmental cleaning to remove
deadly pathogenic bacteria such as Bacillus anthracis from contaminated places (Jepson & March, 2004; Jończyk-Matysiak et al., 2014).
In the medical and veterinary field, phages have been extensively used as diagnostic tool and therapeutic agents. In diagnosis application of bacterial
infections, phage typing is as an efficient way of detecting Mycobacterium tuberculosis, E.coli, Pseudomonas, Salmonella, Listeria, and Campylobacter
2.5 Phage therapy
Obligate lytic phages are efficient antibacterial agents due to their bactericidal
ability to burst open their host bacterium resulting into cell death (Pouillot et al., 2010). In the available literature, phages have been used to treat skin,
subcutaneous and systemic bacterial infections caused by E.coli, Staphylococcus aureus, Shigella dysenteriae and Klebsiella pneumoniae (Kutter et al., 2010). These has been achieved due to phages’ specificity, bactericidal activity,
auto-dosing capability, ability to evolve against phage resistant bacterial strains, and environmental availability (Koskella et al., 2013). Phages specificity allows them
to specifically destroy target bacterium unlike antibiotics that clear even non-target bacteria. This makes phages impetus agents to counter balance the microbiome in
the host lumen (Abedon et al., 2010). Most antibiotic have bacteriostatic ability that makes them inefficient in achieving full therapeutic potential which is not the case with lytic phages used for treatment purpose (Vinodkumar et al., 2008).
Therefore, phages can be used to eliminate multidrug resistant strains of bacteria which include; multidrug resistant Staphylococcus aureus strains such as
methicillin resistant Staphylococcus aureus (MRSA), vancomycin resistant
Staphylococcus aureus (VRSA), carbapenem resistant E.coli, Pseudomonas aeruginosa, K. pneumoniae and Shig. dysenteriae (Marza et al., 2006).
In phage therapy, a small titer of phage is enough to cure a bacterial infection
disseminated throughout the entire body system (Łusiak-Szelachowska et al., 2014). They have the ability to evolve to overcome the emergence of new phage resistant bacterial strains (Marraffini, 2013). This makes it easy to handle bacterial
strains that are phage resistant. In addition, phage therapy is considerably safe as phages forms part of the human microbiota and ecosystem (Gupta et al., 2011).
Antibiotics have been associated with serious adverse side effects which includes; kidney failure, allergies, nausea and liver damage(Alqahtani et al., 2015; Kishor et al., 2015; McMullan & Mostaghim, 2015). None of these has been documented
from patients on phage therapy. Lytic phages do not carry toxin genes and have minimal tendency to induce DNA transduction between bacterial strains (Guenther
et al., 2012). These phages are highly specific and will only destroy target pathogenic bacteria but, spare useful normal bacterial flora (Ahmed, 2012). The specificity nature of phages inhibits the occurrence of secondary infections such
candidiasis and Clostridium defficile colitis which are often associate with broad spectrum antibiotics (Sulakvelidze et al., 2001).
Phage therapy also, has got its own challenges which include need for thorough identification of the pathogenic bacteria before treatment. This is due to their
specific nature, since a phage strain for another bacterial genus will not lyse bacteria from another genus. The property therefore makes phage therapy
consists of more than one phage strain or genus. In some case there are also, phage – antibiotic cocktails which have proven to be effective against bacterial infections
(Jikia et al., 2005). Not all phages are suitable for therapeutic purpose as some of
them carry toxic genes that make the bacteria more pathogenic (Brabban et al., 2005).
Phage therapy has been in use in Eastern Europe even after the introduction of broad spectrum antibiotics. The emergence of multidrug resistant bacteria isolates within the hospital and community setups has further cemented the practice of
phage therapy in the region (Keen, 2015). Initially multidrug resistant bacteria isolates such as MDRSA strains were thought to be acquired only from hospitals
(González-Castillo et al., 2013). However, recently more cases on MDRSA have been reported from the community setups than hospitals (David & Daum, 2010). This is an indication that there is a community strain of MDRSA circulating in
livestock as well as fomites, soil and water (Pantosti, 2012).
2.6 Emergence of MDRSA
Staphylococcal infections were preferentially treated with β-lactam antibiotics
which were considered to be effective against most of the gram positive bacteria
(Lowy, 2003). Before emergence of resistant bacterial strains, penicillin was once the drug of choice for treatment of gram positive bacterial infections. Thereafter,
resistance has been acquired due to over prescription of penicillin by public health service providers. In combating the emerging resistance, β-lactamase inhibiting drugs such as methicillin were developed. However, some S. aureus isolates have
been reported to possess some resistance to methicillin. The methicillin-resistant
S.aureus (MRSA) had acquired methicillin resistance gene (mecA) (Parker &
Jevons, 1964).
The mecA gene is thought to have been acquired from distantly related species of
Staphylococcus, which is Staphylococcus fleuretti. Staphylococcus fleuretti is common in animals (Tsubakishita et al., 2010). The resultant MRSA strains forms
part of the normal human and animal bacterial flora (David & Daum, 2010; Mole, 2013). Despite the S. aureus being resistant to methicillin, cases of resistance with other drugs has been documented creating isolates that are multidrug resistant
(MDR) (McDougal et al., 2010). These multi-drug S.aureus (MDRSA) strains includes; methicillin resistant S.aureus (MRSA), vancomycin resistant S.aureus
(VRSA) and daptomycin resistant S.aureus (Stefani et al., 2015).
The MDRSA strains have become a global problem in hospitals and communities
(Chiarello et al.,2012). Stefani et al., (2012) have reported that the global prevalence of MDRSA varies from continent to content and country to country.
prevalence ranged from 10% to 50%, while in East Africa and especially Kenya the MRSA prevalence had raised from 10% from 40% in 2009 (Kariuki et al., 2011). However, another epidemiological study done in Kenya a year later after
Stefania and colleagues studies showed that MDRSA prevalence in country was 81% in public funded hospitals (Maina et al., 2013). Mean while in private
hospitals, it is relatively low. (Omuse et al., 2014).
The increase in MDRSA prevalence may be attributed to other sources of
contamination apart from the hospital and communities (Ombui et al., 2009; Shitandi et al., 2004). New sources of MDRSA infections are livestock and pets
which have resulted to novel strain known as livestock acquired MRSA (LA-MRSA). Thus, zoonotic sources of contamination cannot be ruled out (Broens et al., 2012; de Boer et al., 2009). This creates a major threat to the global public
health and economy (WHO, 2013). In order to avert this antibacterial crisis the WHO has urged pharmaceutical companies to increase their efforts towards
research, development and production of new antibiotics (Spellberg, 2010).
However, this has not been the case since the venture is expensive and demands a
lot of time to carry out. While the bacteria strains acquire resistance against new antibiotics faster than the rate at which these antibiotics are developed and
CHAPTER THREE: MATERIALS AND METHODS
3.1 Study area
The study was conducted in Nairobi County, the most populous county in the Kenya with an estimated population of about 3.37 million(KNBS, 2015). The
county has an area of 696.1sq Km and it has nine sub-counties namely; Starehe, Kamukunji, Kasarani, Makadara, Embakasi, Njiru, Dagoretti, Langata and Westlands (ASDSP, 2016). Majority of its inhabitants dwell in slums such as
Mathare, Kibera and Mukuru Kwa Jenga. Slum dwellers have poor access to basic human needs such as water, basic sanitation and health care services (WPR, 2016).
This make them prone to numerous bacterial infections and in most cases these bacteria are drug resistant strains (Maina et al., 2013; Njuguna et al., 2013). The slums’ drainage systems and sewage treatment plants in the county were selected
for the study as they provided rich sources of multidrug resistant bacteria.
3.2 Sampling
3.2.1 Sampling design
Nairobi County was selected as study site using convenient sampling technique.
Cluster sampling technique was used to pick the sampling sites within the county. The names of particular areas’ of the sites to be studied were selected using simple
3.2.2 Sample size determination
Sampling size was determined using the formula used by (Kothari, 2004). n = {Z2[pq]}/ℓ2
Where n = desired number of water samples to be collected. (Population is infinite)
Z = standard deviation is usually 1.96 which corresponds to 95% confidence interval.
ρ = the proportion of Kenyan slum dwellers who cannot access basic sanitation such as piped water is estimated to be 93% (Undie et al., 2006).
ԛ = 1 – ρ → (1 – 0.93) = 0.07 ℓ = 0.05 (5% absolute precision) n = {1.962 [0.93 X 0.07]} / 0.052
n = 100.035264 > 100 samples
3.2.3 Sample collection
Environmental waste and sewage water were collected in sterile dark containers from the Nairobi City Sewage and Treatment plant at Dandora and drainage systems of Kibera, Mathare, Korogocho, Burma market and Dagoreti abattoir.
3.3 Isolation of S.aureus bacteria, S.aureus lytic phage and in vitro study
3.3.1 Isolation of S.aureus bacteria (Chessbrough, 2000)
The water sample was sieved to remove debris and then centrifuged at 2500 g for
10 minutes. The supernatant was collected and preserved at +40C. The sediment was slightly mixed with sterile 0.85% saline water to form a paste.
The sediment paste was inoculated on to mannitol salt agar (Liofilchem®, Italy) and incubated at 370C 12 – 24 hours (hrs). Single bacteria colonies from the overnight plate culture were further sub-cultured on mannitol salt agar plates to
obtain pure bacteria isolates.
3.3.2. Identification of S.aureus bacteria (Chessbrough, 2000)
Isolates from different plates were gram stained. The gram positive isolates were
cultured overnight on modified plate agar. The plate agar was modified adding 7.5% sodium chloride per kilogram of the medium, to make it more selective for
S.aureus. These bacteria isolates were then tested for catalase enzyme. Coagulase
test was done for all isolates that were catalase positive.
3.3.3 Antibiogram test (Wikler et al., 2007)
Kirby- Bauer Disk diffusion test (Bauer et al., 1966) was done as stipulated by Clinical standard laboratory institute (CLSI). The antibiotics used in the test were
Ceftazidime (CAZ) 30µg, Oxacillin (OX) 1 µg, Vancomycin (VAN) 30 µg, Netilmicin (NET) 30 µg, Gentamicin (CN) 10 µg, Erythromycin (E) 15 µg,
Trimethroprim-Sulfamethoxazole (SXT) 25 µg and Cefuroxime (CXM) 30 µg (Liofilchem®, Italy). The antibiotics disks had international standardized drug concentration as recommended by CLSI (Wikler et al., 2007).
3.3.4 Preservation of isolated multidrug resistant S.aureus (MDRSA) The isolates that were multidrug resistant were stored at +40C for two weeks if they were to be used within ten days. Other bacteria samples were preserved in 15% glycerol – nutrient broth mixture at -200C for long term storage (6 months to
3 years).
3.3.5 Isolation of S.aureus lytic phages (Adams & Wade, 1955)
Forty milliliters (40 ml) of the previous collected supernatant (3.3.1 procedure) was centrifuged at 12000 g for 10 minutes (Centrific™ - Centrifuge Fisher
overnight nutrient broth cultured MDRSA isolate. This mixture was incubated overnight at 370C and 120 revolutions per minute (rpm) in a shaker incubator (LAB-LINE® incubator-shaker, USA). The overnight culture was centrifuged
(10000 X g for 10 minutes), filtered (0.2 µm filter) and serial diluted tenfold. 250 µl of the tenfold serial diluent was combined with a fresh MDRSA isolate (300µl)
overnight culture mixed with nutrient agar (NA) (0.7%) overlay and dispensed on dry nutrient agar (1.5%) base (HiMedia-India) medium. Thereafter, incubated at 370C overnight after which huge plaques were aseptically picked and purified
through the previous double layer method. Purified plaques were then cultured with an overnight MDRSA isolate culture for 18 hrs at 370C. Afterwards this
culture was ultra filtered with 0.2 µm to get pure lysate (MDRSA lytic phage isolate).
3.3.6 In vitro screening for phage against MDRSA (Golkar et al., 2013)
A lawn of MDRSA isolate was prepared using McFarland standard 2 (6.0 X 10⁸ CFU/ml) inoculum. The inoculum was made by serial diluting an overnight broth
culture of the MDRSA isolate in a normal saline solution to much the McFarland standards (BIOMERIEUX-France). The inoculum was inoculated on to the nutrient agar plates by spread method and allowed to air dry. 5 µl of the pure
lysate was spotted on MDRSA isolate plates. The media plates were air dried again then incubated at 370C overnight. Clear patches (plaques) observed on the
virulent phage isolate. The most virulent lytic phage was stored at +40C while waiting to used during in vivo studies.
3.4 In vivo Study
3.4.1 Study animals
Thirty BALB/c mice aged 6 to 8 weeks were sourced and maintained in the animal facility of the Institute of Primate Research (IPR) Karen-Nairobi. The mice were
fed on antibiotic free food ration (Unga Feeds – Kenya Limited) and water was provided ad libitum. All study protocols and procedure were reviewed and
approved by the Institutional Review Committee of the IPR (IRC/02/14) and Kenyatta University.
3.4.2 Safety and efficacy study of phage therapy
3.4.2.1 Inocula preparation of MDRSA isolate for infection and phage lysate for both infection and treatment.
The dosing inocula were prepared from an overnight MDRSA isolate culture. This culture was centrifuged at 2000 X g for 5 minutes, washed three times, and
suspended in sterile physiological saline to the desired concentration (108 CFU/ml) (Yao et al., 1997)
20 ml of sterile NB and to this mixture 1 ml of lytic phage at 108 PFU/ml was included. This mixture of S.aureus, lytic phage and sterile NB was incubated at 370C, 120 r.p.m. for 3.5 hrs. The culture was then centrifuged at 10 000 X g for 10
minutes and the supernatant ultra-filtered using 0.2 µm filters. The filtrate was maintained at +40C before use.
3.4.2.2 Experimental design
Mice were randomly assigned into 6 groups of five animals per group (Figure 1).
The number of mice used in the study was determined by GPower 3.1 software (Faul et al., 2009). 30 mice were used during this experiment, but it was done in triplicate to eliminate biasness. Previously 20 mice had been used to determine
lethal dosage for phage therapy. In total the study made use of 200 mice; that is 180 for experimental work and 20 for phage lethal dosage determination.
Lethal dose determination involved intravenous infection of the 16 mice (male and female) via caudal tail vein with 0.20 – 0.25 ml varied lytic phage PFU/ml (104, 105, 106 107, 108 109 1010and 1011). In this experiment 4 mice were used as
controls.
In the main experiment mice were infected with 0. 25 ml of either MDRSA (108
dose of either clindamycin (8 mg/kg/ bwt), phage (108 PFU/ml) at 0.25 ml or a combination of both phage (108 PFU/ml) and clindamycin (8 mg/kg/bwt). This was done intravenously (Figure 1).
The mice physical appearance was observed daily and the appearance scored as indicated below (Table 1).
Table 1: Physical appearance score
Physical appearance Score
a) Normal 5
b) Slight illness; defined by lethargy and ruffled fur. 4 c) Moderate illness; defined by severe lethargy, ruffled fur and hunched
back.
3
d) Severe illness; defined by all the above signs and exudative accumulation around particially closed eyes.
2
e) Moribund; defined as near death status or extreme end of all the above signs.
1
f) Death 0
Mice at moderate illness, severe illness and moribund conditions were euthanized on ethical grounds. This was done to minimize the pain the mice were undergoing (Kilkenny et al., 2010). 0.5 µl of blood was got from the mice from day 1 to 10.
tenth day all the surviving mice were euthanized. The cardiac blood and organs (brain, liver, kidneys and lungs) were then harvested.
Figure 2: Experimental design for in vivo work. Control groups
n = 5
Control group
n = 5
MDRSA infected control group n= 5
Phage infected control group n = 5
Control group
n = 5Figure 2: Experimental design for in vivo
work.
MDRSA infected control group n= 5
Phage infected
control group No treatment
Treatment groups
Mice treated intravenously at either 24 hrs or 72 hrs post- infection (p.i).
n = 5
MDRSA infected –
Clindamycin (8 mg/kg/bwt) treated group
n = 5
MDRSA infected – Combination (phage 108 PFU/ml + Clindamycin 8mg/kg/bwt) treatment group. n= 5
MDRSA infected – phage (108 PFU/ml) treated group n = 5
MDRSA infected group
n = 5
MDRSA infected group
n= 5
Samples of cardiac blood and organs were evaluated for bacteria CFU/ml, phage PFU/ml and histopathological adverse effects of the bacteria and phages. Organ samples (brain, liver, kidney and lungs) for histopathological analysis were
collected in formalin. The tissues were stained with haematoxyline and counter stained with eosin as per IPR histopathological staining protocol.
3.5 Statistical analysis
The mice’ daily physical health status scores, blood bacteria (CFU/ml) and phage
(PFU/ml) levels were collected, and keyed into Microsoft Office Excel 2007 software (Microsoft Word- Microsoft Corporation, USA). These data were analyzed using GraphPad Prism 5.0.1 (Graph pad software, San Diego. CA). A
two- way analysis of variance (ANOVA) was used to determine the differences amongst groups and within the group. The level of significant difference was
CHAPTER FOUR: RESULTS 4.1 Bacterial and phage isolation
4.1.1 Identification of S. aureus bacterial isolated from waste and sewage water
Yellow colonies obtained on Mannitol salt agar indicated the presence of
Staphylococcus species isolates (Figure 3 A) which were sub-cultured on modified plate agar and white colonies were formed (Figure 3 B).
A B
Figure 3: Staphylococcus species bacteria isolate colonies in (A) mannitol salt agar and (B) modified plate agar medium
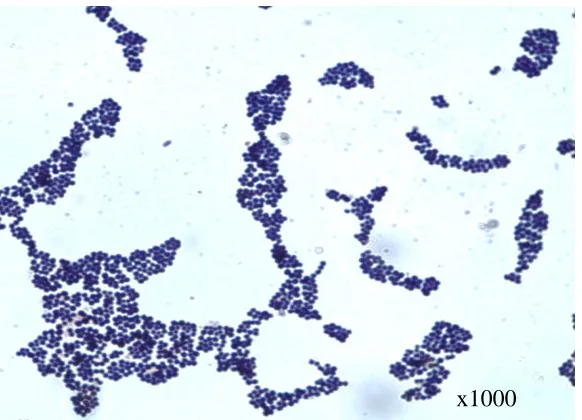
Gram stain appearance of the isolated bacteria were grape-like bunches of purple cocci. The biochemical tests showed that the bacterium was catalase and coagulase
A
B C
Figure 4: Gram positive cocci (A), catalase positive (B) and coagulase positive (C) tests.
These isolates were further analyzed using API kit for Staphylococcus species. The
test reviled that not all the isolates were Staphylococcus aureus, as others were identified as Staphylococcus sciuri, Staphylococcus lentus, Staphylococcus xylosus
and Staph.intermedius. The confirmed positive Staphylococcus aureus isolate had distinct colour changes (Figure 5) unlike the negative test which indicated other
Staphylococcus isolates such as Staphylococcus lentus, Staphylococcus xylosus
and Staph.intermedius (Figure 6).
Figure 5: Positive API STAPH test for Staphylococcus aureus bacteria.
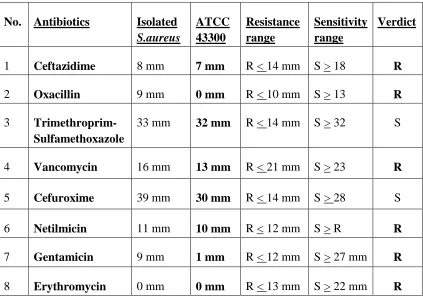
The antibiogram test showed that the isolated S.aureus was as resistant as ATCC 43300 (MRSA control) when tested against the selected antibiotics. This indicated that the isolate was a multidrug resistant S.aureus bacterium. The bacterium was
resistant to; 1). Cephalosporin antibiotic (Ceftazidime) 2) Penicillin derived antibiotic (Oxacillin), 8) Macrolides (Erythromycin). 4) Glycopeptide
(Vancomycin). 7) Gentamicin and 6) Netilmicin (aminoglycopeptides antibiotics). The isolate was sensitive to 3) trimethroprim-sulfamethoxazole (combination of two antibiotics), and 5) second generation cephalosporin antibiotic (Cefuroxime)
(Figure 7). The drugs with smaller zones of inhibitions around the m than the resistant range were considered non-effective against the isolated S.aureus and the
well characterized MRSA (ATCC 43300). Sensitivity was considered when the zone of inhibition around the antibiotic was equal or larger to the standard
Table 2: Interpretation of zones of inhibition (clear patches) around the antibiotics used in the antibiogram test
No. Antibiotics Isolated S.aureus
ATCC 43300
Resistance range
Sensitivity range
Verdict
1 Ceftazidime 8 mm 7 mm R < 14 mm S > 18 R
2 Oxacillin 9 mm 0 mm R < 10 mm S > 13 R
3 Trimethroprim-Sulfamethoxazole
33 mm 32 mm R < 14 mm S > 32 S
4 Vancomycin 16 mm 13 mm R < 21 mm S > 23 R 5 Cefuroxime 39 mm 30 mm R < 14 mm S > 28 S
6 Netilmicin 11 mm 10 mm R < 12 mm S > R R
Figure 7: Antibiogram test of S.aureus isolates was resistant to commonly used local antibiotics.
4.1.2 Isolation and screening for phage isolates activity against MDRSA in vitro
Eight phages were isolated against the isolated MDRSA bacterium. The virulence
of these phages against the MDRSA was determined by spot assay. These spots (clear patches on MDRSA lawn) are created when the phage parasitize a bacterium and replicate inside it. Many copies of this phage are produced which then produce
lytic enzyme to digest the bacterium wall lyse. The phages escape into the surrounding to parasitize more bacteria and continue lysing them. This is what
formed the patches or spots seen on the bacteria lawn (Figure 8).
2
1 3
4 5
6 7
Figure 8: Spot assay showing the most virulent phage isolate patch
The isolated virulent phage was active against MDRSA in vitro; it cleared the
MDRSA bacteria in a broth media within 24 hrs.
4.2 In vivo Study
4.2.1 Safety of phage therapy
Results of trial study showed that phage was not toxic or pathogenic in mice, as none of the mice died. They showed no symptom of distress such as lack of appetite, ruffled fur and lethargy. The observation was made on all the involved in
the study.
The mice hurdled in one of the cages after infection with a single of phage (108 PFU/ml) or MDRSA bacteria (108 CFU/ml). The mice infected with only phage
showed as active as non-infected mice with no major difference in physical appearance (p > 0.5). These mice (non-infected and phage infected) groups were significantly different from MDRSA infected mice groups (p < 0.001). The mice
on treatment groups showed improvement on physical appearance. There was no significant appearance in all the treatment groups when mice were treated at either
24 hrs p.i (Figure 9) or 72 hrs p.i (Figure 10) (p > 0.5).
0 1 2 3 4 5 6 7 8 9 10
0 1 2 3 4 5 6 Non-infected group
MDRSA infected non-treated group Phage infected non-treated group
MDRSA infected antibiotic treated group
MDRSA infected phage treated group
MDRSA infected AntPhag treated group
Days P h ys ic al a p p ea ra n ce s co re
0 1 2 3 4 5 6 7 8 9 10 0 1 2 3 4 5 6 Non-infected group
MDRSA infected non-treated group Phage infected non-treated group
MDRSA infected antiboitic treated group
MDRSA infected phage treated group
MDRSA infected AntiPhag.treated group
Days P h y si c a l a p p e a r a n c e s c o r e o f th e m ic e
Figure 10: Physical appearance graph of mice treated at 72 hrs post infection.
Survival rate was high in MDRSA infected mice groups treated 24 hrs p.i infection as compared to the once treated 72 hrs p.i. 100% survival rate was recorded in the non-infected and phage infected groups when the treatment was initiated at either
24 hrs p.i (Figure 11 A) or 72 hr p.i. (Figure 11 B). When treated at 24 hrs p.i 80% of the mice survived in the treatment groups (Figure 11 A), but not at 72 hrs p.i
0 2 4 6 8 10 12 0 20 40 60 80 100 120 Non-infected group MRSA infected. Non-treated group
Phage infected. Non-treated group
MRSA infected. Antibiotic treated group
MRSA infected. Phage treated group
MRSA infected. Antibiotic and phage cocktail treatment group A Days su rv iv al ( % )
0 2 4 6 8 10 12
0 20 40 60 80 100
120 Non-infected Controlgroup
MRSA infected. Non-treated group Phage infected. Non-treated group MRSA infected. Antibiotic treated group MRSA infected. Phage treated group MRSA infected. Antibiotic and phage cocktail treatment group B Days su rv iv al ( % )
Figure 11: Survival rates of mice treated at 24 hrs post infection (A) and 72 hrs post infection (B).
4.2.2 Efficacy of phage therapy
Results of blood culture for isolation of viable MDRSA bacteria showed that the
This was significantly different when compared with treatment groups (p > 0.001). The difference was observed when the mice were treated at either 24 hrs p.i or 72 hrs p.i. (Figure 12 and 13). The phage control group had no phage (0 PFU/ml) in
their blood from day 4 to day 10 (Figure 12 and 13). There were no bacteria in phage treated mice at day 9 when the mice were treated either at 24 hrs p.i or 72
hrs p.i. (Figure 12 and 13).
0 1 2 3 4 5 6 7 8 9 10
-2 0 2 4 6 8 10 0 5 10
MDRSA infect. non-treated grp Phage infect. non-treated grp
MDRSA infect. Anti. treated grp Non-infected group (grp)
MRDSA infect. Phage treated grp MRDSA infect. AntiPhag treated
Days L o g10 C F U / m l L o g 10 P F U / m l
0 1 2 3 4 5 6 7 8 9 10 -2 0 2 4 6 8 10 0 5 10 MDRSA infect. non-treated grp
MDRSA infect. Antibiotic treated grp
MDRSA Anti-Phag therapy grp MDRSA infect. Phag treated grp Phage infected non-treated grp
Non-infected group (grp)
DAYS L o g10 C F U /ml L o g 10 P F U /ml
Figure 13: A bacteremia and viremia level graph of mice treated 72 hrs p.i.
In both treatments (24 hrs p.i. and 72 hrs p.i.) the MDRSA infected phage treated groups had no viable bacteria in their blood samples from day 9 to 10. This was
very significant (p < 0.001) when compared with those mice that were treated with a single dose of either clindamycin or combination of clindamycin and phage (8 mg/kg/bwt clindamycin + 108 PFU/ml of phage). The results further shows that
The result of cardiac blood samples collected from the mice at study end point (day 10) from 24 hrs p.i. and 72 hrs p.i groups showed that phage treated mice had no viable bacteria count (0 CFU/ml). This was non-significantly different (p > 0.5)
when compared with the samples from non-infected and phage infected control groups which also had no bacteria. While the mice on either clindamycin or
combination treatment had viable bacteria count when treated 24 hrs p.i. This was different when the mice were treated at 72 hrs p.i., as there was trace of viable bacteria count in the blood of clindamycin treated mice. However, the mice that
were on combination dosage treatment had no viable bacteria count in their blood samples (Table 3) at study end point.
Table 3: Cardiac blood bacteria count (mean log CFU/ml + SE) at day 10 post infection
24 hrs post infection treatment
72 hrs post infection treatment Mouse group
Non-infected (naïve) control group
0.0 0.0
Phage control group 0.0 0.0
Bacteria control group 8.0± 0.2 9.0± 0.2
Antibiotic therapy 3.0 ± 0.2 1.0 ± 0.2
Phage therapy 0.0 0.0
The MDRSA isolate was isolated from the tissues’ homogenate cultures of the
MDRSA infected mice at day 10 post infection. Multi-drug resistant S.aureus
infected phage treated mice in both treatments (24 hrs p.i. and 72 hrs p.i.) had 0
CFU/ml in the organs. While the organs from other MRDSA treated groups and non-treated group (control) had bacteria CFU/ml. The viable count of bacteria was
higher in MDRSA infected mice treated with a dose of clindamycin than in the other treated groups. Combination treatment group had 0 CFU/ml of viable MDRSA isolate in the organs when they were given treatment 72 hrs post
infection. However, this result could not be achieved if the mice were treated 24 hrs p.i. These results further shows that there were no viable bacteria (0 CFU/ml)
i ii
iii iv
v vi
Figure 14: Brain homogenate pour culture plates; (i) Homogenate from non-infected group. (ii) Non-culture from Bactria control (R- bacteria colonies). (iii) Culture from antibiotic treated MDRSA infected group. (iv) Phage treated
MDRSA infected group homogenate. (v) Homogenate of MDRSA infected groups treated with combination therapeutic agent. (vi) Homogenate of phage infected non-treated group.
R
R
i ii
iii iv
v vi
Figure 15: Lungs homogenate culture plates; (i) Non-infected group. (ii) MDRSA infected non-treated group (K -bacteria colonies). (iii) MDRSA infected antibiotic treated group. (iv) MDRSA infected phage treated group. (v) MDRSA infected combination treated group. (vi) Phage infected non-treated group.
K
K
i ii
iii iv
v vi
Figure 16: Liver homogenate pour plate cultures; (i) Non-infected group. (ii) MDRSA infected non-treated group (T-bacteria colonies). (iii) MDRSA infected antibiotic treated group. (iv) MDRSA infected phage treated group. (v) MDRSA infected combination treated group. (vi) Phage infected, non-treated group
T
i ii
iii iv
v vi
Figure 17: Kidney homogenate pour plate cultures; (i) Non-infected group. (ii) MDRSA infected non-treated group (Q-bacteria colonies). (iii) MDRSA infected antibiotic treated group. (iv) MDRSA infected phage treated group. (v) MDRSA infected combination treated group. (vi) Phage infected, non-treated group.
Q
Q
Table 4: End point (day 10) viable bacteria count (mean log10 CFU/g + SE) a from organs’ homogenates.
Mouse group Brain Lungs Liver Kidney
Non-infected control
0.0 0.0 0.0 0.0
Phage control 0.0 0.0 0.0 0.0
Bacteria control 7.2 ± 0.2 7.0 ± 0.2 9.0 ± 0.2 8.6 ± 0.2
Antibiotic therapy 3.0 ± 0.2 1.0 ± 0.2 1.6 ± 0.2 5.6 ± 0.2
Phage therapy 0 0 0 0
Combination therapy
0 4.0 ± 0.2 2.0 ± 0.2 3.0 ± 0.2
a
organs were homogenized in sterile physiological saline, diluted in the same saline and plated in a selective media.
Phage was isolated from the liver organs of the mice either infected or treated with phages. Multidrug resistant S.aureus infected mice that were treated with only phage had the highest plaque count (7 – 8 PFU/ml) compared to other groups that
i Ii
iii Iv
Figure 18: Liver homogenate plaque assay cultures; (i) Non-infected groups had no plaques. (ii) Phage infected non-treated groups (S – plaques). (iii) MDRSA infected group treated with combination therapeutic agent. (iv) MDRSA infected group treated with phage.
S S
Table 5: End point phage count (mean log10 PFU/ml + SE)a from the liver. 24 hrs post infection
treatment
72 hrs post infection treatment Mouse group
Non-infected control group
0.0 0.0
Bacteria control group 0.0 0.0
Phage control group 3.0± 0.2 4.0±0.2
Antibiotic therapy 0.0 0.0
Phage therapy 7.0 ± 0.2 8.0 ± 0.2
Combination therapy 2.0 ± 0.2 3.0 ± 0.2
a
organs were homogenized in sterile physiological saline, diluted in the same saline and plated on MRSA isolate lawn.
Haemotoxylin and eosin stained tissues (brain, lung, liver and kidney) depicted the pathology of the MDRSA bacteria on the infected mice. Histopathological findings
showed the organs of non-treated MDRSA infected and clindamycin treated mice groups had severe inflammation (Figure 20, 24, 25-ii and 27). The organs of non-infected mice, phage non-infected mice and MDRSA non-infected – phage treated mice
i)
ii)
Figure 19: Brain tissues from; (i) Non-infected group, (ii) Phage infected, non-treated group (X- glial cell, H- Blood brain barrier). Magnification = X400.
X X
i)
ii)
Figure 20: Brain tissues from MDRSA infected non-infected group; B, E and G lymphocytic infiltrations (inflammation). Magnification = X400.
E
G G
i)
ii)
Figure 21: Brain tissues from; i) MDRSA infected non-treated group. ii) MDRSA infected antibiotic treated group. J and U lymphocytic infiltrations (inflammation), magnification = X 400.
J
J
i)
ii)
Figure 22: Brain tissues; i) MDRSA infected phage treated mouse (R- glial cells). ii) MDRSA infected AntiPhag treated mouse (M- glial cells N- vacuolated blood brain barrier, and Y- dead glial cells), magnification = X 400.
R
M
i)
ii)
i) .
ii)
Figure 24: Lung tissues; i) MDRSA infected non-treated mouse (a) alveoli full of mucus, (b) deflated alveoli, (c) lymphocytic infiltrated septea, (d) pockets of serous fluid (pneumonia). ii) MDRSA infected antibiotic treated mouse (e) lymphocytic infiltrated alveoli, (f) pocket of serous fluid, (g) deflated alveoli and (h) perivascular fibrosis. Magnification = X400.
d
b
c
a
h
h
f
i)
ii).
Figure 25: Lung tissues; i) MDRSA infected mouse treated with phage (K-minimal lymphocytic infiltrated septea and (L) ventilated alveoli. ii) MDRSA infected mouse treated with combination therapeutic agent (G) collapsed alveoli, (P) pockets serous fluid and (Y) perivascular fibrosis. Magnification = X 400.
P G K
Y
i)
ii)
i)
ii)
Figure 27: Liver tissues; i) MDRSA infected non-treated mouse (W) severe perivascular lymphocytic infiltration (S) severe congestion. ii) MDRSA infected mouse treated with antibiotic (T) severe perivascular lymphocytic infiltration. Magnification = X 400.
W
i)
ii)
Figure 28: Liver tissues from; i) MDRSA infected mouse treated with phage (W) non-inflammed hepatic blood vessel. ii) MDRSA infected mouse treated with combination therapeutic agent (Z) perivascular lymphocytic infiltration. Magnification = X 400
i)
ii)
i) .
ii)
i)
ii)
Kidneys histopathological findings showed no tissue damage (Figures 29 - 31). The homogenate culture of kidney tissues depicted that MDRSA infected non-treated, clindamycin and combination treated groups had viable MDRSA bacteria
CHAPTER FIVE: DISCUSSION, CONCLUSIONS, RECOMMENDATIONS AND SUGGESTION FOR FURTHER RESEARCH
5.1 Discussion
The present study has established that the S.aureus bacteria isolated from the waste
water and sewage water samples from Nairobi County and its environs were resistant to Oxacillin, macrolides (Erythromycin), aminoglycopeptides
(gentamycin and netilmicin) and glycopeptides (vancomycin) (Figure 7). An indication that the S.aureus bacterium isolate was a multidrug resistant strain. Thus, the study shows for the first time that the multidrug resistant (MDR)
S.aureus bacteria isolate has been isolated (Oduor et al., 2016) from environmental wastewater and sewage. Initially it was thought that multidrug resistant bacteria
were nosocomial pathogens (Aiken et al., 2014; Chambers & DeLeo, 2009; Omari
et al., 1997) on the contrary here the study shows that they are present in the waste and sewage water within the county of Nairobi.
The findings of this study corroborates those obtained in the USA and Sweden that
reported presence of MDR S.aureus isolate in environmental waste water and sewage water at sewage treatment plants (Börjesson et al., 2010; Naquin et al., 2015). Thus, the antibiogram results of this study (Table 2 and Figure 7) indicate
that environmental waste water and sewage water may be associated with MDR
The prevalence of multidrug resistant S.aureus in Nairobi has been increasing from 39.8 % (Omari et al., 1997b)to the current 81% (Maina et al., 2013)and probable cause might be the presence of the bacteria strains circulation in raw
sewage or reclaimed waste water. This water is used in irrigating vegetable gardens in informal settlements of Nairobi County such as Mukuru Kayaba and
Mathare slums. Multidrug resistant S.aureus strains have been isolated from environmental waste water in Mukuru Kayaba (Svabova et al., 2007)and this corroborates with the finding of this study.
Furthermore, the study successfully and confirmed the presence of S.aureus
specific lytic phages (Figure 8) in the waste and sewage water collected within Nairobi County. These findings support Chhibber et al. (2013) who established that potent phages against ATCC 43300 MRSA strain can be obtained from
sewage samples.
In mice, this study established that the lytic phages at a dose of 108 PFU/ml were well tolerated, safe and eliminated from blood circulation in 3 days post infection (Figure 12 – 13). This was further shown by the mice physical appearance score
(Figure 9 - 10) and survival rate (Figure 11), as these mice were as active as non-infected groups and all of them survived. The findings of this study also, suggest