© 2014, IJCSMC All Rights Reserved 774
Available Online at www.ijcsmc.com
International Journal of Computer Science and Mobile Computing
A Monthly Journal of Computer Science and Information Technology
ISSN 2320–088X
IJCSMC, Vol. 3, Issue. 8, August 2014, pg.774 – 787
RESEARCH ARTICLE
IMAGE QUALITY ASSESSMENT BY USING
AR PREDICTION ALGORITHM WITH
INTERNAL GENERATIVE MECHANISM
C. Naga Venkat Raam
1, K. Lakshmi Bhavani
21
M.Tech Student, Department of ECE, University College of Engineering and Technology, Acharya Nagarjuna University, Guntur, India
2
Assistant Professor, Department of ECE, University College of Engineering and Technology, Acharya Nagarjuna University, Guntur, India
ABSTRACT: The main aim of Objective image quality assessment (IQA) is to evaluate image quality consistently
with human perception. We have different types of perceptual IQA metrics but they cannot accurately represents
the degradations from different types of distortions, e.g., existing structural similarity metrics perform well on
content dependent distortions and gives the better peak signal-to-noise ratio (PSNR) but it is not well on
content-independent distortions. In this paper, we integrate the merits of the existing IQA metrics with the guide
of the recently revealed internal generative mechanism (IGM). The IGM indicates that the human visual system
actively predicts sensory information and tries to avoid residual uncertainty for image perception and
understanding. Motivated by the IGM theory, here we assume an autoregressive prediction algorithm to
decompose an input scene into two portions, the predicted portion with the predicted visual content and the
disorderly portion with the residual content. Distortions on the predicted portion causes to degrade the primary
visual information, and structural similarity procedures are employed to measure its degradation; distortions on
the disorderly portion mainly change the uncertain information and the PNSR is employed for it. Based on the
noise energy deployment on the two portions, finally we mix the two evaluation results to acquire the overall
© 2014, IJCSMC All Rights Reserved 775
I. INTRODUCTION
© 2014, IJCSMC All Rights Reserved 776
[16], indicate that the brain works with an internal generative mechanism (IGM) for visual information perception and understanding. Within the IGM, the brain performs as an inference system that actively predicts the visual sensation and avoids the residual uncertainty/disorder [15]–[17]. Thus, we adopt a Bayesian prediction model [15], [18] in our method, and the input scene is decomposed into predicted and disorderly portions. We suppose that distortions on the predicted content will damage the primary visual information, such as blur the edge and destroy the structure, which impact on image understanding. Therefore, edge and structure similarity [6], [12] are used for evaluation on this portion. On the other hand, distortions on the disorderly portion (predicted residual, which arouses uncomfortable sensation) is somewhat content independent. So we take the assumption of PSNR to estimate the degradation on disorderly uncertainty since PSNR is good for content-independent noise measurement [1], [3]. Finally, we combine the results on the two portions with an adaptive nonlinear procedure to acquire the overall score. Simulation results on six publicly available image databases confirm that the proposed model is comparable with the state-of-the-art IQA metrics.
II. PROPOSED IQA SCHEME
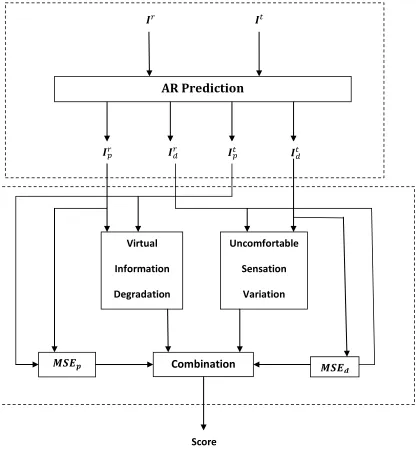
This section introduces the computational model of the proposed IQA metric in detail. We firstly decompose the reference (and test) image(s) into predicted and disorderly portions with a Bayesian prediction model. Then degradations on the two portions are evaluated respectively. Finally, we combine the results of the two portions based on error energies distribution to deduce the overall perceptual quality score. The flowchart of the proposed model is shown in Fig. 1.
A. AR Based Image Prediction
© 2014, IJCSMC All Rights Reserved 777
Fig. 1 Flowchart of the proposed model is the reference (test) image, and
are the predicted and disorderly portions of respectively.
We adopt a Bayesian prediction based autoregressive (AR) model [18], [32] for image content inference. The Bayesian brain theory uses Bayesian probability to imitate the inference procedure for image perception and understanding in the IGM [15], [16]. The key of this theory is a probabilistic model that optimizes the input scene by minimizing the prediction error. For example, with an input scene, the Bayesian brain system tries to maximize the conditional
AR Prediction
Combination
Virtual
Information
Degradation
Uncomfortable
Sensation
Variation
© 2014, IJCSMC All Rights Reserved 778
probability between the central pixel x and its surrounding [15] for
error minimization. By decomposing the conditional probability ( ) and analyzing the
correlation between the central pixel x and the pixels xi in the surrounding X, it can be seen that
these xi which strongly correlated to x play dominant roles for maximization [33].
Therefore, the mutual information between the central pixel x and its surrounding
pixel xi is adopted as the autoregressive coefficient, and an AR model is created to predict the value of the pixel x [32],
∑ (1)
Where is the predicted value of pixel ∑ being the normalized coefficient, and
is white noise. In this paper, we set as a 21 × 21 surrounding region. With the predicted model
(1), an input image (I ) is decomposed Into two portions, the predicted image and the
disorderly image ( ), as shown in Fig. 2. In the next subsections, we will evaluate the
degradations on the two decomposed images, respectively, since distortions on the two portions have different impacts toward the perceptual quality.
B. Uncomfortable Sensation Variation
The disorderly portion is composed of the uncertain stimuli of the original image [16]. Distortion on this portion has little effect on image understanding and mainly generates uncomfortable sensation. As a natural way to define the energy of the error signal [1], the PSNR metric presents a good match with the HVS when the error signal is independent of the original signal [3], and this point is also confirmed by the experiments in [2]. Since the distortion of the disorderly portion is independent of the original image content, the PSNR is adopted to evaluate the quality of this portion. Therefore the uncomfortable sensation variation is computed as follow
© 2014, IJCSMC All Rights Reserved 779
where and are the disorderly portions of the reference and test images, respectively;
is the PSNR value between and , and is the mean squared error
between and (the minimal value of MSE (such as 1) is set to avoid infinite psnr); is a
constant parameter which is used to normalize the PSNR value into the range [0 1], for this
purpose, we set
C. Visual Information Degradation
Since the predicted portion possesses the primary visual information and distortion on this portion impacts on image understanding, we should adopt some high-level HVS properties to evaluate the degradation of the visual information. In this paper, degradations on edge and structure are computed for primary visual information fidelity evaluation. The HVS is highly sensitive to the edge, which conveys important visual information and is crucial for scene understanding [12], [34]. The degradation on the edge between the predicted portions of the
reference image and the test image ( ) is computed as their edge height similarity,
( ) ( ) ( )
( ) ( ) (3)
Where and are the corresponding pixels from the predicted portions of the reference and
test images ( ), respectively; is the edge similarity between and , and
are the edge height maps of and , respectively, is the small constant to avoid the
denominator being zero and is set as [6], and L is the gray level of the image.
The edge height (same for ) is computed as the maximal edge response along the four
directions [27],
(4)
© 2014, IJCSMC All Rights Reserved 780
(a) (b) (c)
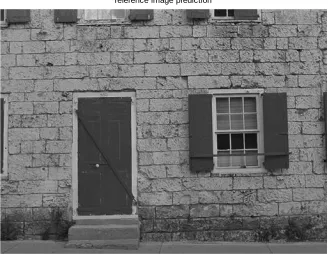
Fig. 2. Image decomposition with the Bayesian prediction-based AR model. (a) Original image.
(b) Predicted portion. (c) Disorderly portion (pixel values have been scaled to [0, 255] for a clearer view).
(a) (b) (c) (d)
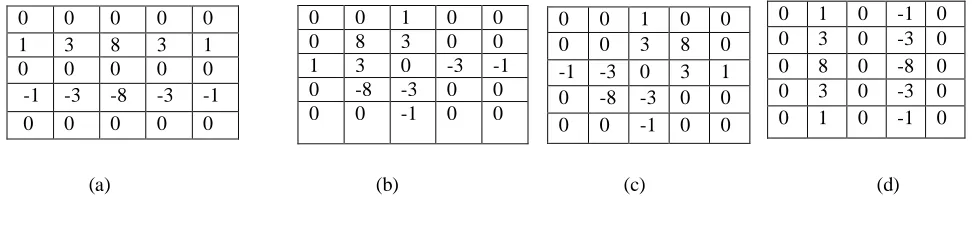
Fig. 3. Edge filters for four directions. (a) Horizontal. (b) 45 degrees. (c) 135 degrees. (d) Vertical
where are four directional filters, as shown in Fig. 3, ϕ = 1/16, and symbol denotes the
convolution operation. However, some image regions (e.g., the feather of the parrots in Fig. 2) has no apparent edge but still represents specific structural character. In addition, the HVS is highly adapted for extracting structural information from a scene for recognition. Therefore, besides edge similarity, we need another primary visual information degradation measurement to evaluate the fidelity on image structure. Here, we adopt the structural similarity [6] to evaluate the degradation on structural information
( )
(6)
where is the structural similarity between patches ( ( ) ( )) centered at and
; is the covariance of the two patches; is the variance of patch
0 1 0 -1 0
0 3 0 -3 0
0 8 0 -8 0
0 3 0 -3 0
0 1 0 -1 0
0 0 0 0 0
1 3 8 3 1
0 0 0 0 0
-1 -3 -8 -3 -1
0 0 0 0 0
0 0 1 0 0
0 8 3 0 0
1 3 0 -3 -1
0 -8 -3 0 0
0 0 -1 0 0
0 0 1 0 0
0 0 3 8 0
-1 -3 0 3 1
0 -8 -3 0 0
© 2014, IJCSMC All Rights Reserved 781
( ( ) ( )) ; we set the patch size as 11 × 11, and the constant (the same as in [6]).
Combining the edge and structure similarities, we deduce the degradation on primary visual information as
( ) ( ) (7)
D. Overall Perceptual Quality
Distortions on the two portions codetermine the quality of the contaminated image. The distortion on the disorderly portion degrades image quality by disturbing our attention and arousing uncomfortable sensation. On the other hand, the distortion on the predicted portion changes the original visual content and affects image understanding. Therefore, we combine the evaluation of the two portions, (2) and (7), to acquire the perceptual quality score
(8)
where V is the pooling value of the predicted portion (mean value of all ); the
parameters and are used to adjust the relative importance of the two portions. The weights of the two evaluation parts, P and V, are closely related to the noise energy level on the two decomposed portions. The more noise energy that one decomposed portion possesses, the more important role it will play. For example, if most of the noise is in the disorderly portion, the noise mainly arouses uncomfortable sensation and the uncomfortable sensation variation is dominant in the quality assessment. Thus a big value of is required in (8) to highlight the evaluation result of the disorderly portion (P). On the contrary, when the noise is mainly in the predicted portion, the quality degradation is primarily caused by the change of the primary visual information. A big value of is needed to highlight the evaluation result of the predicted portion (V). According to the analysis above, we compute the importance parameter based on the noise energies of the two portions, and we set
© 2014, IJCSMC All Rights Reserved 782
where is the energy of noise between the disorderly portions of the reference image ( )
and the test image ; is the energy of noise between the two predicted
images , and [0 1]. Meanwhile, as same as (9),
we set . Moreover, considering the viewing conditions [35] (i.e.,
the viewing distance and the display resolution), multiscale evaluation is adopted to deduce the overall quality score,
∏ (10)
where is the perceptual quality score on the level based on (8), the parameter ρ defines the
relative importance of different scales, and its value is set as ρ = [0.0448, 0.2856, 0.3001, 0.2363, 0.1333] [35], which is obtained through psychophysical experiment.
III. SIMULATION RESULTS
Fig : Reference image
Fig : Disorder image
reference image
© 2014, IJCSMC All Rights Reserved 783 Fig : Reference Disorder image
Fig : Reference prediction image
Fig : Disorder of Disorder image
reference image disorder
reference image prediction
© 2014, IJCSMC All Rights Reserved 784 Fig : Disorder of Prediction image
IV. CONCLUSION
This paper introduces a novel IQA metric by integrating the best existing IQA metrics. SSIM and GSIM perform well on dependent distortions but not well enough on content-independent distortions. However PSNR/MSE performs the opposite way. So we integrate the merits of these metrics by decomposing the input scene into predicted and disorderly portions, and distortions on these two portions are discriminatively treated. The decomposition is inspired by the recent IGM theory which indicates that the HVS works with an internal inference system for sensory information perception and understanding, i.e., the IGM actively predicts the sensory information and tries to avoid the residual uncertainty/disorder. Since the predicted portion holds the primary visual information and the disorderly portion consists of uncertainty, the distortions on the two portions cause different aspects of quality degradations. Distortions on the predicted portion will affect the understanding of the visual content, and that on disorderly portion mainly arouse uncomfortable sensation. Considering the different properties of the two decomposed portions, we separately evaluate their quality degradations. Firstly, a Bayesian prediction model is adopted to decompose the reference and test images into predicted and disorderly portions, respectively. Then we evaluate the content degradation on their predicted portions with the measurement based on edge and structure similarities, and uncomfortable sensation variation between the disorderly portions of the reference and test images with the PSNR measurement. Finally, according to the noise energy level, we combine the results of the two portions to acquire the overall quality score. Experiments on individual distortion types demonstrate the effectiveness of the proposed metric. Moreover, Simulation results show better performance comparable with the state-of-the-art quality metrics.
© 2014, IJCSMC All Rights Reserved 785
REFERENCES
[1] Z. Wang and A. C. Bovik, ―Mean squared error: Love it or leave it?‖ IEEE Signal Process. Mag., vol. 26, no. 1,
pp. 98–117, Jan. 2009.
[2] Q. Huynh-Thu and M. Ghanbari, ―Scope of validity of PSNR in image/video quality assessment,‖ Electron. Lett., vol. 44, no. 13, pp. 800–801, Jun. 2008.
[3] N. Ponomarenko, V. Lukin, A. Zelensky, K. Egiazarian, M. Carli, and F. Battisti, ―TID2008—a database for evaluation of full-reference visual quality assessment metrics,‖ Adv. Modern Radioelectron., vol. 10, pp. 30–45, May 2009.
[4] H. R. Sheikh, A. C. Bovik, and G. de Veciana, ―An information fidelity criterion for image quality assessment using natural scene statistics,‖ IEEE Trans. Image Process., vol. 14, no. 12, pp. 2117–2128, Dec. 2005.
[5] N. Damera-Venkata, T. D. Kite, W. S. Geisler, B. L. Evans, and A. C. Bovik, ―Image quality assessment based on a degradation model,‖ IEEE Trans. Image Process., vol. 9, no. 4, pp. 636–650, Apr. 2000.
[6] Z. Wang, A. Bovik, H. Sheikh, and E. Simoncelli, ―Image quality assessment: From error visibility to structural similarity,‖ IEEE Trans. Image Process., vol. 13, no. 4, pp. 600–612, Apr. 2004.
[7] H. R. Sheikh and A. C. Bovik, ―Image information and visual quality,‖ IEEE Trans. Image Process., vol. 15, no. 2, pp. 430–444, Feb. 2006.
[8] N. Ponomarenko, F. Silvestri, K. Egiazarian, M. Carli, J. Astola, and V. Lukin, ―On between-coefficient contrast masking of DCT basis functions,‖ in Proc. 3rd Int. Workshop Video Process. Quality Metrics Consumer Electron.,
Jan. 2007, pp. 1–10.
[9] D. M. Chandler and S. S. Hemami, ―VSNR: A wavelet-based visual signal-to-noise ratio for natural images,‖
IEEE Trans. Image Process., vol. 16, no. 9, pp. 2284–2298, Sep. 2007.
[10] E. C. Larson and D. M. Chandler, ―Most apparent distortion: Fullreference image quality assessment and the role of strategy,‖ J. Electron. Imag., vol. 19, no. 1, pp. 011006-1–011006-21, 2010.
[11] L. Zhang, L. Zhang, X. Mou, and D. Zhang, ―FSIM: A feature similarity index for image quality assessment,‖
IEEE Trans. Image Process., vol. 20, no. 8, pp. 2378–2386, Aug. 2011.
[12] A. Liu, W. Lin, and M. Narwaria, ―Image quality assessment base on gradient similarity,‖ IEEE Trans. Image Process., vol. 21, no. 4, pp. 1500–1512, Apr. 2012.
[13] G. Cheng, J. Huang, C. Zhu, Z. Liu, and L. Cheng, ―Perceptual image quality assessment using a geometric
structural distortion model,‖ in Proc. IEEE 17th Int. Conf. Image Process., Sep. 2010, pp. 325–328..
[14] D. C. Knill and A. Pouget, ―The Bayesian brain: The role of uncertainty in neural coding and computation,‖ Trends Neurosci., vol. 27, no. 12, pp. 712–719, 2004.
[15] K. Friston, ―The free-energy principle: A unified brain theory?‖ Nat. Rev. Neurosci., vol. 11, no. 2, pp. 127– 138, Feb. 2010.
[16] G. Zhai, X. Wu, X. Yang, W. Lin, and W. Zhang, ―A psychovisual quality metric in free-energy principle,‖ IEEE Trans. Image Process., vol. 21, no. 1, pp. 41–52, Jan. 2012.
© 2014, IJCSMC All Rights Reserved 786
[18] P. Jacob and M. Jeannerod, Ways of Seeing: The Scope and Limits of Visual Cognition. London, U.K.: Oxford Univ. Press, 2003.
[19] R. Sternberg, Cognitive Psychology, 3rd ed. Belmont, CA: Wadsworth, Aug. 2003.
[20] K. J. Friston, J. Daunizeau, and S. J. Kiebel, ―Reinforcement learning or active inference?‖ PLoS ONE, vol. 4, no. 7, pp. 6421-1–6421-13, 2009.
[21] K. Friston, J. Kilner, and L. Harrison, ―A free energy principle for the brain,‖ J. Physiol. Paris, vol. 100, nos. 1– 3, pp. 70–87, Sep. 2006. [23] M. Eckert, ―Perceptual quality metrics applied to still image compression,‖ Signal Process., vol. 70, no. 3, pp. 177–200, Nov. 1998.
[22] N. Ponomarenko and K. Egiazarian. Tampere Image Database 2008 TID2008 (2008). [Online]. Available: http://www.ponomarenko.info/ tid2008.htm
[23] A. Buades, B. Coll, and J. Morel, ―A non-local algorithm for image denoising,‖ in Proc. IEEE Comp. Soc. Conf. Comput. Vision Pattern Recogn., vol. 2. Jun. 2005, pp. 60–65.
[24] V. Katkovnik, A. Foi, K. Egiazarian, and J. Astola, ―From local kernel to nonlocal multiple-model image denoising,‖ Int. J. Comput. Vision, vol. 86, pp. 1–32, Jul. 2009.
[25] X. K. Yang, W. S. Ling, Z. K. Lu, E. P. Ong, and S. S. Yao,―Just noticeable distortion model and its applications in video coding,‖ Signal Process. Image Commun., vol. 20, no. 7, pp. 662–680, 2005.
[26] A. Liu, W. Lin, M. Paul, C. Deng, and F. Zhang, ―Just noticeable difference for images with decomposition model for separating edge and textured regions,‖ IEEE Trans. Circuits Syst. Video Technol., vol. 20, no. 11, pp. 1648–1652, Nov. 2010.
[27] D. Kersten, P. Mamassian, and A. Yuille, ―Object perception as Bayesian inference,‖ Ann. Rev. Psychol., vol. 55, pp. 271–304, Feb. 2004.
[28] X. Zhang and X. Wu, ―Image interpolation by adaptive 2-D autoregressive modeling and soft-decision estimation,‖ IEEE Trans. Image Process., vol. 17, no. 6, pp. 887–896, Jun. 2008.
[29] M. Vasconcelos and N. Vasconcelos, ―Natural image statistics and lowcomplexity feature selection,‖ IEEE Trans. Pattern Anal. Mach. Intell., vol. 31, no. 2, pp. 228–244, Feb. 2009.
[30] C.-H. Chou and Y.-C. Li, ―A perceptually tuned subband image coder based on the measure of just-noticeable distortion profile,‖ IEEE Trans. Circuits Syst. Video Technol., vol. 5, no. 6, pp. 467–476, Dec. 1995.
[31] Z. Wang, E. Simoncelli, and A. Bovik, ―Multiscale structural similarity for image quality assessment,‖ in Proc. Signals Syst. Comput. Conf. Rec. 37th Asilomar, vol. 2. 2003, pp. 1398–1402.
[32] Final Report from the Video Quality Experts Group on the Validation of Objective Models of Video Quality Assessment II. (2003) [Online]. Available: http://www.vqeg.org/
[32] Z. Wang and Q. Li, ―Information content weighting for perceptual image quality assessment,‖ IEEE Trans. Image Process., vol. 20, no. 5, pp. 1185–1198, May 2011.
[33] E. C. Larson and D. M. Chandler. Categorical Image Quality (CSIQ) Database (2010). [Online]. Available: http://vision.okstate.edu/csiq
© 2014, IJCSMC All Rights Reserved 787
[35] A. Ninassi, P. L. Callet, and F. Autrusseau. Subjective Quality Assessment—IVC Database (2005). [Online]. Available: http://www2.irccyn.ec-nantes.fr/ivcdb
BIOGRAPHY
C. Naga Venkat Raam obtained B.E degree in Electronics and communication Engineering from Nagarjuna University in 2009. He is M.Tech (ECE) student at Acharya Nagarjuna University College of Engineering and technology, Guntur, India. His areas of interest are Image processing, Signal Processing and embedded systems.
K. Lakshmi Bhavani obtained B.Tech degree in Electronics and communication Engineering from JNTU university. She received her M.Tech degree from JNTU University. She is currently working as Assistant Professor in Department of ECE in University College of Engineering and