© 2014, IJCSMC All Rights Reserved
752
Available Online atwww.ijcsmc.com
International Journal of Computer Science and Mobile Computing
A Monthly Journal of Computer Science and Information Technology
ISSN 2320–088X
IJCSMC, Vol. 3, Issue. 9, September 2014, pg.752 – 757
RESEARCH ARTICLE
LOCATION AWARE ADAPTIVE
ROUTING PROTOCOLS IN VANETS
Pooja Malik
Department of Computer Science & Engineering,
R.N College of Engineering & Management, Rohtak
[email protected]
Vikram Nandal
Department of Computer Science & Engineering,
R.N College of Engineering & Management, Rohtak
[email protected]
ABSTRACT: Vehicular Ad hoc Network (VANET) is an ad hoc network composed of highly
mobile vehicle nodes. A new routing protocol Modified Geographic Routing Over VANET
(MGROOV) is proposed to improve the efficiency of VANETs in terms of Packet Delivery Ratio
(PDR) and Average End to End Delay. We introduce the use of connection reliability, distance
factor and direction as factors for the selection of relay node. On simulation using ns-2 results
show that proposed work achieved high level of efficiency in both city and highway scenario
when compared to AODV and DSDV
1.
INTRODUCTION
1.1 Ad-Hoc Networks:
An ad hoc network is defined as ―... an autonomous system of routers (and associated hosts) connected by wireless links—
the union of whose form an arbitrary graph. The routers are free to move randomly and organize themselves arbitrarily; thus,
the network's wireless topology may change rapidly and unpredictably. Such a network may operate in a standalone fashion,
© 2014, IJCSMC All Rights Reserved
753
A wireless ad hoc network is a decentralized type of wireless network. The network is ad-hoc because it does not rely on a
pre-existing infrastructure, such as routers [1]. Instead, each node participates in routing by forwarding data for other nodes,
and so the determination of which nodes forward data is made dynamically based on the network connectivity. It is
Client-Client or Peer-Peer model.
1.2 Vanets:
VANETs stand for the Vehicular Ad-hoc NETworks. A VANET is effectively a subset of MANETs. A MANET is a self
forming network, which can function without the need of any centralized control. Each node in an ad hoc network acts as
both a data terminal and a router [2]. The nodes in the network then use the wireless medium to communicate with other
nodes in their radio range. The benefit of using ad hoc networks is it is possible to deploy these networks in areas where it
isn't feasible to install the needed infrastructure. Another benefit of ad hoc networks is they can be quickly deployed with no
administrator involvement. The administration of a large scale vehicular network would be a difficult task. These reasons
contribute to the ad hoc networks being applied to vehicular environments.
2.
RELATED WORK
In VANETs, the main aim of the routing protocols is to increase the packet delivery ratio and decrease the end to end delay.
Each vehicle in the network is equipped with GPS to obtain its location information. Every vehicle knows its own
coordinates. The source vehicle packets its own position into beacon message so that the neighboring vehicles forward
packets to the destination according to the beacon message. In a fixed time interval, each vehicle exchanges the information
of the neighboring vehicles and updates the neighbor list tables by beacon messages. Here, the neighboring vehicle means
the one-hop neighbor. The packet delivery ratio and end to end delay depend upon the beacon interval. If the beacon interval
is low then the redundancy increases leading to high end to end delay although it might increase the PDR a bit. On the other
hand to decrease the end to end delay if beacon interval is kept high the PDR decreases. The beacon interval is decided on
the basis of the environment in which the vehicle is, whether it is in city environment or the highway environment. In the
city scenario the density of the vehicles is quite high and in case of the highway scenario the density of vehicle is quite less. The current routing protocols can’t sense the changing scenarios so also can’t adapt to them. As result it might lead to packet
dropping, increasing end to end delay, decreasing PDR. To overcome these problems we have proposed a new protocol that
will adapt itself to changing road environments. In addition to the position, velocity and direction attributes of the beacon
message, two addition variables will be used. In order to incorporate the past behavior of a node into relay node selection
criteria to increase the probability of message delivery, a new parameter is added i.e. connection reliability. This will be
predicted on the basis of the speed variations of the vehicle. To minimize the chances of packet dropping resulting from the movement of the chosen node outside the relay node’s transmission range another parameter is introduced i.e. distance
factor.
Position Routing Protocol:
Position based/geographic routing employs the awareness of vehicle about the position of other vehicles to develop a routing
strategy.
The Position based routing protocols such as GPSR, GSR, SAR combine the position information with topological
knowledge about the road and the surroundings. The idea is to build a spatial model representing the underlying road
© 2014, IJCSMC All Rights Reserved
754
where vertices are crossroads and edges are road segments. The edges of the graph are weighted with static data extracted
from the street maps.
3.
PROPOSED WORK
:In this thesis a new position based routing has been introduced with the aim of increasing the packet delivery ratio and to
decrease the end-to-end delay. We have analyzed, simulated it and comparison has been drawn to earlier position based
routing protocol in order to show how the proposed algorithm is better and efficient than the earlier ones. The main focus of
the thesis structure is to calculate the most accurate position coordinates and the routing of the packet in correct direction of
the destination so that minimum number of hops is required that will also decrease end-to-end delay.
Two new parameters are introduced namely:
Connection Reliability: to increase the probability of message delivery.
3.1 Algorithm For Calculating Connection Reliability(R):
STEP1. If the node is new in the neighbor table, then
Set R: =3,
Else
Go to next step.
STEP2. If the change in speed is ±5 to ±10, then
R remains same,
Else
Go to next step.
STEP3. If the change in speed < ±5, then
If R < 5, then
Set R: = R+1
Else R remains same.
Else Go to next step.
STEP4. If the change in speed > ±10, then
If R > 1, then
Set R: = R -1
Else R remains same.
Else Exit.
Distance Factor- To minimize the chances of packet dropping.
3.2
Algorithm To Find The Distance Factor (D):
STEP1. Set the transmission range of the node to be T.
STEP2. Divide the transmission range of the vehicle in to five regions with boundaries T/5, 2T/5, 3T/5, 4T/5, T.
STEP3. If the neighboring node lies in the region T/5, then
© 2014, IJCSMC All Rights Reserved
755
ElseGo to next step.
STEP4. If the neighboring node lies in the region T/5 to 2T/5, then
Set D: =2,
Else
Go to next step.
STEP5. If the neighboring node lies in the region 2T/5 to 3T/5, then
Set D: =3,
Else
Go to next step.
STEP6. If the neighboring node lies in the region 3T/5 to 4T/5, then
Set D: =5,
Else
Go to next step.
STEP7. If the neighboring node lies in the region 4T/5 to T, then
Set D: =4,
Else
Exit.
4.
RESULT AND ANALYSIS
4.1 Simulators Used
:Network Simulator-2 (NS-2) is a simulation environment for large wireless and wire line communication networks.Ns-2
appeared as a network simulator that provides a significant simulation of transport, routing and unicast over wired and
wireless networks. Ns-2 code is written in C++ and OTCL and is kept in a separate file that is executed by OTCL
interpreter, thus generating as output file for Network Animator (NAM). It then plots the nodes in position defined by the
code script and exhibits the output of the nodes communicating with each other
VanetMobiSim- The Vehicular Ad Hoc Networks Mobility Simulator (VanetMobiSim) is a set of extensions to
CanuMobiSim, a framework for user mobility modelling. The framework includes a number of mobility models, as well as
parsers for geographic data sources in various formats, and a visualization module. The set of extensions provided by
VanetMobiSim consists mainly on a vehicular spatial model using GDF-compliant data structures, and a set of
vehicular-oriented mobility models.
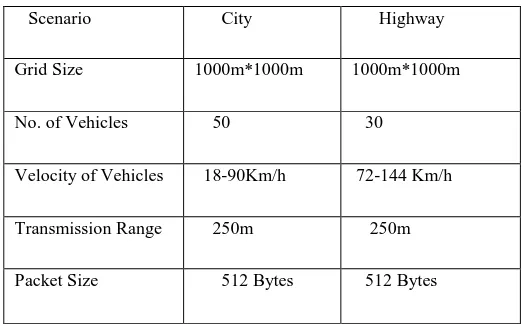
4.2 Simulation Parameters:
The simulation of our thesis is performed using Network Simulator tool. A grid of size 1000m*1000m has been selected as
the simulation area. In an effort to mirror real life on-road scenarios, simulations are carried out at varying vehicle densities.
The number of vehicles is 50 in city and 30 in highway scenario. The vehicles move at randomly chosen speeds ranging
from 18 to 90 km/h in city and 72 to 144 km/h in highway scenario i.e. in effect, vehicles have different accelerations at
© 2014, IJCSMC All Rights Reserved
756
Table 1.1 Simulation Parameters
Scenario City Highway
Grid Size 1000m*1000m 1000m*1000m
No. of Vehicles 50 30
Velocity of Vehicles 18-90Km/h 72-144 Km/h
Transmission Range 250m 250m
Packet Size 512 Bytes 512 Bytes
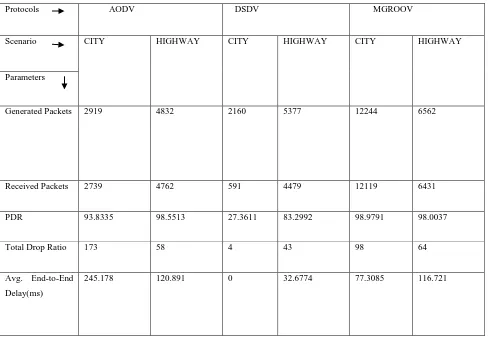
4.3 Output Comparison Table:
In the comparison table, the proposed protocol MGROOV is compared with AODV and DSDV for the parameters such as
Generated Packets, Received Packets, Packet Delivery Ratio, Total Dropped Packets and Average End-To-End Delay. Here
is a brief description of all of
them-(i)Generated Packets- It is defined as the total number of packets generated by the source to transmit into the network.
(ii)Received Packets- It is defined as the total number of packets received by the destination that are generated by the
source.
(iii) Packet Delivery Ratio- It is the total number of packets transmitted by the source to the total number of packets
received by the destination. The basic idea for PDR to choose reliable routes. 100% delivery means receiver receive all
packets sent by sender node before time period expires. It may be affected by different factors such as packet size, group
size, range and mobility of nodes.
(iv) Total Drop Ratio- It is defined as the ratio of total number of packets dropped to the total number of packets
transmitted within a particular time interval.
(v) Average End-to-End Delay- The average time taken by a data packet to reach the destination. It also includes the delay
caused by route discovery process and the queue in data packet transmission. Only the data packets that successfully
delivered to destination are counted.
As Shown in Table 1.2
5.
CONCLUSION
We concluded that the efficiency of VANETS in terms of Packet Delivery Ratio and Average End-To-end Delay in fickle
road environments with varying traffic densities and it has been proved that the proposed technique adapts itself to the
varying densities and varying vehicle velocities and thus providing high packet delivery ratio and lower average end to end
© 2014, IJCSMC All Rights Reserved
757
REFERENCES:
[1] A. Nandan, S. Das, G. Pau, and M. Gerla, ―Co-operative downloading in vehicular ad-hoc wireless networks,‖ in
Proceedings Second Annual IEEE Conference on Wireless On-demand Network Systems and Services (WONS’05), St.
Moritz, Switzerland, January 2005, pp. 32–41.
[2] Car-to-Car communication consortium http://www.car-2-car.org/.
[3] Dedicated Short Range Communications (DSRC) Home, http://www.leearnstrong.com/DSRC/DSRCHomeset.htm
[4] Taleb, T. et al. "A Stable Routing Protocol to Support ITS Services in VANET Networks." IEEE Transactions on
Vehicular Technology. vol. 56.no. 6. 3337-3347. November, 2007.
[5] L. A. Latiff, A. Ali, Chia-Ching,Ooi, N. Fisal; ―Location-based Geocasting and Forwarding (LGF) Routing Protocol in
Mobile Ad Hoc Network‖, Proceedings of the Advanced Industrial Conference on Telecommunications/Service Assurance
with Partial and Intermittent Resources Conference/ELearning on Telecommunications Workshop, 2005 IEEE.
Table 1.2 Output Comparison
Protocols AODV DSDV MGROOV
Scenario CITY HIGHWAY CITY HIGHWAY CITY HIGHWAY
Parameters
Generated Packets 2919 4832 2160 5377 12244 6562
Received Packets 2739 4762 591 4479 12119 6431
PDR 93.8335 98.5513 27.3611 83.2992 98.9791 98.0037
Total Drop Ratio 173 58 4 43 98 64
Avg. End-to-End
Delay(ms)
245.178 120.891 0 32.6774 77.3085 116.721