Article
Optimized Surge Arrester Allocation Based on
Genetic Algorithm and ATP Simulation in Electric
Distribution Systems
Gabriel Vianna Soares Rocha1,* , Raphael P. S. Barradas1,*, João Rodrigo S. Muniz1,*, Ubiratan H. Bezerra1,*, Igor M. Araújo2, Daniel S. A. Costa1, Abner C. Silva2, Marcus V. A. Nunes1and Jucileno S. Silva3
1 CEAMAZON - Amazon Energy Efficiency Center, Federal University of Pará (UFPA), Ave. Perimetral 2651,
Guamá, 66077-830 Belém, PA, Brazil
2 LINC - Laboratory of Computational Intelligence, Federal University of Pará (UFPA), St. Augusto Correa 01,
Guamá, 66075-110 Belém, PA, Brazil
3 CELPA - Electric Distribution Utility of Pará, Ave. Augusto Montenegro 5639-5671, 66645-001, Castanheira,
Belém, PA, Brazil
* Authors to whom correspondence should be addressed. Correspondence: [email protected] (G.V.S.R.); [email protected] (R.P.S.B.); [email protected] (J.R.S.M.); [email protected] (U.H.B.)
1
2 3 4
5 6 7 8
9 10 11 12
13
Abstract:Lightningdischargesinelectricpowernetworksgeneratevoltageandcurrentsurgesthat arepropagatedthrough theelectrical networkcausingdamageandshutdownsin theelectrical system.Toprotectthesystemagainstthesephenomena,surgearrestersareveryeffectiveandwidely usedbyelectricalutilitiesintheirelectricgrids.Thispaperpresentsamethodologyforoptimized surgearrester allocationbasedongeneticalgorithm(GA), creatingasimulationenvironmentin thesoftwareATP(AlternativeTransientsProgram)toimplementtheproposedmethodology.The optimizedallocationprocedureisbasedonafitnessfunctionthatminimizesthecostofsurgearresters andmaximizesthenumberofprotectedequipment.Tocarryoutthisoptimizedarresterallocation procedureusingATPmaydemandtoomuchprocessingtimewhenrunninglargedistributiongrids. Toovercomethisdifficultyaprocedureisproposedtoobtainanovervoltageseveritydescriptionof thegridandselectthemostcriticalelectricnodesfortheincidenceoflightningdischarges,intheGA allocationprocedure.ThecasestudyisappliedtotheIEEE123-buselectricalfeedertodemonstrate theeffectivenessoftheproposedmethodology.
Keywords:TransientAnalysis;SurgeArresterAllocation;GeneticAlgorithm;ATP
14
1. Introduction 15
Lightning discharges and operational maneuvers, like switching of capacitor banks (CB), can
16
generate overvoltage that propagates in the electrical network. The increased levels of voltage in
17
distribution networks cause concern to electric power utilities, because the presence of overvoltage
18
can cause, among others, malfunctioning and reduction of lifespan of equipment and devices, and in
19
some cases might even cause permanent failures that may result in partial or complete shutdown of
20
the electrical network. In addition to the losses due to equipment damage, if the electric power utility
21
remains too long with no power supply, it shall be subjected to penalties which may reach significant
22
values as the shutdown time period increases.
23
So, using mitigating measures is essential in order to avoid these costs, and as important as
24
mitigation, it is to conduct preventive measures in order to protect the equipment and the electrical
25
grid against overvoltage. One way to achieve equipment protection against high levels of overvoltage
26
is through the installation of surge arresters along the power grid. A surge arrester, as long as it is
27
properly grounded, is able to damp overvoltage, sending part of the electrical current to ground.
28
A recurring problem among electric utilities is how to define an efficient methodology to perform
29
surge arresters allocation along the electric network. To perform this allocation in an efficient manner,
30
it is recommended to take into consideration the optimal placement of surge arresters along the power
31
grid. In addition to maintaining the quality of power delivered to consumers by keeping the voltage
32
levels below the system insulation limit, it is of great importance to ensure the equipment protection
33
and secure operation, as well as allow better planning on future equipment installation.
34
This article presents a methodology for surge arresters optimal allocation in electric networks
35
based on genetic algorithm (GA). For each individual of the GA population the electric grid is
36
automatically configured with a combination of surge arresters, which performances are evaluated
37
through electromagnetic transient simulation using ATP.
38
Two main aspects differentiate this work with respect to others found in the literature. The first
39
one is the use of a fitness function that takes into account weight factors to distinguish the desired
40
protection level for electrical nodes and equipment individually, and also considering restrictions on
41
the number of surge arresters to be allocated. This aims at maximizing the protection level and at the
42
same time minimizing the number of surge arresters needed, which allows the user to configure the
43
problem focus through the definition of the fitness function. The second aspect to be highlighted is the
44
proposed procedure to select the most critical points in the electric network concerning the incidence
45
of lightning discharges. This procedure makes possible to apply the optimal surge arrester allocation
46
even in large electrical networks using ATP. Many works can be found in literature whose focus is the
47
optimized allocation of surge arresters using metaheuristics and among them one can mention the
48
following papers.
49
In [1] and [2] it was developed a computer application to determine the surge arresters optimal
50
allocation in power systems minimizing the risk of failure, thus permitting the selection of appropriate
51
protection schemes for each electrical network. As a consequence, protection costs are reduced in
52
accordance to the costs of the elements actually protected, ensuring the continuity of service. It was
53
used the software Matlab and its toolboxes Simulink and Powersys to simulate the electric networks.
54
In[1] the proposed procedure is based on statistical analysis of voltage surges and fuzzy logic
55
techniques with the objective of establishing arresters locations that provide risks of failure at network
56
nodes that are lower than the admissible limits. In [2] the proposed method is also based on statistical
57
analysis of voltage surges but using Monte Carlo method and mathematical techniques to find the
58
minimum risk of failure based on the gradient method. However, it can be only applied to single-phase
59
electrical networks. In [2] the surge arresters allocation optimization is made by using a formulation
60
based on genetic algorithms. The Monte Carlo method is used for estimating the electric distribution
61
network lightning performance. The methodology is implemented in a software which links the
62
YALUK-ATP and the genetic algorithm. The initial population is randomly generated, and the fitness
63
function is set to minimize the percentile 60 or 90 of the probability distribution curve of the distribution
64
network voltages.
65
In [3] the surge arresters allocation optimization is made by using a formulation based on genetic
66
algorithms. The Monte Carlo method is used for estimating the electric distribution network lightning
67
performance. The methodology is implemented in a software which links the YALUK-ATP and the
68
genetic algorithm. The initial population is randomly generated, and the fitness function is set to
69
minimize the percentile 60 or 90 of the probability distribution curve of the distribution network
70
voltages.
71
In [4] the surge arrester allocation optimization is made based on genetic algorithm and network
72
simulations with a developed electromagnetic transients program software. The fitness function is set
73
to minimize overvoltage in a specific number of towers. Induced lightning discharges are used in the
74
simulation studies.
The method presented in [5] is based on genetic algorithms and an economic approach is taken
76
into account by means of evaluating the cost of flashover insulation. Only indirect lightning is taken
77
into account. The computer application was developed in MATLAB environment, and the simulation
78
software to calculate the induced overvoltage is the ATP. After modeling the grid, ATP generates a
79
plain file containing the grid data which are imported into MATLAB. So, each characteristic such as
80
lightning and surge arresters parameters can be modified in the MATLAB environment. It is assumed
81
that a flashover occurs when the maximum overvoltage is greater than 1.5VCFO(Critical Flashover
82
Voltage). The initial population is randomly generated.
83
2. Proposed Metodology 84
To perform the surge arrester allocation using the proposed GA procedure, firstly it is necessary
85
to model the electrical network via ATP input cards, which serve as template for the genetic algorithm.
86
This template can be constructed manually by using ATPDraw module or automatically by using the
87
procedure as presented in [6].
88
Once the template is built, it is necessary to choose in the electrical network under study, the
89
critical electric nodes to apply lightning discharges, which will propagate voltage and current surges
90
along the power grid [7]. It is important that all genetic individuals created in all populations of the
91
GA evolution be tested in the same scenario, with the same lightning incidence points, otherwise
92
it is considered that the GA individuals represent distinct scenarios. Before presenting the genetic
93
algorithm configuration it is necessary to introduce some concepts that were used in the proposed
94
methodology for surge arresters allocation.
95
2.1. Cross Mean Table 96
Firstly, it is highlighted that for every surge arrester allocation suggested by the GA solution, a
97
simulation of ATP electromagnetic transient analysis is performed. With respect to this point, it is
98
worth mentioning that the use of the GA in conjunction with ATP for the optimal solution is a process
99
that consumes too much processing time, which makes it impracticable in terms of the solution time
100
duration, the application of this optimization process to a great diversity of lightning discharges in
101
large electric distribution grids.
102
Because of that, it was created the concept of Cross Mean Table (CMT) which represents an
103
organized summary of ATP simulation results obtained by simulating the incidence of lightning
104
discharge in each electrical node of the grid, one by a time. In this case, when applying the GA
105
optimization procedure, instead of considering lighting discharges in all nodes of the electric network,
106
only the electrical nodes with the most critical over voltages values obtained in the ATP simulation are
107
considered for incidence of lightning discharges and participate in all GA generations.
108
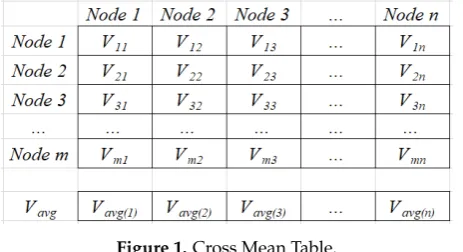
To construct the CMT it is necessary to create a(m+1)×narray, as depicted in Figure1, where m
109
is the total number of nodes in the electric network and n is the number of nodes at which it is desired
110
to evaluate the impacts of lightning discharges, such thatm≤n. For each node n in the column array
111
it is simulated, by using ATP, the incidence of a lightning discharge with same parameters for each
112
node. The highest overvoltage resulting in phases A-B-C of nodes m due to lightning discharges in
113
nodes n are stored in the column array forming the elementsCMT(i,j), fori= 1, 2, . . . ,m.
Figure 1.Cross Mean Table.
A sensitivity analysis is performed in order to evaluate for which node j, the overvoltage caused
115
in the electric network is more critical. The average of overvoltage per column is calculated and stored
116
in the arrayVavg. Once this array is sorted, it is possible to identify the most critical nodes for lightning
117
discharge. So, it is reasonable that any study done to mitigate the impacts caused in the network due
118
to lightning discharges should first consider the most critical nodes, assuming that by minimizing
119
damages caused in this scenario, shall consequently reduce impacts due to lightning discharges in
120
other nodes.
121
2.2. Genetic Algorithm 122
Genetic algorithm is a technique of local search that uses evolution-based procedures to make
123
small changes in a population of chromosomes in searching for an optimal solution [8]. In the following
124
it is presented a discussion on the main elements that compose the genetic algorithm fundamentals
125
applying to the problem of surge arrester optimal allocation.
126
2.2.1. Chromossome
127
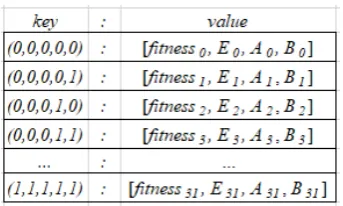
The chromosome represents a solution to be tested as a possible candidate to the optimal solution
128
for the problem. In Figure2it is represented the chromosome definition to be used in the problem of
129
surge arresters optimal allocation as proposed in this paper, where each gene represents a network
130
electric node that is candidate to receive a set of surge arrester.
131
Figure 2.Example of chromossome.
The number of chromosome genes is equal to the number of electrical nodes that a study is desired
132
and do not have any surge arrester installed. Each gene uses real coding with values in the range of [0,
133
1].
134
2.2.2. Individual
135
The population individuals, as presented in Figure3, refer to solutions found from decoding a
136
chromosome. Each gene is decoded considering the value 0.5 as cutoff point, that is, ifgene≤ 0.5
137
then it is assigned a value 0, otherwise it is assigned a value 1. A gene with value 0 indicates that the
138
corresponding electric node has no surge arresters allocated; value 1 indicates that surge arresters are
139
allocated in all phases of the corresponding node, being one, two or three-phase nodes.
140
2.2.3. Population
141
Population is a set of chromosomes that will undergo changes over the genetic algorithm
142
generations. Two population settings have been defined that can be chosen by user. The first
143
configuration is set to carry out a search for a solution that performs optimal allocation with the
144
least amount of surge arresters possible. For this, the minimum population size is defined as being
145
twice the sum of the number of candidate electric nodes plus 1 as in (1).
146
size=2×(n+1) (1)
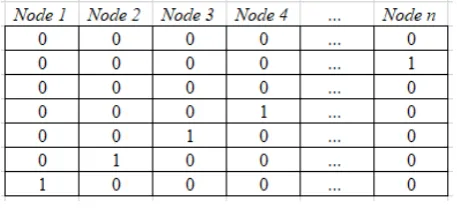
Half of this population is stochastically generated using a uniform distribution to generate the
147
genes, and the other half in a deterministic way, where one of the chromosomes created does not
148
contain surge arresters allocated, that is, all genes are equal to zero. The other chromosomes have only
149
one surge arrester set allocated. In other words, for each candidate electrical node, a chromosome with
150
only one surge arrester set is placed in the corresponding gene, and no surge arresters in the other
151
genes, according to Figure4.
152
Figure 4.Population configuration 1.
If the electrical network has many electrical nodes and equipment, the combined execution time
153
of GA and ATP may take several hours, depending on the number of generations and the number of
154
distinct chromosomes that are created over the generations. As a result, the second configuration aims
155
to reduce the number of chromosomes to be generated in order to reduce execution time. This way it
156
is suggested to focus the search around the electric nodes whose lightning discharges have caused the
157
most critical over voltages, according to the results obtained from theCross Mean Tableanalysis.
158
Like the in the first configuration, in the second one, half of the population is also generated
159
stochastically using a uniform distribution to generate the genes, and another half deterministically.
160
The difference is in the size of the population and how individuals are created. The population size is
161
defined as in (2), wherenis the number of lightning discharges to be analyzed.
162
size=2n+1 (2)
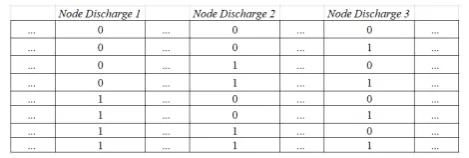
The deterministic half consists of generating the truth table of surge arresters combinations in
163
the electric nodes where there was incidence of lightning discharges. Figure5presents an example of
164
the deterministic construction, where each individual represents one of the 2npossible combinations, 165
considering the number of dischargesn = 3, for illustrative purpose. In these individuals, surge
166
arresters will be allocated in the n electric nodes with value 1, and in the others it is assigned value
167
zero, that is, no surge arrester allocated.
Figure 5.Population configuration 2.
2.2.4. Selection
169
The tournament selection operator is used, where a set of chromosomes is randomly chosen to
170
participate in aring. The two best evaluated chromosomes are chosen as parents to generate a new
171
pair of chromosomes. The size of theringis defined by the user.
172
2.2.5. Crossover
173
The crossover operator used is the arithmetic crossover. With each generation a new empty
174
population is created and filled with new individuals until it reaches the configured size. For
175
that, repeatedly two chromosomes are selected and a random number is generated using a uniform
176
distribution. If it is verified that this number satisfies the stipulated crossover rate, a random number
177
αis generated which will serve to create weights by performing the weighted average of the parent 178
chromosomes genes, generating new genes for each child chromosome, as in (3) and (4). Otherwise,
179
two new chromosomes with the same parent genes are generated.
180
child1[i] =α×parent1[i] + (1−α)×parent2[i] (3)
child2[i] = (1−α)×parent1[i] +α×parent2[i] (4)
2.2.6. Mutation
181
The mutation operator used is the reflexive gaussian mutation. For each chromosome gene a
182
random number is generated using a uniform distribution and checked if it satisfies the configured
183
mutation rate. If false, the gene remains unchanged; otherwise a number is generated from a gaussian
184
distribution with meanµ=0 and standard deviationσin the range of [0, 1] as defined in the settings. 185
The standard deviation represents the maximum change that the gene will suffer. The number
186
generated in the range[−σ,σ]is added to the gene, if the result exceeds the range limits of [0, 1], the 187
surplus is reflected in the opposite direction, so the gene will never overcome this range.
188
2.2.7. Fitness
189
The fitness function aims to evaluate how good the solution represented by a chromosome is. To
190
perform this evaluation it is necessary to execute the ATP input cards using thetemplatecreated and
191
modified based on the individuals, allocating a surge arrester set at the electric nodes where there is a
192
gene with value 1. For each individual,nlightning discharge scenarios are simulated. At the end of
193
each simulation the maximum phase voltage peaks of each electrical node is extracted from the output
194
file.
195
The defined fitness function is composed of the sum of 3 terms. The first termBaims to maximize
196
the number of electrical nodes that are within theVCFOvoltage limit, which varies according to the 197
feeder nominal voltage(Vnominal)and represents the voltage level above which the flashover occurs 198
and, consequently, shutdown. For that, the percentage of electrical nodes whose electrical voltages are
199
less thanVCFOis calculated according to (5). 200
B= Btotal−Bover
Btotal
Where,
201
Btotalis the total number of electrical nodes in the electrical network. 202
Boveris the total number of electrical nodes that has exceeded the electric voltage limit ofVCFO,
203
consideringVCFOequal to the NIL (Basic Isolation Level).
204
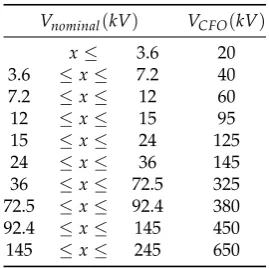
An electrical node violates theVCFOlimit when at least one of its phases presents a voltage level
205
greater thanVCFO, defined as in Table1, adapted from NBR 6939 [9]. When a nominal voltage occurs 206
at the ends of each range, a more conservative profile is adopted using the lowest value ofVCFOamong 207
the possible ones.
208
Table 1.Insulation voltage levels:VCFOlimits
Vnominal(kV) VCFO(kV)
x≤ 3.6 20
3.6 ≤x≤ 7.2 40
7.2 ≤x≤ 12 60
12 ≤x≤ 15 95
15 ≤x≤ 24 125
24 ≤x≤ 36 145
36 ≤x≤ 72.5 325
72.5 ≤x≤ 92.4 380 92.4 ≤x≤ 145 450
145 ≤x≤ 245 650
The second termEconsists of evaluating the percentage of equipment that has been protected
209
according to (6). A protected equipment is one whose electrical node has electric voltage level within
210
theVCFOlimit in all its phases. Capacitor banks (BCs) and transformers are considered as equipment.
211
E= Etotal−Eover
Etotal
×100 (6)
Where,
212
Etotalis the total number of equipment in the electrical network. 213
Eoveris the total number of equipment that is connected at electric nodes that have exceeded the
214
VCFOlimit. 215
The third termAevaluates the number of surge arresters that were required to perform the
216
optimal allocation, as in (7), considering that each electrical node receives a surge arrester in each
217
phase. This term acts as a bonus ifAallocated≤Adesired; otherwise, it acts as a penalty to the individuals
218
that have exceeded the establisheddesirednumber of surge arrester.
219
A= Adesired−Aallocated
Amax−Adesired ×100 (7)
Where,
220
Amaxis the maximum number of surge arresters that can be allocated in the electrical network,
221
that is, a surge arrester in each phase of each electric node.
222
Adesiredis the user-defined desired number of arresters to be allocated. 223
AAllocatedis the amount of allocated surge arresters by the GA procedure. 224
The final fitness function is defined by (8), as the weighted sum of termsB,EandA, whereFepis
225
the equipment protection factor andFais the surge arrester factor, both of which can assume values in
226
the interval [0, 1]. It is possible that the weighted sum in (8) generates a negative value, and in this
227
case the fitness value will be set to zero, through themaxfunction that returns the largest between two
228
numbers.
229
However, the user must define alimitnumber of surge arresters (Alimit) that can be tested on each 230
solution. Individuals who exceedAlimitwill not be simulated by the ATP and their fitness will be 231
zero. In summary, individuals will recieve in ther fitness, a bonus ifAallocated≤Adesiredor a penalty if
232
Adesired<Aallocated ≤Alimit, and in the caseAallocated >Alimitthey will not be simulated in ATP.
233
2.3. Memory Map 234
A simulation run in ATP may take a few minutes depending on the size of the electrical network
235
and the simulation parameters. It is necessary to perform an ATP simulation for each individual that
236
was generated by the GA evolution, but it is possible that the same individual be generated more than
237
one time during the GA execution.
238
Regardless of how many times the same simulation is performed the result obtained is the same.
239
Therefore, these extra ATP calls spend unnecessary processing time, and to avoid them a memory map
240
is used to store the calculated fitness.
241
A memory map is a data structure that indexes a value to a unique key, which is used as the
242
search parameter. In Python a memory map is implemented in dictionary form. For this application
243
the key consists of a tuple of the individual genes and the value is the calculated fitness and the
244
tiebreaker criteria, as in Figure6. The main advantage of using this feature is the reduced processing
245
time, however there is also an increase in memory consumption.
246
Figure 6.Example of memory map.
2.4. Parallelization 247
Running the genetic algorithm sequentially can be very costly due to the time spent with each
248
ATP simulation. Therefore, it is essential to perform parallelization to perform multiple simulations
249
of ATP simultaneously. Parallelization was performed in processing the fitness function and in the
250
methodology of constructing the CMT because both routines use exhaustive ATP executions.
251
3. Results Discussions 252
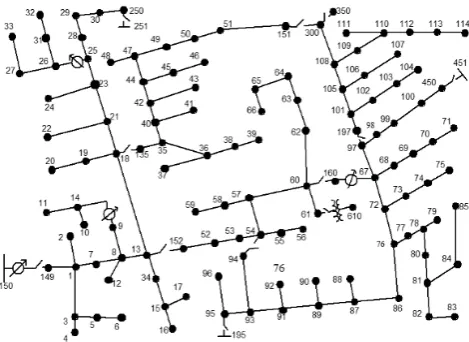
To test the proposed methodology, the IEEE-123 Node Test Feeder [10] is used, whose single-line
253
diagram can be seen in Figure7. To guarantee the electrical network has no islands and is radial, all
254
switches were considered closed except switches 18-135 and 54-94.
Figure 7.IEEE 123 node eletric test feeder sigle-line diagram.
Figure8represents the sorted arrayVavgobtained from the CMT, considering a lightning discharge
256
of 10 kA. The runtime spent to get this curve was 6.12 minutes. As can be observed the three most
257
critical nodes analyzed areB135,B35andB40presenting overvoltage above 2 MV. From the definition
258
of these nodes, the GA execution will be done considering the incidence of lightning discharges only
259
in the three most critical nodes, firstly the most critical (B135), then the two more critical (B135andB35)
260
and finally the three more critical (B135,B35andB40).
261
Figure 8.Graphical representation of CMT results for lightning discharges of 10 kA in each electric node of IEEE-123 node test system.
The GA parameters setting is described in Table2. The minimum population size used was
262
defined by (2).
263
Table 2.Genetic algorithm configuration.
Generations Population Size Ring Size Crossover Rate (%) Mutation Rate (%) σ
30 16 3 80 50 0.5
The GA was executed considering six different configurations of fitness settings, as presented in
264
Table3. Each configuration has a specific focus that can vary between the high priority protection of
265
electrical nodes with already installed equipment, namely transformers and capacitor banks, or an
266
equal priority protection scheme of all electrical nodes, considering or not a restriction on the maximum
number of surge arresters to be allocated. For the current case study, the tests were performed with
268
Adesired=29 andAlimit=58. 269
Table 3.Fitness configuration.
Configuration Fep Fa Description
1 0 0 Equal priority protection of all nodes, without limitation of surge arresters.
2 0 1 Equal priority protection of all nodes, with limitation of surge arresters.
3 1 0 Priority protection for transformers and CBs, without limitation of surge arresters.
4 1 1 Priority protection for transformers and CBs, with limitation of surge arresters.
5 0.5 0 Equal priority protection of all nodes, transformers and CBs, without limitation of surge arresters.
6 0.5 1 Equal priority protection of all nodes, transformers and CBs, with limitation of surge arresters.
As can be seen by inspection of Tables4, 5, and 6, all configurations have presented a good
270
percentage of equipment protection in all cases. For a lightning discharge at the most critical electric
271
nodeB135, the best surge arrester allocation solution was obtained by configuration 6, which resulted in
272
100% protection of equipment and 98.89% protection of electric nodes in general, allocating the smallest
273
number of surge arresters. In the case of lightning discharges at nodesB135andB35, configurations
274
5 and 6 presented similar results for equipment protection reaching 89.23%, and allocating 56 and
275
55 surge arresters respectively. For lightning discharges at nodesB135,B35, andB40the best solution
276
corresponds to configuration 3, which reached 92.31% of equipment protection, allocating 58 surge
277
arresters, that is the allowed limit.
278
As can be seen by inspection of Tables4, 5and 4, all configurations have presented a good
279
percentage of equipment protection in all cases. For a lightning discharge at the most critical electric
280
nodeB135, the best surge arrester allocation solution was obtained by configuration 6, which resulted in
281
100% protection of equipment and 98.89% protection of electric nodes in general, allocating the smallest
282
number of surge arresters. In the case of lightning discharges at nodesB135andB35, configurations
283
5 and 6 presented similar results for equipment protection reaching 89.23% and allocating 56 and
284
55 surge arresters respectively. For lightning discharges at nodesB135,B35, andB40the best solution
285
corresponds to configuration 3, which reached 92.31% of equipment protection, allocating 58 surge
286
arresters, that is the allowed limit.
287
Table 4.Results obtained when simulating a 10 kA lightning discharge at busB35.
Configuration Fitness (%) B (%) E (%) Aallocated AG runtime (min)
1 94.44 94.44 95.38 50 17.15
2 76.05 91.11 90.77 54 13.71
3 98.46 97.78 98.46 55 16.06
4 80.93 94.44 95.38 53 8.01
5 99.44 98.89 100.00 54 16.93
Table 5.Results obtained when simulating a 10 kA lightning discharge at busesB35andB42.
Configuration Fitness (%) B (%) E (%) Aallocated AG runtime (min)
1 86.67 86.67 86.15 56 22.70
2 70.96 80.00 78.46 44 46.93
3 76.92 75.56 76.92 53 26.16
4 77.72 86.67 86.15 43 64.38
5 89.06 88.89 89.23 56 23.21
6 73.40 88.89 89.23 55 34.54
Table 6.Results obtained when simulating a 10 kA lightning discharge at busesB35,B42andB36.
Configuration Fitness (%) B (%) E (%) Aallocated AG runtime (min)
1 81.11 81.11 80.00 57 47.13
2 77.95 90.00 90.77 49 95.88
3 92.31 91.11 92.31 58 83.26
4 72.63 87.78 87.69 54 102.24
5 83.21 83.33 83.08 58 63.29
6 68.12 80.00 81.54 50 83.87
The GA average runtime for Tables4,5and 4were 15.55 min, 36.32 min and 79.28 min respectively.
288
The larger the number of critical nodes to be analyzed the higher the runtime due to the increased
289
ATP executions. A linear approximation, for example, considering that all IEEE-123-grid electric
290
nodes are to be analyzed it would spend approximately 54 hours of continuous computing processing.
291
Typical electric distribution grids may have thousands of electric nodes, so the direct application of
292
GA optimization procedures using ATP may become not viable with respect to processing time, and
293
using a procedure like the one proposed in this article may become it viable.
294
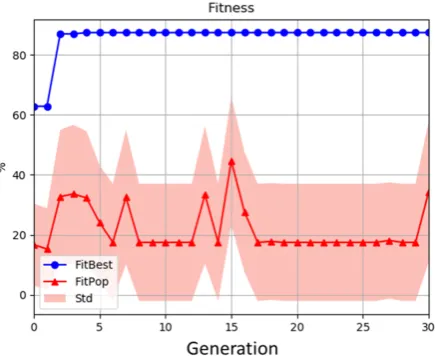
The GA convergence performance for configurations 1-6 has exhibited similar profiles.
295
Configuration 1 was selected to illustrate this performance, whose results can be seen in Figures9, 10 296
and 11respectively. For each GA execution Figure9presents the fitness function convergence profile,
297
being the best individual convergence presented in dotted blue line and the population convergence
298
in dotted red line, with the respective standard deviation confidence interval.
299
Figure 9.Fitness convergence.
The percentage of protected equipment and allocated surge arresters are updated with each
300
generation, trying to keep the amount of protected equipment as bigger as possible, and the number of
301
arresters as smaller as possible, as depicted in Figures10and 11.
In Figure10it is highlighted in dotted blue line the percentage of equipment protection for the
303
best individual presented in Figure9. It is also presented in dotted red line the population curve
304
representing the average of all individuals in the generation, which variation profile is constrained by
305
the standard deviation confidence interval.
306
Figure 10.Protected equipment.
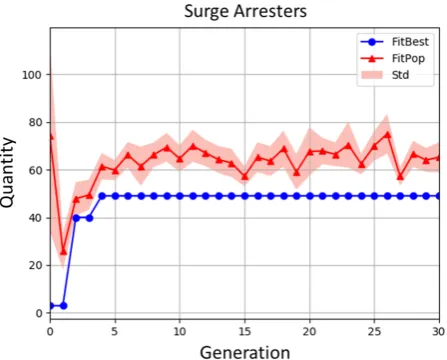
Figure11presents in dotted blue line the amount of allocated surge arresters for the best individual
307
for each GA generation and the corresponding allocation profile for the average population individuals
308
in dotted red line.
309
Figure 11.Allocated surge arresters.
To evaluate the GA optimal solutions performances in terms of the resulting system overvoltages,
310
the Cross Mean Table methodology is again applied, considering 10 kA lightning discharges in all
311
electric nodes, but now considering the optimal allocation of surge arresters as obtained by the GA
312
optimal solutions. In order to exemplify this performance, configuration 6 as presented in Tables4, 5 313
and 4will be used. Figure12shows the CMT results obtained after the optimal allocation of surge
314
arresters, when considered the most critical node (dotted orange curve), the two most critical nodes
315
(gray dotted curve) and, finally, the three most critical nodes (yellow dotted curve) . These results are
316
compared with results obtained for the original system without surge arrester allocation (dotted blue
317
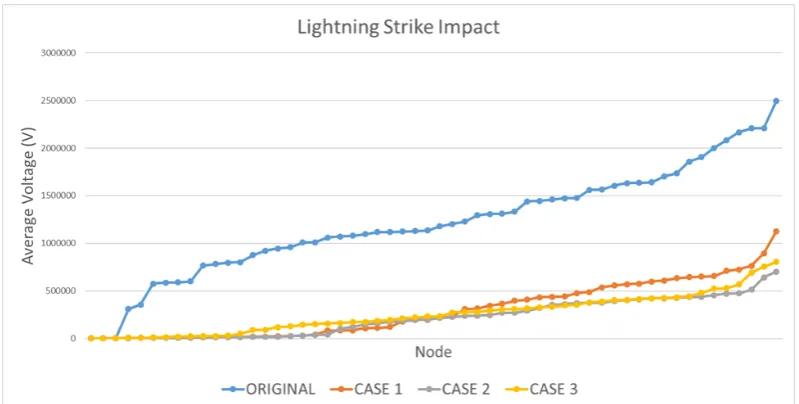
curve), as presented in Figure8.
Figure 12.Graphical representation of CMT results before and after surge arresters allocation.
It is observed in Figure12that in all cases considered, that is, only the most critical node, the two
319
most critical nodes, and the three most critical nodes, the proposed methodology presented a significant
320
reduction of overvoltage with respect to the condition without surge arresters allocation (original
321
electric network). The comparison among the three cases of optimal allocation, either observing
322
Figure8, or the previous results presented in Tables4, 5and 4, demonstrates that they are very
323
similar, with slight variations between the solutions presented. In this way one has a varied set of
324
feasible solutions to be adopted. It is worth to emphasize that by using the proposed methodology,
325
these solutions are obtained with a reduced computational effort, when compared with standard
326
optimization procedures using GA.
327
4. Conclusions 328
It is well known by researchers and engineers of electrical systems that using ATP as a calculation
329
tool in optimization procedures, such as those using genetic algorithms, demands a lot of processing
330
time, which can even make the combined use of AG and ATP unfeasible for the solution of optimization
331
problems in large electric networks. This was one of the main aspects covered in this article, being
332
proposed an optimization procedure to overcome this difficulty which is based on the analysis of the
333
electric network regarding the critical over voltages caused by atmospheric discharges. The proposed
334
solution using the CMT description of the electric network demonstrated to be very effective as a
335
starting condition of the GA optimization procedure.
336
Surge arresters optimal allocation based on the most critical over voltages analysis proved to be
337
quite effective, obtaining very good results regarding the over voltages reduction at all electric nodes,
338
ensuring high percentages of electric nodes below the flashover voltage limit.
339
It is worth mentioning, too, that the proposed fitness function allows important features of
340
electrical systems operation to be met in planning surge arresters allocation in electrical networks,
341
namely, to protect a maximum possible number of electric nodes and equipment, with the least
342
possible financial investments in surge arresters acquisition. The results demonstrated the proposed
343
methodology has a great potential for application in real problems of electric distribution utilities,
344
which typically involve large electric networks, serving as a guide in decision making concerning
345
surge arresters allocation planning.
346
Author Contributions:Conceptualization, G.V.S.R., R.P.S.B, J.R.S.M. and U.H.B; methodology, G.V.S.R., R.P.S.B, 347
J.R.S.M. and U.H.B; software, G.V.S.R., J.R.S.M., I.M.A., D.S.A.C and A.C.S.; validation, G.V.S.R. and U.H.B; formal 348
R.P.S.B, J.R.S.M. and J.S.S.; data curation, G.V.S.R.; writing–original draft preparation, G.V.S.R.; writing–review 350
and editing, U.H.B; visualization, G.V.S.R.; supervision, J.S.S.; project administration, M.V.A.N 351
Funding:This research was funded by in part by the Coordenação de Aperfeiçoamento de Pessoal de Nível 352
Superior - Brasil (CAPES) - Finance Code 001. This research was also funded in part by Centrais Elétricas do Pará 353
(CELPA) and the Companhia Energética do Maranhão (CEMAR). The APC was funded by CELPA and CEMAR. 354
Acknowledgments: The authors acknowledge the support provided by the Post-Graduate Electrical Engineering 355
Program PPGEE/UFPA. 356
Conflicts of Interest:The authors declare no conflict of interest. The funders had no role in the design of the 357
study; in the collection, analyses, or interpretation of data; in the writing of the manuscript, or in the decision to 358
publish the results. 359
Abbreviations 360
The following abbreviations are used in this manuscript: 361
362
ATP Alternative Transients Program BIL Basic Isolation Level
CB Capacitor Bank CMT Cross Mean Table GA Genetic Algorithm VCFO Critical Flashover Voltage 363
References 364
1. Bogarra, S.; L Orille, À.; Àngela, M. SURGE ARRESTER’S LOCATION USING FUZZY LOGIC 365
TECHNIQUES.Barcelona: 17th International Conference on Electricity Distribution2003. 366
2. Orille-Fernandez, A.L.; Rodriguez, S.B.; Gotes, M.A.G. Optimization of surge arrester’s location. IEEE 367
Transactions on Power Delivery2004,19, 145–150. doi:10.1109/TPWRD.2003.820213. 368
3. Perez, E.; Delgadillo, A.; Urrutia, D.; Torres, H. Optimizing the Surge Arresters Location for Improving 369
Lightning Induced Voltage Performance of Distribution Network. 2007 IEEE Power Engineering Society 370
General Meeting, 2007, pp. 1–6. doi:10.1109/PES.2007.385697. 371
4. A. Vasconcelos, J.; E. A. Araújo, A.; C. Alves, L.; B. Martins, M.; C. Tavares, I.; L. Franco, J.; R. Abreu, S. 372
Software for Optimal Location of Surge Arresters in Transmission and Distribution Lines.Brazil: Brazilian 373
Symposium on Electric Systems2012. 374
5. Bullich-Massague, E.; Sumper, A.; Villafafila-Robles, R.; Rull-Duran, J. Optimization of Surge Arrester 375
Locations in Overhead Distribution Networks. IEEE Transactions on Power Delivery2015, 30, 674–683. 376
doi:10.1109/TPWRD.2014.2312077. 377
6. João Muniz, R.S.; Jean Moraes, A.A.; Gabriel Rocha, V.S.; Marcus Nunes, V.A.; Raphael Barradas, P.S.; 378
Bezerra, U.H.; Brito, A.B.; Monteiro, F.P.; Rodrigo Carvalho, L.S. ATP Cards Automatic Generation from an 379
Electrical Network Elements Database Using Python. 2018 13th IEEE International Conference on Industry 380
Applications (INDUSCON), 2018, pp. 564–570. doi:10.1109/INDUSCON.2018.8627278. 381
7. Filho, S.V.Lightning Discharges: An Engineering Approach; Artliber, 2005. 382
8. Coppin, B.Artificial Intelligence; LTC, 2010. 383
9. ABNT. Brazilian Association of Technical Standards NBR 6939:2000 – Insulation Coordination - Proceedings. 384
ABNT - Associação Brasileira de Normas Técnicas, Brazil, 1st ed., 2000. Updated by: ABNT NBR 6939:2018. 385