© 2014, IJCSMC All Rights Reserved
166
Available Online atwww.ijcsmc.comInternational Journal of Computer Science and Mobile Computing
A Monthly Journal of Computer Science and Information Technology
ISSN 2320–088X
IJCSMC, Vol. 3, Issue. 5, May 2014, pg.166 – 175
RESEARCH ARTICLE
A Research Work on Identification of Cardiac
Disorders using LabVIEW
Mohan Kumar
1, Umesh K
2, Pandiaraja G
3, Sonu Thomas
4, Venkatesh M
51Department of Biomedical Engineering, PSNA college of Engineering and Technology, Dindigul
2
Department of Biomedical Engineering, PSG college of Technology, Coimbatore
3,4,5Department of Biomedical Engineering, PSNA college of Engineering and Technology, Dindigul
Correspondence email: 1 mohanpalanichamy23@gmail.com
Abstract—Acquiring and analysis of ECG signals can be done traditionally using different software. To be in advance this
work focuses not only on acquiring and analysis of ECG signal but also on identification of cardiac disorders. This would bridge the gap between medical physicians and engineers. Our project is carried out with the help of Lab VIEW software (version 8.2). This model work simulates the waveform using ECG simulator, analyzed and particular disease is identified. We have designed this project mainly to identify the diseases atrial flutter, AV block, and atrial & ventricular fibrillations. Initially, The ECG signals are simulated using ECG simulator. The signal is then fed to PC through NI ELVIS DAQ (PCI-6251). Here the waveform in analog form is converted to digital form and is analyzed for detecting the peak intervals of the ECG signal acquired, based on which the identification of cardiac disorders is done by sending them to the loops containing the conditions for cardiac disorders. Based on the results obtained from the analysis of the ECG signal and comparison with the loop conditions, the cardiac disorders are identified and displayed instantly.
Keywords: Electrocardiogram; Laboratory Virtual Instrumentation Engineers Workbench; Data Acquisition; ELVIS
I. INTRODUCTION
Biomedical signals are fundamental observations for analyzing the body function and for diagnosing a wide spectrum of diseases. The analysis of ECG has been widely used for diagnosing many cardiac diseases. The ECG is a graphic record of the duration and magnitude of the electrical activity that is generated by depolarization and repolarization of the atria and ventricles. One cardiac cycle in an ECG consists of the P-QRS-T waves. Most of the clinically useful information in the ECG is found in the intervals and amplitudes defined by this features. The development of accurate and quick methods for automatic ECG feature extraction is of major importance. The ECG feature extraction provides fundamental features (amplitudes and intervals) to be used in subsequent automatic analysis.
© 2014, IJCSMC All Rights Reserved
167
rate. In this procedure, after analyzing the ECG waveform picked from ECG simulator, it is to be further consulted by a doctor to diagnose the particular disease. Hence we are intended to develop a virtual machine that acquires the ECG signals from the ECG simulator, analyze them and help in identification of cardiac diseases. Virtual ECG Instrumentation system is a new Instrumentation system, which is much better and flexible with the aid of computer intelligent resource
II. CARDIAC SYSTEM
A. Working of Heart
Heart, the vital part of the body continuously pumps oxygen and nutrient-rich blood throughout our body to sustain life. This fist-sized power house beats (expands and contracts) 100,800 times per day, pumping five or six quarts of blood each minute, or about 1900 gallons per day. As the heart beats it pumps blood through a system of blood vessels, called the circulatory system. The vessels are elastic, muscular tubes that carry blood to every part of the body. In addition to carrying the fresh oxygen from the lungs and nutrients to body tissues it also takes the body’s waste products including carbon-di-oxide, away from the tissues.
The heart is located under the rib cage, under and to the left of our breastbone (sternum), and between our lungs. Looking at the outside of the heart, we can see that the heart is made of cardiac muscle. The strong muscular walls contract (squeeze), pumping blood to the arteries. The major blood vessels that are connected to the heart include the aorta, the superior vena cava, the inferior vena cava, the pulmonary artery (which takes oxygen-poor blood from the heart to the lungs, where it is oxygenated), the pulmonary veins (which bring oxygen-rich blood from the lungs to the heart) and the coronary arteries (which supply blood to the heart muscle).
Heart is a four chambered, hollow organ. It is divided into the left and right side by a muscular wall called the septum. The right and left sides of the heart are further divided into two top chambers called the atria, which receive blood from the veins, and two bottom chambers called ventricles, which pump blood into the arteries.
B Electrical Activity of Heart
Electrocardiography is a transthoracic interpretation of the electrical activity of the heart over a period of time as detected by electrodes attached to the surface of the skin and recorded by a device external to the body. The recording produced by this noninvasive procedure is termed as Electrocardiogram. It picks up electrical impulses generated by the polarization and depolarization of cardiac tissue and translates into a waveform. The waveform is then used to measure the rate and regularity of the heart beats. A typical ECG tracing of the cardiac cycle (heart beat) consist of a P wave, a QRS complex, T wave and a U wave which is normally visible in 50-75% of ECGs. The baseline of the electrocardiogram (the flat horizontal segments) is measured as the portion of the tracing following the T wave and preceding the next P wave and the segment between the P wave and the following QRS complex (PR segment).
The resting or filling phase of the heart cycle is referred to as diastole. The contractile or pumping phase is called systole. The smooth, rhythmic contraction of the atria and ventricles has an underlying electrical precursor in the form of a well-coordinated series of electrical events that takes place within the heart. This set of electrical events is intrinsic to the heart itself is well demonstrated in the heart. Moreover, the electrical activation patterns in the walls of the atria and ventricles are initiated by a coordinated series of events in the “Specialized Conduction System” of the heart.
In a normal healthy heart, the baseline is equivalent to the isoelectric line (0 mV) and represents the periods in the cardiac cycle when there are no currents flowing towards either the positive or negative ends of the ECG leads. However, in the diseased heart the baseline may be elevated (example: Cardiac Ischemia) or depressed (example: myocardial infarction) relative to the isoelectric line due to injury currents flowing during the TP and PR intervals, when the ventricles are at rest. The ST segment typically remains close to the isoelectric line as this is the period when the ventricles are fully depolarized and thus no currents can flow in the ECG leads. Since most ECG recordings do not indicate where the 0mV line is, baseline depression often gives the appearance of an elevation of the ST segment and conversely baseline elevation gives the appearance of depression of the ST segment.
C. Generation of Cardiac Impulse
© 2014, IJCSMC All Rights Reserved
168
ventricular septum to the apex of the right ventricle before it gives off significant branches. The left common bundle crosses to the left side of the septum and splits into the anterior division (which is thin and long and goes under the aortic valve in the outflow tract to the anterolateral papillary muscle) and the posterior division (which is wide and short and goes to the posterior papillary muscle lying in the inflow tract).
The significant features of the ECG waveform are the P, Q, R, S and T waves, the duration of each wave, and certain time intervals such as the P-R, S-T, and Q-T intervals. P wave is produced by atrial depolarization, the QRS complex primarily by Ventricular depolarization and the T wave by ventricular repolarization. The manifestations of atrial repolarization are normally masked by the QRS complex. The P-R and S-T intervals are normally at zero potential, the P-R interval being caused mainly by conduction delay in the AV node. The S-T segment is related to the average duration of the plateau regions of individual ventricular cells.
Figure 1 Schematic representation of normal ECG (Courtesy: GoutamKumaret.al [4])
TABLE 1: ELECTRICAL ACTIVITY OF HEART
(Courtesy: Handbook of biomedical instrumentation, R.S.Khandpur)
FEATURE DESCRIPTION TIME
P wave During normal atrial depolarization, the main electrical vector is directed from
the SA node towards the AV node, and spreads from the right Atrium to the left atrium. This turns into the P wave on the ECG
80 ms
PR interval The PR interval is measured from the beginning of the P wave to the beginning
of the QRS complex. It reflects the time the electrical impulse takes to travel from the sinus node through the AV node and entering the ventricles. PR interval is, therefore, a good estimate of AV node function.
120 – 200ms
QRS complex QRS complex reflects the rapid depolarization of the right and left ventricles. They have a large muscle mass compared to the atria, so the QRS complex usually has much larger amplitude than the P wave.
80-120 ms
RR interval The interval between an R wave and the next R wave: normal resting heart rate
is between 60&100bpm.
0.6 – 1.2 s
ST interval The ST interval is measured from the J point (the point at which the QRS complex finishes and the ST segment begins, it is used to measure the degree of ST elevation or depression present) to the end of the T wave
320ms
T wave The T wave represents the repolarization (or recovery) of the ventricles. The
interval from the beginning of the QRS complex to the apex of the T wave is referred to as the absolute refractory period. The last half of the T wave is referred to as the relative refractory period (or vulnerable period)
© 2014, IJCSMC All Rights Reserved
169
III. MATERIALS AND METHODS
A. LabVIEW
LabVIEW is a highly productive environment for creating custom applications that interact with real-world data or signals in fields such as science and engineering. Within this flexible platform, engineers scale from design to test and from small to large systems while reusing instruction pointer and refining this processes to achieve maximum performance. It is created by National Instruments that uses icons instead of lines of text to create applications. LabVIEW programs/codes are called Virtual Instruments or VIs. It is used for Data Acquisition, Signal Processing (Analysis) and hardware control – a typical instrument configuration based on LabVIEW.
Each VI has three components: a block diagram, a front panel and a connector panel. The last is used to represent the VI in the block diagrams of other, calling VIs. The front panel is build using controls and indicators. Controls are inputs- they allow a user to supply information to the VI. Indicators are outputs- they indicate, or display, the results based on the inputs given to the VI.
The back panel, which is a block diagram, contains the graphical source code. All of the objects placed on the front panel will appear on the back panel as terminals. The back panel also contains structures and functions which perform operations on controls and supply data to indicators. The structures and functions are found on the Functions palette and can be placed on the back panel. Collectively controls, indicators, structures and functions will be referred to as nodes. Nodes are connected to one another using wires. Thus a virtual instrument can either be run as a program, with the front panel serving as a user interface, or, when dropped as a node on to the block diagram, the front panel defines the inputs and outputs for the gi ven node through the connector panel.
B Clinical Applications
Virtual Instrumentation allows medical researchers and practitioners to combine the traditional diagnostic tools with advanced technologies such as databases, Active X, and the internet. In both laboratory and clinical environment users can interact with the wealth of desperate systems, facilitating better, faster, and more informed decision making. Both students and practicing professionals will appreciate the practical applications afford for modeling fundamental physiology, advanced system analysis, medical device development and testing, and even hospital management and clinical engineering scenarios.The Biomedical Workbench in LabVIEW Biomedical Toolkit provides applications for bio-signal and biomedical image analysis. These applications enable you to apply biomedical solutions using National Instruments software, such as LabVIEW, with National Instruments hardware, such as NI Educational Laboratory Virtual Instrumentation Suite II (NI ELVIS II)[1],[2].
We can acquire real world and real-time biomedical data by using biomedical sensors and National Instruments hardware. We also can import biomedical data from files, such as files from the Physiobank MIT-BIH database, to the applications in this kit for analysis. We can use the applications in Biomedical Workbench to extract features from electrocardiogram (ECG) signals, to analyze heart rate variability (HRV), and to measure blood pressure. We also can use National Instruments hardware and the applications in this kit to generate standard analog, biomedical signals to validate and test your biomedical instruments.
C. Cardiac Abnormalities
TABLE 2: LIST OF CARDIAC DISORDERS
(Courtesy: Handbook of biomedical instrumentation, R.S.Khandpur)
ABNORMALITY ECG SIGN PATHOLOGY
Tachycardia Regular P waves, and each P wave is
followed by a QRS, >100 bpm
Could just be someone has done exercise! Could be some sort of respiratory problem
Bradycardia Regular P waves, and each P wave is
followed by a QRS, <60 bpm
This is normal in young fit People
AV BLOCK 1st degree heart Block
PR interval >0.2 s This is an AV node block can be caused by
CAD, acute rheumatic carditis, digoxin toxicity, or electrolyte disturbance 2nd degree heart
Block
Progressive lengthening of a PR interval followed by absent QRS,and then cycle repeats. Cycles are variable in length. RR interval shortens with lengthening of PR intervals.
© 2014, IJCSMC All Rights Reserved
170
headedness/syncope. 3rd degree heart
Block
90 P waves per minute, only about 38 QRS per minute, and not relationship between the P waves and the QRS complexes.QRS will often have an abnormal shape, and be broad (>120ms). However, the PP intervals will be regular, as will the RR intervals – they are just not in time with each other.
This is an AV node block. Atrial activity will be completely normal, but this conductivity does not pass into the ventricles. This always indicates underlying disease- the disease is often fibrosis rather than ischemia, but it can occur in MI
Atrial Fibrillation Absent P waves- just an irregularbaseline.
Irregular QRS (but QRS is normal shape)
As well as no P waves the rhythm will be irregular. There will be a fibrillating baseline due to uncoordinated activity. The causes of atrial fibrillation are: Ischemic heart disease, thyrotoxicosis(hyper thyroidism), sepsis, valvular heart disease, alcohol excess
Ventricular Fibrillation No discernable pattern, no QRS, no P, no T
wave
Patient is very likely tolose consciousness- thus the diagnosis is easy
Atrial flutter Isoelectric interval between P and T waves
disappears
Increase in heart rate (190-330 bpm)
D. Arrhythmias
An arrhythmia is a condition in which heart is not beating in a normal rhythm. An arrhythmia is a symptom of a wide variety of diseases, disorders and conditions that cause the heart to beat in a way that is irregular, too rapid(Tachycardia), too slow(Bradycardia), and / or not at all (asystole). There are many types of arrhythmias, which can be mild to severe to life-threatening. Arrhythmia is also known as cardiac arrhythmia.
An arrhythmia can occur in any age group or population, but people most at risk include those who have a history of heart valve disorders, cardio vascular disease, congestive heart failure and hypothyroidism. Other conditions that can result in an arrhythmia include electrolyte imbalance, smoking, excessive exercise, alcoholism and drinking too much caffeine. Arrhythmias can also be a side effect of stimulant drugs, and some street drugs, such as cocaine and methamphetamine.
Arrhythmia can be acute and appear relatively suddenly, such as rapid arrhythmia that occurs with paroxysmal ventricular tachycardia. Arrhythmia can also ongoing and chronic, such as when an elderly person develops chronic atrial fibrillation. Other potentially serious types of arrhythmias include paroxysmal atrial tachycardia, atrial flutter and second degree heart block. Quickly life-threatening arrhythmias include ventricular tachycardia and ventricular fibrillation, which can lead to cardiac arrest. In cardiac arrest the heart has stopped beating or is beating too inefficiently to sustain life.
E. Causes of Arrhythmias
Arrhythmias can have many causes, including coronary artery disease, heart valve defects, heart damage, medications, drug abuse, diabetes, heart infections and high blood pressure.
TABLE 3: LIST OF CAUSES OR UNDERLYING CONDITIONS THAT COULD POSSIBLY CAUSE ARRHYTHMIAS
(Courtesy: Amit Kumar et al.)
Heart block Acute Renal Failure – tachycardia Heart cancer Sepsis
Cardiomyopathy Yellow fever – slow pulse Heart valve diseases Anesthesia complications
Stress Hypothermia Jaundice Congenital heart defects
Tobacco Rheumatic heart disease Malignant hyperthermia Acute Radiation sickness
Alcohol Respiratory Failure Bacterial meningitis Pulmonary heart disease
Caffeine Typhoid fever Rheumatic fever Ischemic Heart disease
Cough and cold medicine Cocaine Ventricular septal defect Sepsis
IV. PROPOSED SYSTEM
© 2014, IJCSMC All Rights Reserved
171
average, a control for selecting the measurement type, a digital indicator to display the output value, and a stop button. An elaborate front panel can be created without much effort to serve as the user interface for an application.
Figure 2 Example for front panel
A. Block Diagram Panel
The block diagram or source code window holds the graphical source code of LabVIEW VIs.LabVIEW’s block diagram corresponds to the lines of text found in a more conventional language like C or BASIC- it is the actual executable code. We can construct the block diagram by writing together objects that perform specific functions. When we place a control or indicator on the front panel, LabVIEW automatically creates a corresponding terminal on the block diagram. By default, we cannot delete a block diagram terminal that belongs to a control or indicator. Although we may try to create a heart’s content. The terminal disappears only when we delete its corresponding control or indicator on the front panel.
The outer rectangle structure represents a while loop, and the inner one is a case structure. The icon in the center is a VI, or subroutine, that takes the number measurements per average as input and returns the frequency value as the output. The orange color wire, represents the data being passed from control in the VI. The selection for the measurement type is connected, or wired to the case statement to determine which case is executed. When the stop button is pressed, the while loop stops execution.
© 2014, IJCSMC All Rights Reserved
172
LabVIEW is not an interpreted language; it is compiled behind the scenes by LabVIEW’s execution engine. Similar to JAVA, the VI’s are compiled into an executable code that LabVIEW’s execution engine processes during runtime. The wire diagrams that are connected do not define an order in which elements are executed. This is an important concept for the programmers to understand. LabVIEW is a data-flow based language, which means that elements will be executed in a somewhat arbitrary order. LabVIEW[2] does not guarantee which order a series of elements is executed in if they are not dependent on each other. A process called arbitrary interleaving is used to determine the order elements are executed in. We may force an order of execution by requiring that elements require output from another element before execution. This is a fairly common practice, and most programmers do not recognize that they are forcing the order of execution. When programming, it will become obvious that some operations must take place before others can. It is the programmer’s responsibility to provide a mechanism to force the order of execution in the code design.
B. ECG Simulator
Different simulators are available to simulate ECG signal for both normal and abnormal conditions. We are using simulator to simulate conditions like AV block, Atrial and Ventricular fibrillation, and Atrial flutter[5]. The signals obtained from the simulator is then fed to the personal computer by use of NIELVISDAQ.
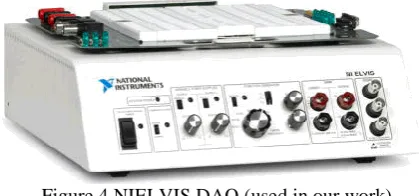
C.Data Acquisition system
Data acquisition or DAQ is simply the process of measuring a real-world signal, such as a voltage, and bringing that information into the computer for processing, analysis, storage or other data manipulation. Physical phenomena represent the real-world signals we are trying to measure, such as speed, temperature, humidity, pressure, flow, start-stop, pH, radioactivity, light intensity and so on.
Figure 4 NIELVIS DAQ (used in our work)
LabVIEW can command DAQ devices to read analog input signals (A/D conversion), generate analog output signals (D/A conversion),read and write digital signals, and manipulate the on-board counters for frequency measurement, pulse generation, quadrature encoder measurements, and so on, to interface with the transducers. In the case of analog input, the voltage data from the sensor goes into the plug-in DAQ devices in the compute, which sends the data into computer memory for storage, processing, or other manipulations.
To acquire data in our lab using the virtual instrumentation approach, we will need a DAQ device, a computer configured with LabVIEW and DAQ driver software, and some method of connecting our transducer signal to the DAQ device such as a connector block, breadboard, cable, or wire. We may also need signal conditioning equipment, depending on the specifications of our application.
D. EXECUTING VIs
A LabVIEW program is executed by pressing the arrow or the Run button located in the palette along the top of the window. While the VI is executing, the Run button changes to a black color. All of the items in the palette are displayed during execution of a VI. As we proceed to the right along the palette, we will find the continuous Run, Stop, and Pause buttons. VI s are normally run from the front panel; however, they can also be executed from the block diagram. This allows the programmer to run the program and utilize some of the other tools that are available for debugging purposes.
© 2014, IJCSMC All Rights Reserved
173
E. Peak Detector& waveform chartsIn order to measure the peaks/valleys LabVIEW uses the Peak Detector from the signal operation found in the Function palette.[5]
Figure 5 Peak detector
(Courtesy www.ni.com)
A plot is simply a graphical display of X versus Y values. Often, Y values in a plot represent the data value, while X values represent time.The waveform chart has three update modes – strip chart mode, scope chart mode and sweep chart mode.The waveform chart, located in the Graph sub palette of the Controls palette, is a special numeric indicator that can display one or more plots of data
TABLE 4 PORTS OF PEAK DETECTOR
Courtesy:www.ni.com
Parameter Description
# found # found is the number of peaks/valleys found in the current block of data. # found is the size of the arrays Locations, Amplitudes, and 2nd Derivatives.
X X is the array of input values that represents the signal to be analyzed. The data can be a single array or
consecutive blocks of data. Consecutive blocks of data are useful for large data arrays or for realtime processing. Notice that in real time processing, peaks/valleys are not detected until approximately width/2 data points past the peak or valley.
Threshold Threshold instructs the VI to ignore peaks and valleys that are too small. The VI ignores peaks if the
fitted amplitude is less than threshold. The VI ignores valleys if the fitted trough is greater than threshold.
Locations Locations contain the index locations of all peaks or valleys detected in the current block of data. Because the peak detection algorithm uses a quadratic fit to find the peaks, it actually interpolates between the data points. Therefore, the indexes are not integers. In other words, the peaks found are not necessarily actual points in the input data but may be at fractions of an index and at amplitudes not found in the input array.
F. Script Node
Script nodes are used to execute text – based math scripts in LabVIEW. LabVIEW provides support for certain script nodes that invoke script servers provide by other parties to process scripts, such as the MATLAB Script server. Use input and output variables on math script nodes and other script nodes to pass values between LabVIEW and a math script node, or other script node. The structure of an expression in a script determines whether a variable is an input or an output. We can use the MathScript node to create scripts using the LabVIEWMathScript syntax or other text-based syntaxes, edit your scripts that we create or load, and process our MathScripts and other text-based scripts by invoking the MathScript RT module engine. MathScript nodes can process many of our text-based scripts created in a MATLAB or compatible environment. However, because the MathScript RT module engine does not support all functions supported by the MATLAB software, some functions in our existing scripts might not be supported. We can implement such functions with a Formula node or another script node.
G Boolean
LabVIEW provides a myriad of switches, LEDs, and buttons for our Boolean controls and indicators. The Boolean palette holds various functions of performing logical operations. All of the functions require Boolean inputs, except for the conversion functions. Boolean data can have one of two states: true or false. A Boolean constant is also provided on this palette. The comparison functions simply compare data values and return a Boolean as a result. We can compare numeric, Boolean, string, array, cluster and character values using these functions
AMPLITUDE LOCATIONS X
© 2014, IJCSMC All Rights Reserved
174
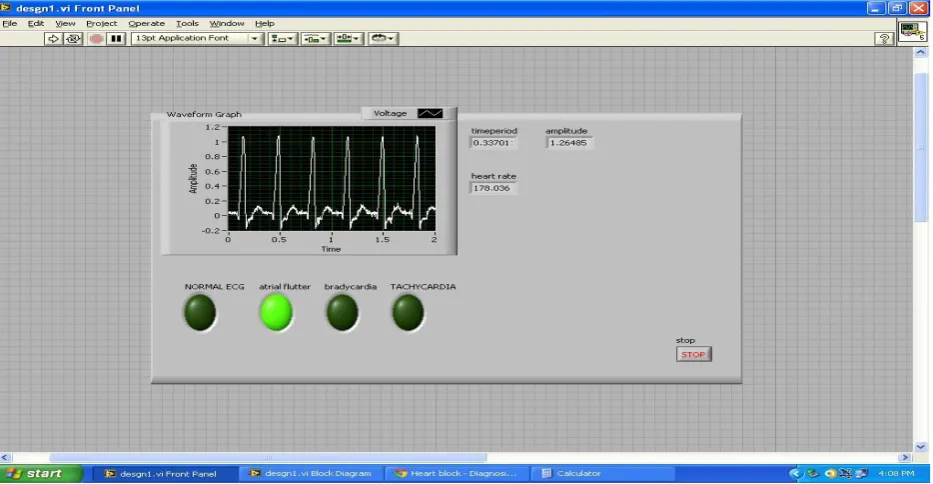
V. RESULTS AND DISCUSSION
The VI was designed to detect the four cardiac disorders Bradycardia, Tachycardia, Atrial flutter & AV block condition. These conditions are simulated using simulator and used as input for the DAQ system. The snapshots are shown below
Figure 6 : VI used to detect atrial flutter, Bradycardia and Tachychardia
© 2014, IJCSMC All Rights Reserved
175
Figure8 Output for AV block condition
VI. CONCLUSION AND FUTURE WORK
The above developed virtual machine sounds good for the signals obtained from simulator. But it may require some additional requirements when we pick up signals directly from the patients. This is because the raw ECG signal contains more noise than the simulated signal. This system can be enhanced similarly for other cardiac disorders, by measuring the various intervals like QRS interval, S-T and P-R intervals. Other parameters such as Temperature, Blood Pressure, and pH of bio fluids can also be determined. Apart from ECG, various other Bio-Signals such as EEG, EMG, EOG, etc., can be extracted by using the proposed method. It can be used for more than one patient simultaneously. Using the read to measurement file present in the function palette, the readings that are obtained as real – time signal from the patient can even be stored as a database for future retrieval.
REFERENCES
1. Ahammad, T. Haque, A.N.M.MIslam, M.K.Khondokar, M.R.H “Study and Analysis of ECG Signal using MATLAB & LABVIEW as Effective Tools” International Journal of Computer and Electrical Engineering, No. 3,Volume 4.
2. Amit Kumar, Lillie Dewan, Mukhtiar Singh “Real Time Monitoring System for ECG Signal using Virtual Instrumentation”
WSEAS transactions on biology and biomedicine, Issue 11,Volume 3, November 2006, pp 638-643.
3. Channappa Bhyri, Kalpana.V, Hamde, S.T. and Waghmare L.M. “Estimation of ECG features using LabVIEW”
International Journal of Computing Science and Communication Technologies, Volume.2, NO.1.320-324
4. Goutam Kumar Sahoo, Samit Ari, Sarat Kumar Patra “ECG signal analysis for detection of Heart Rate and Ischemic Episodes” International Journal of Advanced Computer Research, July 2009.
5. Gowthaam, P.R. Indumathi, S. John Kennedy, S. Raaj Kamal, N.R. Vijayakumar, M. “Identification of Cardiac Diseases
and Remote Monitoring Using LabVIEW” International Conference on Computing and Control Engineering, April 2012.
6. Pooja Bhardwaj, Rahul R Choudhary, Ravindra Dayama,“Web based design for collection and filtering of ECG signal”
![Figure 1 Schematic representation of normal ECG (Courtesy: GoutamKumaret.al [4])](https://thumb-us.123doks.com/thumbv2/123dok_us/1984420.1262319/3.595.37.552.466.712/figure-schematic-representation-normal-ecg-courtesy-goutamkumaret-al.webp)