© 2014, IJCSMC All Rights Reserved
941
Available Online at www.ijcsmc.comInternational Journal of Computer Science and Mobile Computing
A Monthly Journal of Computer Science and Information Technology
ISSN 2320–088X
IJCSMC, Vol. 3, Issue. 3, March 2014, pg.941 – 946
RESEARCH ARTICLE
Software Quality Assessment in Object
Based Architecture
N.Jayalakshmi
Assistant Professor, Department of computer applications,PSNA College of Engg. & Tech.,Dindigul [email protected]
Nimmati Satheesh
Assistant Professor,Department of computer applications,PSNA College of Engg. & Tech.,Dindigul [email protected]
Summary
Software metrics are required to measure quality in terms of software performance and reliability related characteristics like dependencies, coupling and cohesion etc. It provides a way to measure the progress of code during development and having direct relationship with cost and time incurred in the software design and development at their later stages. These major issues must be checked and informed early in the development stage, so that reliability of any software product could be ensured for any large and complex software project. Object oriented software metrics directly focuses on the issues like complexity, reliability and robustness of the software developed using object oriented design methodologies. It reflects the time, cost and effort that Functionality, Scalability, Usability, Performance, Reliability, maintainability. Durability, Serviceability, Availability, Installability, Structured ness and Efficiency. There are two types of parameters namely functional parameters and nonfunctional parameters. Functional parameters deal with the functionality or functional aspects of the application while non functional parameters deal with the non-functional parameters (but desirable) like usability, maintainability that a developer usually doesn’t think of at the time of development oriented software like Extensibility, Reusability, efforts, manageability and cost [1, 2, 3]. To know more about the internal structure of the product one should know more about the interdependencies of parameters of metrics and Software quality parameters. Figure 1 shows the interdependencies of the metrics parameters and software quality parameters by measuring Object Oriented Metrics.
Metrics Parameters
Object oriented metrics provides all parameters through which one can estimate the complexities and quality related issues of any software at their early stages of development. The three object oriented metrics namely MOOD Metrics, CK Metrics, and QMOOD Metrics and given a case study to show, how these metrics are useful in determining the quality of any software designed by using object oriented paradigm.
Key words:
© 2014, IJCSMC All Rights Reserved
942
1. Introduction
Fig. 1 Relationship between metrics and quality parameter
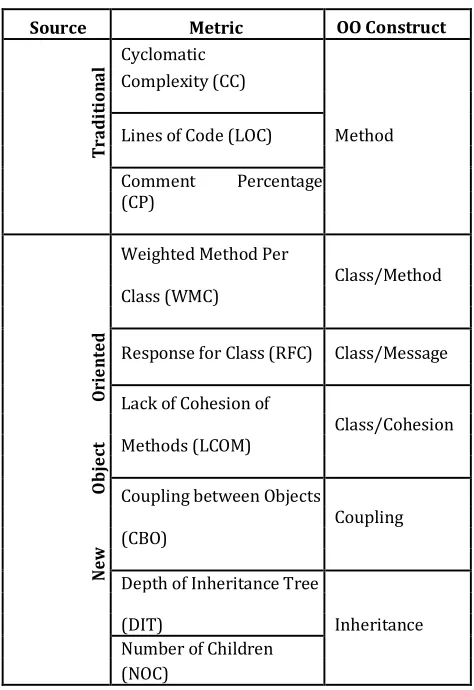
Software Metrics can be defined by measuring property or characteristic or quality of a software objects related to any large and complex software project. In a broader term, it is a degree up to which a system object can hold a particular attribute or characteristics. Object oriented approach is capable of classifying the problem in terms of objects and provide many paybacks like reliability, reusability, decomposition of problem into easily understood object and Quality of design can be regarded as the determination of is requirements and specifications and quality of conformance to the requirements. L.H. Rosenberg proposed various attributes related to object oriented metrics. They have proposed nine metrics for object oriented suite, which are depicted in table I. These metrics include three traditional metrics and six object-oriented metrics [4]. A metric should have a one to one relationship with structures that is being measured or analyzed by that metric.
Metrics proposed by Rosenberg, uses traditional metrics and it is structure based, prescribed for object oriented systems. Here one can see that first three metrics are the examples of traditional metrics and applied onto the method level. Remaining six metrics are defined specifically for object oriented systems.
Table I: Metrics proposed by Rosenberg [4] for Object Oriented Systems
Source Metric OO Construct
T
ra
di
ti
on
al
Cyclomatic
Complexity (CC)
Method Lines of Code (LOC)
Comment Percentage
(CP)
Weighted Method Per
Class/Method Class (WMC)
O
ri
ent
ed
Response for Class (RFC) Class/Message
Lack of Cohesion of
Class/Cohesion Methods (LCOM)
O
bje
ct
Coupling between Objects
Coupling (CBO)
N
ew
Depth of Inheritance Tree
Inheritance (DIT)
Number of Children (NOC)
2. Background
© 2014, IJCSMC All Rights Reserved
943
)
(
C
iDC
)
(
in
C
M
)
(
io
C
M
i
C
i
C
i
C
metrics can be summarized as,
Method Hiding Factor (MHF): It is used tomeasure the information hiding attribute and can be represented as a ratio of the sum of the invisibilities of all methods defined in all classes to the total number of methods defined in the system.
Attribute Hiding Factor (AHF): AHF can bedefined as a ratio of the sum of the invisibilities of all the attributes defined in all classes to the total number of attributes defined in the system. It is also helpful to determine the information hiding complexity in any object oriented system.
Method Inheritance Factor (MIF): It is a ratioof the sum of the inherited methods in all classes to the total system to the actual number of couplings not imputable to inheritance number of available methods. MIF has a strong capability to measure the complexity related to message passing dependencies among various methods of different classes.
Attribute Inheritance Factor (AIF): AIF can berepresented as the ratio of the sum of inherited attributes in all classes of the system to the total number of available attributes for all classes. This explores the possibilities of attribute accessibility of different attributed from different classes.
Polymorphism Factor (PF): PF is a ratio of theactual number of possible different polymorphic situation for a class to the maximum number of possible distinct polymorphic situations for the same class. This factor is helpful to measure the level of polymorphism exhibit by a particular class.
Polymorphism Factor
is number of immediate children of class
is the number of methods declared inside class excluding overriding and private ones.
is the number of overriding methods in class
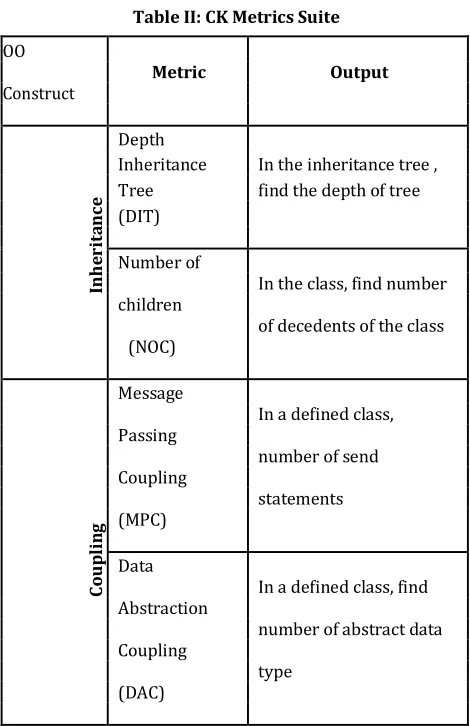
Table II: CK Metrics Suite
OO
Metric Output
Construct
Depth
Inh
er
it
anc
e
Inheritance In the inheritance tree ,
Tree find the depth of tree
(DIT)
Number of
In the class, find number children
of decedents of the class (NOC)
Message
In a defined class, Passing
number of send
Co
u
pl
in
g
Coupling
statements (MPC)
Data
In a defined class, find Abstraction
number of abstract data Coupling
© 2014, IJCSMC All Rights Reserved
944
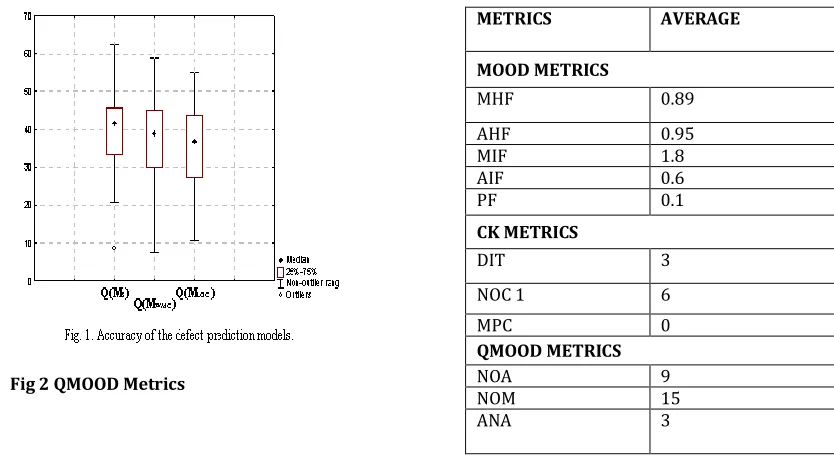
Hudly and Hoskins [7] proposed two kinds of metrics: first is based on classes and second one is to measure the class design configuration of the program. These metrics are helpful to evaluate the main features of object oriented like Polymorphism, Encapsulations, Data abstraction, Inheritance and classes. Metrics proposed by Briand et al., Lorenz and Kidd and Bansiya are some of the important metric suites. They applied object oriented metrics to the concepts of classes, coupling, and inheritance. They also have given different approaches to define the object oriented metrics and their structures [8, 9, 10]. Bansiya and Davis defined Quality Model for Object Oriented Design (QMOOD) metrics. Based on this total quality index (TQI) can be computed for a given system. The QMOOD class metrics are analyzed in Fig 2 [10].
QMOOD (Quality Model for Object Oriented Design) was proposed by Bansiya and Davis [5]. It is the comprehensive models that assess quality attributes like reusability, functionality, effectiveness, nderstandability, extendibility, flexibility. There are four levels (L1 through L4) and three mappings to connect these levels in QMOOD.
The four levels are:
A. Design Quality Attributes. B. Object oriented design Properties. C. Object oriented design Metrics. D. Object oriented design Components
A. Design Quality Attributes: QMOOD design quality attributes are functionality, effectiveness, understandability, Extendibility, reusability and flexibility.
B. Object oriented design Properties: Design properties included in this set of metrics are inheritance, encapsulation, polymorphism, abstraction, coupling, cohesion, messaging, hierarchies, composition, design size, and complexity.
C. Object oriented design Metrics: Metrics in QMOOD are DSC, NOH, ANA, NOP, CIS, NOM, DCC, CAM, MOA, MFA, DAM.
D. Object oriented design Components: Design components include attributes, methods, objects (classes), relationships and class hierarchies.
The complete set of metrics in QMOOD is as follows:
1) Design Size in classes (DSC): This metric is a count of the total number of classes in the design. 2) Number of Hierarchies (NOH): This metric is a count of the number of class hierarchies in the design.
3) Average Number of Ancestors (ANA): This metric value signifies the average number of classes from which a class inherits information.
4) Data Access Metric (DAM): It is the ratio of the number of private attributes to the total number of attributes declared in the class.
5) Direct Class Coupling (DCC): It is a count of different number of classes that a class is directly related to. Booch has defined visual modeling framework to perform real world modeling of any software and non software systems.
3. Quality Assessment through OO Metrics
The three important metrics namely CK, MOOD and QMOOD metrics. As a case study JAVA RMI classes and subclasses has been chosen to determine the impact of different metrics attributes. In the analysis authors have used these classes to measure object-oriented metrics by using SDMetrics Tool ver. 2.11 demo [14]. the initial step of this methodology is to create the configuration file with all the necessary attributes including Compilation Procedure, OOAD Metrics and Error Information. The next step is to get the inputted program from the user and then to analysis the quality of the program using OOAD Metrics. The quality of the program can be determined by compiling the program using the compilation procedure. The result of the compilation procedure is analyzed based upon the compilation result. If the compilation result shows “successfully compiled”, then there is no error occurred and then the quality of the program is determined to be good. Otherwise, based upon the error rate occurred, the quality of the program is analyzed. Thus the OOAD Metrics is used to determine the program quality.
Liu, K.Zhou and S.Yang [11] have given perception that quality of software also plays an important role in terms of safety aspects and financial aspects. They bridged the gap between quality measurement and design of these metrics, with the help of measuring the excellence of Object Oriented Designs during development and re-development process of the software. On the other side Subramanyam and Krishnan [12] used CK Metrics suits and concluded that for the developers, designs metrics are very important to know the design aspects of the software and to enhance the quality
© 2014, IJCSMC All Rights Reserved
945
Table III: Metrics value for Object Oriented Metrics
Fig 2 QMOOD Metrics
4. Result and Discussion
The increase in software development means the measurement was also so high. The increasing significance being placed software measurement which has to lead and increase amount of research on developing the new software measures In MOOD Metrics, MHF is having value 0.89 meaning little functionality i.e., Interface is provided by classes rather than functionality. Designing of attributes or data hiding is shown by AHF 0.95 which means that using class methods data can be accessed. In the current work MIF value is 1.8 which shows system is less specialized as methods are inherited and functionalities are reused. MIF value 1.8 and AIF value 0.6 shows that reuse of functionality is higher than reuse of information or data. A PF value 0.1 indicates that system uses less polymorphism with this value and it is verified that RMI classes provide reuse of code but it doesn’t support to multiple functionalities for an operation call. DIT metric value indicates maximum path from root to leaf and in our case the value is 3 which indicate average 3 levels of inheritance hence optimum reuse of code and clear Understandability of system (RMI classes). NOC 16 indicates large amount of responsibility associated with a class (average 16 children per class). MPC, message passing coupling 0 indicates there is no dependency among the classes in RMI. NOA, number of attributes per class 9 and NOM (number of method per class) 15 indicates complex class design. The value 3 of ANA indicates an acceptable design complexity in JAVA RMI classes.A PF value 0.1 indicates that system uses less polymorphism with this value and it is verified that RMI classes provide reuse of code but it doesn’t support to multiple functionalities for an operation call.DIT metric value indicates maximum path from root to leaf and in our case the value is 3 which indicate average 3 levels of inheritance hence optimum reuse of code and clear understandability of system (RMI classes). NOC 16 indicates large amount of responsibility associated with a class (average 16 children per class).MPC, message passing coupling 0 indicates there is no dependency among the classes in RMI. NOA, number of attributes per class 9 and NOM (number of method per class) 15 indicates complex class design. The value 3 of ANA indicates an acceptable design complexity in JAVA RMI classes.
5. Concluding Remarks
The authors have applied set of metrics defined by metric suit given by CK, MOOD and QMOOD. As a test data JAVA RMI classes have been chosen. Metrics are important to judge the complexities and reliability issues of any object oriented system. In this paper, authors have found that the design of JAVA RMI classes has passed various quality parameters and exhibit good design characteristics. Authors have chosen limited set of metrics, which are more important in reference of JAVA RMI classes. It shows good adoption of new changes and provides higher degree of expandability with a heavy grade of efficient message passing communication capabilities. Available metrics confined to limited boundary, besides that there should be more emphasis on different domain related to quality parameters and some new metrics are still required to measure the hidden complexities aspects for a large and complex object oriented system. These will certainly helpful in reducing the cost and effort incurred in the design of any object oriented system and one can determine the level of its reliability and robustness, before its implementation begins.
References
[1] L.C.Briand, J.Wuest, J.Daly and Porter V., “Exploring the Relationships Between Design Measures and Software Quality In Object Oriented Systems”, Journal of Systems and Software, 51, 2000.
[2] L.C. Briand, W.L. Melo and J.Wust, “ Assessing the Applicability of Fault Proneness Models Across Object Oriented Software Projects”, IEEE transactions on Software Engineering. Vol. 28, No. 7, 2002.
[3] P.Coad and E.Yourdon, “Object Oriented Analysis”, Yourdon Press, 1990.
[4] L.H. Rosenberg and L.Hyatt, “Applying and interpreting object oriented metrics”, Proceedings of software technology conference, utah, April 1998.
METRICS AVERAGE
MOOD METRICS
MHF 0.89
AHF 0.95
MIF 1.8
AIF 0.6
PF 0.1
CK METRICS
DIT 3
NOC 1 6
MPC 0
QMOOD METRICS
NOA 9
NOM 15
© 2014, IJCSMC All Rights Reserved
946
[5] S.R. Chidamber, C.F.Kemerer, “A metrics suite for Object Oriented Design,”IEEE Transactions on Software Engineering, Vol. 20, No. 6, June 1994, pp. 476-493.
[6] F.B.Abreu, “The MOOD Metrics Set”, Proc.ECOOP’95 Workshop on Metrics, 1995.
[7] A.V. Hudli and R.V. Hoskins: “Software metrics for OOD”, IEEE International conference, 2002.
[8] L.C. Briand, W.L. Melo and J.Wuest, “A Unified Framework for Coupling Measurement in Object Oriented Systems”, IEEE
Transactions on Software Engineering, 25(1), 1999.
[9] M.Lorenz and J.Kidd,”Object Oriented Software Metrics”, Prentice- Hall, 1994.
[10] J.Bansiya and C.G Davis, “ A Hierarchical Model for Object Oriented Design Quality Assessment”, IEEE Transactions on Software Engineering, 2002.
[11] H.Lilu, K.Zhou and S.Yang: “Quality metrics of OOD for Software development and Re-development”, First Asia-Pacific Conference on Quality Software, August 2002.
[12] M.Subramanyam and R.Krishnan: “Emphirical Analysis of CK metrics for OOD complexity: Implication for software defect”, IEEE transaction on software engineering, 2003.
[13] R.Harrison, Steve J.Counsell and R.V.Nithi: “An evaluation of the MOOD set of OOSM”, IEEE Transaction on Software Engineering, vol.24 no.6, pp.491-496, June 1998.