Evaluating the Effectiveness of Information Presentation
in a Full End-To-End Dialogue System
Taghi Paksima
Enterprise Search Group Microsoft
D-81669 Munich, Germany [email protected]
Kallirroi Georgila
Institute for Creative Technologies University of Southern California Marina del Rey, CA 90292, USA
Johanna D. Moore
School of Informatics University of Edinburgh Edinburgh, EH8 9AB, UK
Abstract
Recent work on information presenta-tion in dialogue systems combines user modelling (UM) and stepwise refine-ment through clustering and summarisa-tion (SR) in the UMSR approach. An eval-uation in which participants rated dialogue transcripts showed that UMSR presents complex trade-offs understandably, pro-vides users with a good overview of their options, and increases users’ confidence that all relevant options have been pre-sented (Demberg and Moore, 2006). In this paper, we evaluate the effectiveness of the UMSR approach in a more realis-tic setting, by incorporating this informa-tion presentainforma-tion technique into a full end-to-end dialogue system in the city infor-mation domain, and comparing it with the traditional approach of presenting infor-mation sequentially. Our results suggest that despite complications associated with a real dialogue system setting, the UMSR model retains its advantages.
1 Introduction
Spoken dialogue systems (SDS) that help users find a desired option (e.g., flight, restaurant, movie) from the set of options satisfying their con-straints typically present options sequentially, or-dered along a default dimension (e.g., by price or departure time). An example is shown in Fig. 1.
The user can then navigate through the options and refine them by offering new constraints until a suitable option has been found. However, when the number of available options is large, this pro-cess can be painstaking, leading to long dialogues
There are six restaurant options matching your query. Number 1: Voujon offers a bright, airy and contempo-rary dining area, with simple floral displays and leather seating. It serves Indian cuisine. It is located in the city centre. The average price is£24 per person.
Number 2: Saffrani’s decor is modern, the dining room wee, though the menu is enormous, and the atmosphere charming. It offers new Indian dishes never before seen in Edinburgh. It serves Indian, seafood cuisine. It is located in the city centre. The average price is£28 per person.
Number 3: Britannia Spice . . .
Figure 1: Example of sequential information pre-sentation in the city information domain (modi-fied version of the TownInfo system (Lemon et al., 2006)).
and reduced user satisfaction. Thus a major chal-lenge in the development of SDS is to improve information presentation algorithms. This is im-portant for several reasons: (1) to avoid overbur-dening the user’s memory by presenting too many options; (2) to ensure that the user is given an overview of the available option space so that the optimal option can be found; and (3) to minimise the number of dialogue turns (hence dialogue du-ration) required for the user to find an acceptable option. As Walker et al. (2001) showed, failing to meet this third goal may reduce overall user satis-faction.
(Demberg and Moore, 2006; Polifroni and Walker, 2008) or audio recordings (Walker et al., 2004), for rating. The general consensus from these stud-ies is that users significantly prefer approaches that take their preferences into account. How-ever, because users were not interacting with these SDS, the evaluation criteria were limited to users’ perceptions (e.g., informativeness, good overview of options, confidence in choice, etc.), and met-rics such as effectiveness (i.e., actual or perceived task completion) and efficiency (i.e., length of di-alogue) could not be assessed. To address this issue, Winterboer and Moore (2007) carried out a Wizard-of-Oz (WOz) study in which users par-ticipated in dialogues controlled by two different information presentation algorithms. They found that not only did users prefer presentations based on a user model, dialogues employing the “user-model based summarise and refine” (UMSR) ap-proach led to greater task success and dialogue ef-ficiency.
In this paper, we take this one step further, and evaluate the effectiveness of the UMSR approach in a more realistic setting, incorporating this con-tent selection and presentation strategy into a full end-to-end dialogue system, and comparing it to the traditional sequential enumeration approach. Our results suggest that despite complications as-sociated with a real dialogue system setting, the UMSR model retains its advantages. Our results also verify the hypothesis that the UMSR model presents complex trade-offs in a concise, yet un-derstandable way. Furthermore, as in the WOz study, the UMSR approach leads to a significant reduction in the number of dialogue turns.
The structure of the paper is as follows: In Sec. 2, we discuss related work. In Sec. 3 we present the full end-to-end SDS used for com-parison between the standard sequential enumer-ation approach and the UMSR approach. In Sec. 4 we describe how we implemented the UMSR ap-proach. Then in Sec. 5 we provide an example. In Sec. 6 we describe our experimental design and in Sec. 7 our results. Finally in Sec. 8, we present our conclusions.
2 Previous Approaches
As noted above, a number of approaches to in-formation presentation in SDS have recently been proposed. The user-model based (UM) approach employs a model of the users preferences and de-cision theory techniques to identify and present a small number of options that best match the user’s
preferences (Carenini and Moore, 2001; Walker et al., 2004; Moore et al., 2004). Fig. 2 shows a sam-ple presentation generated using the UM approach for a student user who cares most about price and flying direct.
There’s a direct flight on BMI with a good price. It arrives at four ten p.m. and costs a hundred and twelve pounds. The cheapest flight is on Ryanair. It arrives at twelve forty-five p.m. and costs just fifty pounds, but it requires a connection in Dublin.
Figure 2: Example of information presentation based on the UM approach, from (Moore et al., 2004).
Although the UM approach enables a concise presentation of a small number of options, high-lighting the ways in which these options satisfy user preferences, it does not scale up to presenting a large number of options. When there are hun-dreds of potentially relevant options to consider (e.g., all Italian restaurants in New York City), there may be a large number of options that fit the user model, making it difficult to narrow down the number of options. In addition, users may not be able to provide constraints until they are presented with more details concerning the option space. Moreover, the system does not provide an overview of the available options, which may lead to the user’s actual or perceived missing out on possibly better alternatives.
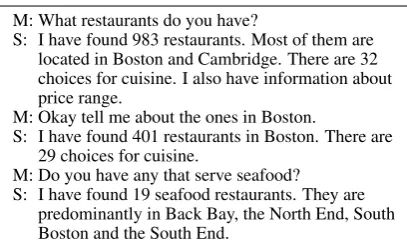
An alternative approach, which we call the sum-marise and refine approach (SR) (Polifroni et al., 2003; Chung, 2004) structures large datasets for summarisation and successive refinement. It sup-ports the user in narrowing in on a suitable option by grouping the options in the database into clus-ters of options with similar features. The system can then summarise the common attributes of the options and thus suggest further refinement con-straints to the user. In this content structuring ap-proach, the prompts presented to the user and the order in which they appear, are determined at run-time based on an algorithm that computes the most useful set of attributes, as dictated by the set of op-tions that satisfy the user query. For large datasets, attributes that partition the data into the minimal number of clusters are chosen, so that a concise summary can be presented to the user to refine (Fig. 3).
M: What restaurants do you have?
S: I have found 983 restaurants. Most of them are located in Boston and Cambridge. There are 32 choices for cuisine. I also have information about price range.
M: Okay tell me about the ones in Boston.
S: I have found 401 restaurants in Boston. There are 29 choices for cuisine.
M: Do you have any that serve seafood? S: I have found 19 seafood restaurants. They are
predominantly in Back Bay, the North End, South Boston and the South End.
Figure 3: Sample dialogue between simulator (M) and SR system (S), from (Polifroni et al., 2003).
process. Because the user’s preferences are not taken into account, the clusters may contain many irrelevant entities, which must be filtered out suc-cessively with each refinement step. Second, if there is no optimal solution, exploration of trade-offs between options can be difficult. Finally, the chosen clusters may be based on attributes that are irrelevant for the specific user.
In an attempt to combine the benefits of the UM and SR approaches, Demberg & Moore (2006) devised the user-model based summarise and re-fine (UMSR) approach to information presenta-tion. This approach first clusters the values of each attribute in order to group them so that the op-tions can be summarised more easily later, and la-bels like ”cheap”, ”moderate”, ”expensive” can be assigned to values of continuous categories such as “price”. The system then structures options into an option tree based on the ranking of at-tributes in the user model, the options returned from the database, and the attribute-value clus-tering. The resulting option tree determines how different options relate to one another, and which ones are most attractive for the user. After the tree structure is built, it is pruned to decide which op-tions are compelling to the user according to the user model. This allows the system to save time by omitting options that are not of any potential interest to the user. Once pruning is complete, each branch of the tree describes a possible refine-ment path, and thus can be used to direct dialogue flow. Trade-offs between alternative options are presented explicitly in order to provide the user with a better overview of the option space. In ad-dition, to give users confidence that they are being presented with all of the relevant options, a brief account of all the remaining (irrelevant) options is also provided. For a more detailed discussion of the UMSR approach, see (Demberg and Moore,
2006). In Sec. 4 we describe how we employed the UMSR approach in our system.
3 The TownInfo System
The TownInfo SDS was developed as part of the EC project TALK (Lemon et al., 2006). Users can search for hotels, bars and restaurants in an artificial town. The system supports two di-alogue strategies, one hand-crafted and another learnt using Reinforcement Learning (Henderson et al., 2008). For the current experiment we used the hand-crafted strategy. Natural language un-derstanding is performed using a keyword-based parser and natural language generation is based on templates. The information presentation is se-quential. An example is given in Fig. 1, taken from the modified version of TownInfo for the cur-rent experiment. Although the original TownInfo system supported speech input and speech output, here we use text input/output to make sure that our results are not influenced by poor recognition ac-curacy or intelligibility due to poor speech syn-thesis. Of course, as we mention in Sec. 8, the next step would be to perform an experiment with speech input/output.
For our current experiment we focussed on restaurant recommendations and the TownInfo database had to be extended to include a much wider range of options to provide more realistic information presentation scenarios. The database used in our experiments contains a total of 80 restaurants in Edinburgh, UK.
4 The UMSR Algorithm
This section briefly describes our implementation of the UMSR algorithm; for more details see (Demberg and Moore, 2006). Sec. 5 provides an example for clarity.
4.1 The User Model
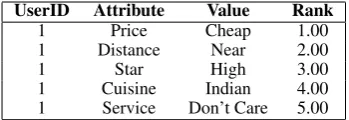
The user model contains the user’s ranking and preferred values for the relevant attributes in the restaurant domain: price, distance, star
rating, service rating, and cuisine
type. Table 1 shows a sample user model. The Rankfield indicates the relative importance of the attributes for the user, with 1 being most impor-tant. TheValuefield indicates the user’s preferred value for each attribute.1
1If two attributes in a user model have identical ranks, the
UserID Attribute Value Rank
1 Price Cheap 1.00
1 Distance Near 2.00
1 Star High 3.00
1 Cuisine Indian 4.00
1 Service Don’t Care 5.00
Table 1: Sample user model for a student.
According to Elzer et al. (1994), some prefer-ences are enough to reject options outright (and therefore are more like goals) whereas others are more purely like preferences (to be weighed and ranked). Here we do not make such a distinction.
4.2 Adapting to Changes to the User Model
In the original design, the user model was cre-ated at the outset and not modified during the dia-logue. However, during initial piloting of the sys-tem, we found that this design did not support “sit-uational preferences”. For example, consider the user model for the student in Table 1. This user normally prefers to have Indian food if she has the option to (a “dispositional preference”). If, how-ever, in the current situation she is entertaining a friend from out of town who wishes to try Scottish food, the user may decide to explore options for Scottish cuisine (a “situational preference”). Here, the user changes her original query for the situa-tion, thus redefining her preferences. When this occurs, we must perform a new database query and rebuild the option tree. To take these dynamic changes into account during the course of the dia-logue, at each dialogue turn the user query is com-pared against the user model, and if any difference is noted, the user model is updated to reflect the current preferences, the tree is rebuilt using the new user model, and the dialogue continues with a summary of the available options based on this new tree.
Note that for individual models, i.e. user models that are designed for individual people and not for classes of users (student or business person), some queries could justify situational changes and some could indicate permanent (or at least less tempo-rary) changes to the user model (e.g., ”Are there any nicer restaurants? I got a new job”). In our experiment we use only class models and we do not allow permanent changes to the user model.
4.3 The Clustering Algorithm
Following (Polifroni et al., 2003) and (Demberg and Moore, 2006), we used agglomerative group-average clustering to automatically group values
for each attribute. The algorithm begins by assign-ing each unique attribute value to its own bin, and successively merging bins whose means are most similar until a stopping criterion (a target of no more than three clusters, in our implementation) is met. The bins are then assigned predefined la-bels, e.g., “cheap”, “moderately priced” and “ex-pensive” for price. Clustering attribute values with this algorithm allows for database-dependent labelling. Therefore, a restaurant with a price of £35 might be considered as expensive for Edin-burgh, but inexpensive for London.
4.4 Building the Option Tree
The tree building algorithm is recursive. It begins at the root node, which contains all entities in the retrieved dataset, and builds up the tree level by level based on the ranking of attributes in the user model. At each node of the tree, it retrieves the next attribute preference from the user model and then invokes the clustering algorithm for this at-tribute’s values. Once the current dataset has been clustered, the algorithm then adds the resultant clusters as the children of the current node. Af-ter each clusAf-ter is added, the algorithm is invoked recursively on the newly created children of the current node.
As the tree is being constructed, the algorithm arranges the nodes in the tree such that the children of each node are ordered from left to right in de-creasing order of desirability. For example, if the particular user prefers restaurants that are far from the city centre, the clusters based ondistance
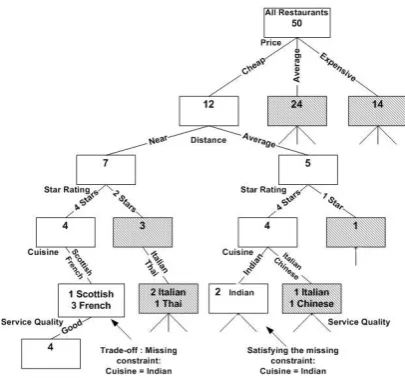
would be ordered such that “far” is the leftmost child and “near” is the rightmost child. Fig. 5 de-picts an option tree structure for the user model of Table 1, in the context of the example of Sec. 5. The numbers in the nodes indicate how many op-tions are represented by the node.
Given an option tree ordered in this way, to find the best available options, the system traverses the tree in a depth-first fashion starting from the root and selecting the leftmost branch at each node.
4.5 Pruning the Option Tree
domi-nated option is in all respects equal to or worse than some other option in the relevant subset of the database; it should not be of interest for any rational user.
The pruning algorithm follows Demberg & Moore (2006), and thus we summarise it only briefly here. The algorithm operates directly on the ordered option tree, using the tree structure so that it can efficiently determine dominance rela-tions without having to compare each pair of op-tions. The algorithm traverses the tree in depth-first order, generating constraints during this pro-cess. These constraints encode the properties that other options would need to satisfy in order not to be dominated by the options which have already been deemed to be dominant. A node must ful-fil the constraints that apply to it, otherwise it is pruned from the tree. If an option (or a cluster of options) satisfies a constraint, the property that sat-isfied the constraint is marked as the options’ jus-tification. If some, but not all, of the constraints can be satisfied by an option, the constraints are propagated to the other nodes (see Fig. 5).
4.6 Natural Language Generation
Once a pruned option tree has been constructed, the system can generate a presentation to the user. The natural language generation (NLG) algorithm includes three steps described below.
4.6.1 Identifying Trade-offs
To identify the trade-offs, the algorithm tra-verses the tree looking for constraints that were generated during the pruning process. For each node that generated a constraint, the algorithm finds the best sibling, which satisfies the con-straint. It does this by first checking the siblings of the current node, and if none satisfy the con-straint, it moves up the tree and recursively tra-verses siblings of the ancestor node. Once a trade-off node is found, it is recorded in the option tree at that point, and the algorithm then searches up-ward in the tree to find the lowest common parent of the trade-off nodes. This is the “Differentiating Parent” for the trade-off; the attribute that deter-mines the children of this node indicates the trade-off the user has to make. In the example shown in Fig. 5, the attribute that the user must trade-off is distance. The system then generates a natural language description of the trade-off using templates, e.g., “For a restaurant that serves Indian cuisine you would have to go farther from the city centre”. If a constraint cannot be satisfied, the
sys-tem generates a sentence describing this situation, e.g., “However, there are no inexpensive restau-rants that match your preferences”.
4.6.2 Summarisation
The summarisation process aims to present the user with an understandable and concise overview of the available options, so that she can make informed decisions on how to proceed with her query. In a SDS, it is important not to present too much information in a single turn in order to keep the memory load on the user manageable. Thus, in our implementation, the system provides a sum-mary of the first three attributes (corresponding to the first three levels of the tree), e.g., “I found 12 restaurants which are inexpensive. Only 7 of them are near the city centre, out of which only 4 have a high star rating”. If there are any trade-offs over the first three attributes, they are also mentioned to the user, using the algorithm described above.
4.6.3 Turn Generation
The turn generation algorithm first determines whether the current user’s query is consistent with the preferences defined in the user model. Since the option tree, and consequently the generation so far, have primarily been based on the user model, if the algorithm notices an inconsistency it will give priority to the most recent user query as a sit-uational adjustment (see Sec. 4.2), and then update the user model to reflect the adjustment. If the user model is modified, the algorithm rebuilds the op-tion tree, and generates the next turn using the new user model and the most recent user query.
To ensure the user that the system has under-stood her correctly, and to increase her confidence, the algorithm includes a summary of all attribute values that are common to the cluster in the option tree that is being used to generate the summary. For example, for the second turn in the dialogue of Fig. 4, although the user’s most recent query was aboutcuisine, the system includes a summary of all the attributes already mentioned to the user: “All of them are cheap, are near the city centre, and have a high star rating”.
5 Example
To clarify things further, here we present an exam-ple. A dialogue between the UMSR system and a student (user model of Table 1) is depicted in Fig. 4.
U: Tell me about the restaurants you have.
S: I found 12 restaurants which are inexpensive. Only 7 of them are near the city centre, out of which only 4 have a high star rating. I also have information about cuisine and service quality.
U: Tell me about the cuisine.
S: There is only 1 restaurant that serves Scottish food, and 3 restaurants that serve French food. They all provide good service quality. All of them are cheap, are near the city centre, and have a high star rating. For a restaurant that serves Indian cuisine you would have to go farther from the city centre. U: Okay, tell me about the Scottish one.
S: The Jam House’s menu includes Scottish dishes sparked with international flavour, with a decent choice of vegetarian dishes. It is located in the centre. The average price is£22 per person. U: What about Indian restaurants?
S: I found 2 restaurants that serve Indian food. Both of them are cheap, within average distance from the city centre, and have a high star rating. Only one of them provides good service quality. U: Okay, tell me about this one.
S: The Raj on the Shore’s theme extends from the soldier figurines behind the exotic blue bar to the predominantly Bangladeshi, Indian menu. It serves Indian and Bangladeshi cuisine. It is located in the north. The average price is£20 per person.
Figure 4: Example dialogue with our UMSR ap-proach (student user of Table 1).
asking generally for a restaurant recommendation, and the system provides a summary based on the three top-ranking attributes for this user: price,
distance and star rating, which corre-spond to the first three levels of the option tree. Next the user asks aboutcuisine type, which generates a trade-off since there are no Indian restaurants (user’s preference) that are cheap, near the city centre, and of high star rating. The user then asks about the Scottish option, before switch-ing back to her preferred cuisine type (Indian). Be-cause Indian cuisine was in the user’s initial pref-erence model, a constraint ofcuisine=Indian
was generated when traversing the leftmost branch of the tree, and this justified not pruning the un-shaded nodes in the right subtree of Fig. 5, in or-der to generate the trade-off. However, if the user had asked about expensive restaurants, then a new database query would have been made and a new option tree would have been built. A more com-plex example is given in the Appendix.
6 Experimental Design
In total 18 subjects interacted with our two sys-tems. Each participant interacted three times with the modified TownInfo system, and another three times with the system that supported our imple-mentation of the UMSR model (108 dialogues in
Figure 5: A sample option tree structure for the student user of Table 1. Pruned nodes are shown as shaded.
total). The order of the dialogues was randomised among the subjects. Each experiment took be-tween 40 and 50 minutes on average.
For each task, subjects were provided with the user profile and the actual scenario for the spe-cific task in hand. The tasks were carefully con-structed so that half of them could be solved with-out making any trade-offs and the other half re-quired a trade-off to be made. At the end of each task the subjects had to fill out a questionnaire with 10 questions on a 7-point Likert scale. They were also asked if they had been able to accomplish the given task (perceived task completion), i.e., to find a suitable restaurant for the scenario and user pro-file in hand. Finally, after each task they had to provide the name(s) of the restaurants they chose for the task. The name(s) stated for this task were then used to compare perceived task completion with actual task completion. At the end of each task with the UMSR system, the profiles were re-set to the default attribute values and ranks.
shortcom-System U CC CF A E
UMSR-all 5.04 4.65 3.22 3.66 4.69
TownInfo-all 4.87 4.04 2.93 3.20 3.59 UMSR-with TO 4.74 4.59 2.67 3.26 4.15 TownInfo-with TO 4.59 3.41 2.74 2.33 2.70
UMSR-no TO 5.33 4.70 3.78 4.08 5.22
TownInfo-no TO 5.15 4.67 3.11 4.07 4.48
Table 2: Average scores of the question-naires for all dialogues, dialogues with trade-offs (with TO) and dialogues without trade-trade-offs (no TO) (U=understandability, CC=conciseness, CF=confidence, A=accessibility, E=efficiency).
ing the UMSR approach retained its advantages and proved more successful than the traditional se-quential enumeration approach.
7 Results
The perceived task completion (PTC) for the UMSR system and the TownInfo system was 90.74% and 85.19% respectively, and the actual task completion (ATC) 74.07% and 62.96%. Thus the UMSR approach led to a relatively better user confidence in having achieved the task.
The average number of turns was 9.24 for UMSR compared to 17.78 for TownInfo, which denotes a significant reduction in the number of dialogue turns required to accomplish a given task. This reduction becomes even more promi-nent when there is a trade-off involved. With such dialogues, the average number of turns for UMSR remained almost constant at 9.41, whereas Town-Info showed an increase reaching up to 24.19. This huge difference is obviously a significant improvement in system efficiency and user sat-isfaction. It also supports our hypothesis that the UMSR approach can present trade-offs under-standably. For dialogues without a trade-off the number of turns was 9.07 for UMSR and 11.37 for TownInfo.
Dialogue duration also showed a great improve-ment in UMSR over TownInfo (4:49 (m:s) vs. 6:11). The duration however was almost the same for the two systems when a trade-off existed (4:40 vs. 4:49). This could mean that although the num-ber of turns in this case is smaller for UMSR, the length of the generated output is longer, and re-quires more attention to understand. Yet again in dialogues without a trade-off, UMSR had a con-siderably shorter duration than TownInfo (4:57 vs. 7:34).
Average scores of the questionnaires are given in Table 2.
In response to the question “I thought the way the system provided information to me was easy to understand” the average score over all 108 di-alogues was 5.04 for UMSR and 4.87 for Town-Info. The preference for UMSR exists for dia-logues both with and without a trade-off. How-ever, for all three cases the differences were not significant(p >0.05).
Conciseness is the quality of providing a con-cise overview of all the available options to the user. The UMSR system was preferred at 4.65 over 4.04 for TownInfo(p = 0.034). The differ-ence between the two systems is very significant for dialogues with a trade-off(p < 0.003). How-ever, for dialogues without a trade-offp = 0.92. This was predictable as the main innovation in UMSR is the ability to present trade-offs in a con-cise and understandable way, hence the significant difference for the dialogues with trade-offs.
To evaluate their confidence in having heard all the relevant options, the subjects were asked to rate the statement “I thought there were better op-tions for my request than what the system gave me”. Because of the negative nature of the ques-tion, the Likert scale was inverted before analysis. The average score was 3.22 and 2.93 for UMSR and TownInfo respectively. This indicates that the users have slightly more confidence in hav-ing heard all the relevant options with the UMSR system, although this difference is not significant (p > 0.05). For dialogues with a trade-off, the average confidence score was slightly better for TownInfo (2.74 vs. 2.67), but not significant(p= 0.8). However, there is a significant difference for dialogues without a trade-off (p < 0.03). An-other notable issue is the overall low scores for the cases with a trade-off. This signifies that perhaps more information needs to be given to the user for dialogue turns describing a trade-off. A care-ful balance needs to be drawn between concise-ness and comprehensiveconcise-ness in these cases. This however, will obviously increase dialogue dura-tion, and might affect understandability.
Efficiency is the quality of enabling users to find the optimal option quickly. The statement “In this task, the system allowed me to find the optimal restaurant quickly”, resulted in an aver-age score of 4.69 for UMSR vs. 3.59 for Town-Info (p = 0.002). Once again, a significant dif-ference was noted for dialogues with a trade-off, with 4.15 and 2.70 for UMSR and TownInfo re-spectively(p = 0.004). However, the difference for dialogues without a trade-off was not signifi-cant(p= 0.12).
8 Conclusions and Future Work
In this paper, we evaluated the effectiveness of the UMSR approach in information presentation in a full end-to-end dialogue system. The UMSR ap-proach was compared with the traditional sequen-tial enumeration of options. Our results verified our hypothesis that the UMSR approach presents a better overview of the trade-offs within the option space, and improves user experience and confi-dence in the system. Furthermore, with the UMSR approach there is a significant reduction in the number of dialogue turns required to complete the task. The results also showed that UMSR specifi-cally outperforms TownInfo when there is a trade-off involved. The UMSR results presented statisti-cally significant improvement for conciseness, ac-cessibility, and efficiency. Overall, subjects were more satisfied with the UMSR system. When they were asked if they would use the system again as a deployed product the score was 4.74 for UMSR and 3.70 for TownInfo(p = 0.002), further veri-fying that the users preferred the UMSR approach over the sequential enumeration of TownInfo.
In future work we intend to make a number of improvements. For example in the turn genera-tion algorithm, we will optimise the generated out-put in an effort to strike a balance between un-derstandability and complexity. Another impor-tant issue is to modify the UMSR algorithm so that it can accept multiple attributes in a single query. Moreover, we will perform experiments with both speech input and output. Finally, we will com-pare the UMSR approach with the UM and SR ap-proaches in the same setting, i.e., a full end-to-end SDS.
Acknowledgements
This paper is based on a research experiment con-ducted at the University of Edinburgh. Paksima was funded by the European Commission Eras-mus Mundus scholarship program. Georgila was
partially funded by the Wellcome Trust VIP Award and is currently funded by the U.S. Army Re-search, Development, and Engineering Command (RDECOM). The content does not necessarily re-flect the position or the policy of the U.S. Gov-ernment, and no official endorsement should be inferred. The authors thank the three anonymous reviewers.
References
G. Carenini and J.D. Moore. 2001. An empirical study of the influence of user tailoring on evaluative argu-ment effectiveness. InProc. of IJCAI.
G. Chung. 2004. Developing a flexible spoken dialog system using simulation. InProc. of ACL.
V. Demberg and J.D. Moore. 2006. Information
pre-sentation in spoken dialogue systems. In Proc. of
EACL.
S. Elzer, J. Chu-Carroll, and S. Carberry. 1994. Recog-nizing and utilizing user preferences in collaborative consultation dialogues. InProc. of UM ’94.
J. Henderson, O. Lemon, and K. Georgila. 2008. Hy-brid reinforcement/supervised learning of dialogue
policies from fixed datasets. Computational
Lin-guistics, 34(4):487–511.
O. Lemon, K. Georgila, J. Henderson, and M. Stut-tle. 2006. An isu dialogue system exhibiting re-inforcement learning of dialogue policies: generic slot-filling in the talk in-car system. In Proc. of EACL.
J.D. Moore, M.E. Foster, O. Lemon, and M. White. 2004. Generating tailored, comparative descriptions in spoken dialogue. InProc. of FLAIRS.
J. Polifroni and M. Walker. 2008. Intensional sum-maries as cooperative responses in dialogue:
Au-tomation and evaluation. InProc. of ACL–HLT.
J. Polifroni, G. Chung, and M. Walker. 2003. To-wards automatic generation of mixed-initiative
di-alogue systems from web content. InProc. of
Eu-rospeech.
M.A. Walker, R.J. Passonneau, and J.E. Boland. 2001. Quantitative and qualitative evaluation of darpa
communicator spoken dialogue systems. In Proc.
of ACL.
M. Walker, S. Whittaker, A. Stent, P. Maloor, J.D. Moore, M. Johnston, and G. Vasireddy. 2004. Gen-eration and evaluation of user tailored responses in dialogue. Cognitive Science, 28:811–840.
A. Winterboer and J.D. Moore. 2007. Evaluating in-formation presentation strategies for spoken
recom-mendations. InRecSys ’07: Proc. of the 2007 ACM
Appendix
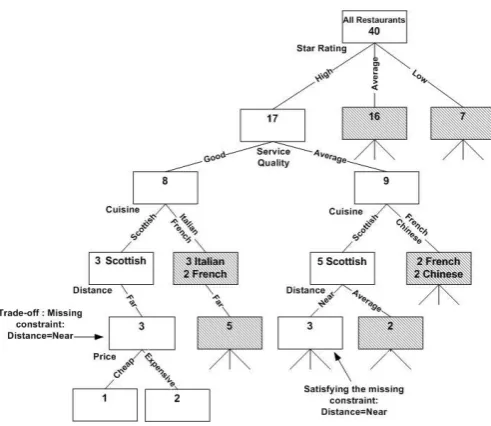
Option Tree A for User Model A is built.
U: I’d like to get some food tonight.
S: I found 17 restaurants with a high star rating. Only 8 of them provide good service quality, out of which only 3 serve Scottish food. I also have information about distance and price.
U: Are they close to the city centre?
S: I found 3 restaurants that are located far from the city centre. 1 of them is cheap and 2 are expensive. They all have a high star rating, provide good service quality, and serve Scottish food. For a restaurant near the city centre you would have to go for average service quality.
U: How about French cuisine?
The System cannot answer the query because the “French”cuisine branches of Option Tree A have been pruned and their nodes are shown as shaded.
User Model A changes to User Model B (situational query). Option Tree B for User Model B is built.
S: I found 10 restaurants that serve French food. Only 5 of them have a high star rating, out of which only 3 provide good service quality. I also have information about distance and price.
U: Tell me about the distance from the city centre.
S: Only 1 of them is located near the city centre and is inexpensive. It serves French food, has a high star rating, and provides good service quality.
U: Tell me about it.
S: La Bagatelle’s dishes include a starter of roast pigeon with canelloni of shiitake mushroom, and a main course of panfried veal with prunes.
U: That’s great. I’ll take it. . . .
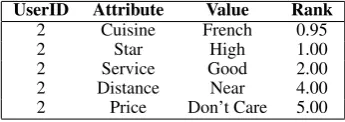
Figure 6: Example dialogue with our UMSR approach for a business person, User Model A (Table 3) and User Model B (Table 4), Option Tree A (Fig. 7) and Option Tree B (Fig. 8).
UserID Attribute Value Rank
2 Star High 1.00
2 Service Good 2.00
2 Cuisine Scottish 3.00
2 Distance Near 4.00
2 Price Don’t Care 5.00
Table 3: Sample user model for a business person (User Model A).
UserID Attribute Value Rank
2 Cuisine French 0.95
2 Star High 1.00
2 Service Good 2.00
2 Distance Near 4.00
2 Price Don’t Care 5.00
Figure 7: Option tree structure (Option Tree A) corresponding to the User Model A of Table 3. Pruned nodes are shown as shaded.