Volume 2, No. 6, Nov-Dec 2011
International Journal of Advanced Research in Computer Science
RESEARCH PAPER
Available Online at www.ijarcs.info
Investigation of Different Parameters of Dynamic Source Routing for Wireless Sensor
Networks for varying terrain areas and different speed (node speed)
Vijay Mohan Shrimal* Assistant Professor
Department of Computer Science and Engineering JaganNath Gupta Institute of Engineering and Technology,
Jaipur, Rajasthan, India vijay2007shrim@gmail.com
Ravindra Prakash Gupta Research Scholar
Department of Electronics and Communication Engineering Ajmer, Rajasthan, India
rpg1@rediffmail.com
Virendra Kumar Sharma Principal, BIT, Bhagwantpuram, Bhagwant University, Muzaffarnagar -UP, India
viren_krec@ yahoo.com
Abstract- The purpose of this experimental study is to measure the ability of the routing protocol to react to the network topology change while continuing to successfully deliver data packets to their destinations. To measure this ability, different scenarios are generated by varying the maximum speed in the network that also over different terrain areas.
The main focus of this paper is to discuss and evaluate the performance of different parameters in different scenarios and different terrain areas which may be small, large and very large in wireless sensor network using Dynamic Source routing protocols and for monitoring of critical conditions with the help of important parameters like Packet Delivery Fraction, End-to-End Delay, Average Throughput, NRL and Packet loss% in different scenarios [1].
This paper describes the performance matrices on different topologies based on varying the maximum speed and keeping the constant pause time in different terrain areas which is small, large and very large.
Simulations are run by considering DSR routing protocol. In order to get realistic performance, the results are averaged for a number of scenarios. Investigators were not attempting to measure the protocol performance on a particular workload taken from real life, but rather to measure the protocol, performance under different range of conditions [1]. Investigators use network simulator ns-2 to simulate wireless networks with various wireless routing protocols. NS-2 is a packet- level, discrete event simulator, widely adopted in the network research community.
Keywords-Average End-to-End Delay, Average Throughput, Network Simulator, Packet Delivery Fraction, Wireless Sensor Network
I. INTRODUCTION
Wireless sensor networks contain large view of sensors nodes which are implemented with a radio and form wireless sensors together. The Wireless sensor networks are fast, low maintenance and easy deployment networks which represents its characteristics. Power of sensors is a great resource in such a network which reflects to the design of hardware and software. The network protocols are designed for the sensor node communication and focus on the low energy consumption. The radio is equipped in the Wireless sensor networks with sensor node, if we want to reduce energy consumption we should turn off the radio when it does not use [2].
MANET is self configuring network of mobile nodes which is connected by wireless links. These nodes are freely move in the network and communicated to each other and change frequently while Wireless sensor network is cooperative network where sensor nodes are collected [3]. Both of these networks fall into the category of infrastructure less wireless networks as they do have any requirement regarding infrastructure during the deployment.
Routing protocols is very important for performance evaluation perspective in Wireless sensor networks. There are many factors must be overcome before efficient communication can be achieved in WSNs. Node deployment is application dependent and affects the performance of the routing protocol in WSNs. Sensors can perform their computations and transmission of information in a wireless environment by using their limited supply of energy [15]. In Wireless sensor networks, the node density, network size and topology is affected by scalability factor. This factor comes out form the factor that range of sensing is lesser than communication and requirement of nodes is larger for coverage of area. There are other major issues which effect to the wireless sensor networks environment as node/link heterogeneity, fault tolerance, network dynamics, transmission media, connectivity, coverage, data aggregation and quality of services.
II. ROUTINGPROTOCOL
The Dynamic source routing protocol is an efficient and simple routing protocol specifically used for multi-hop wireless adhoc networks of mobile nodes and wireless sensor networks. It has no need for any existing network infrastructure or administration. Dynamic source routing allows the network to be completely self- organizing and configuring. Dynamic source routing uses source routing to send packet which means the complete hop sequence to the destination is well known by the source [4].
DSR protocol uses two mechanisms for sending packet from source to destination which are “Route Discovery” and “Route maintenance” which works together to allow nodes to discover and maintain routes [5].
A.Route Discovery: -
When a source node SN wants to send packet to destination node, Route discovery process is used. First of all the source node check the route cache if it is already exist route to destination node DN. If the route destination node not exists, it starts the route discovery process by broadcasting route request message RRQM. This route request message RRQM contains the address of the source and destination and a unique identification number.
An intermediate node is used to find the route request message RRQM and then RRQM searches its route cache for a route to the destination node DN. If the route does not exist, it appends its address to the route record of the message and forward to its neighbors. This message is forwarded through the network until it reaches either the destination or intermediate node with a route of the destination node DN. Finally the route reply message is generated by send back to the source node SN with perfect hop sequence for researching the destination node DN. So the route discovery process is only used when source wants to send packet to destination and does not already know a route to destination DN [6].
B.Route Maintenance: -
Route maintenance process is used to handle the braking route. Basically there are two types of packets for route maintenance: Route error (RERR) Packet and ACKs. The fatal transmission error is encountered by a node, the route becomes invalid. The source node receives the error message.
Acknowledgment messages are used to verify the correct operation of the route links. In wireless networks acknowledgments are commonly provided such as the link-layer acknowledgment frame defined by IEEE 802.11 MAC protocol [6].
Figure 1. Route Request Message [6]
Figure 2. Route Reply Message [6]
III. SIMULATIONTOOL
NS-2 is an object based tool which encapsulates independent objects linked to each other within a system hierarchy. NS-2 uses OTCL interpreter and C++ as a front end. It defines the basic structure of the simulator [7]. Network simulator uses basic two languages for completion their tasks and needs. First, the details study of protocols requires a systems programming language, which helps to manipulate bytes, packet headers, and implement algorithms that run over large data sets. Second, the run time speed and turn around time is less important [8].
Network simulator use TCL to configure the topology, the nodes, the channels, schedules the events etc. C++ language is used to implements the protocols. The source node removes this error in the hop sequence from route cache and selects a new route. The correct operation of the route links is verified by the ACKs packets. It provides the passive acknowledgement to the sensor node [9].
IV. SIMULATIONPARAMETERS
In order to evaluate the performance of wireless network routing protocols, the following parameters were considered:
A. Packet Delivery Fraction (PDF):
Packet Delivery Fraction is the ratio of the number of data packets successfully delivered to the destination nodes and number of data packets produced by source nodes [10].
B. End-to-End Delay:
The term End-to-End delay refers to the time taken by a packet to be transmitted across a network from source node to destination node which includes retransmission delays at the MAC, transfer and propagation times and all possible delays at route discovery and route maintenance [11]. The queuing time can be caused by the network congestion or unavailability of valid routes [12].
C. Throughput:
The term throughput refers the number of packet arriving at the sink per ms. Throughput is also refers to the amount of data transfer from source mode to destination in a specified amount of time. The goal is to calculate maximum throughput of IEEE 802.11 technologies in the MAC layer for different parameters such as packet size [12].
D. Normalized Routing Load [%] (NRL):
NRL = (Number of Routing Packet) / (Number of Packet Received)
E. Packet Loss [%]:
It is the number of dropped packet to the total packets. Packet Loss [%] = (dropped Packets/ (total packets)) *100)
V. RESEARCHWORK
There are many research papers on routing protocols in wireless sensor network and all are used for evaluating performance of different parameters in different scenario. Researchers specify the difference between routing protocols and its performance for different parameters and which one is best for the case of Wireless Sensor Network.
In comparison of AODV, DSDV and DSR the Average end-to-end delay and throughput and other parameters in DSR are very high [13]. While in comparison of DSDV and AODV routing protocols, AODV performed better than DSDV in terms of bandwidth as AODV do not contain routing tables so it has less overhead and consume less bandwidth while DSDV consumes more bandwidth [14]. In this paper we selected to investigated DSR protocol for different performance parameters for different Terrain areas like small (1 Km. x 1 Km.), large (2 Km. x 1 Km.) and very large (2 Km. x 2 Km.)). Analysis were done using ns-2 simulator on these three cases of terrain areas in order to derive an estimation of the performance parameters.
VI. SIMULATIONSETUP
In this paper, we tested and investigated DSR protocol with a scenario where a total of 100 nodes are used with the maximum connection number 10; CBR connection; transfer rate is taken as 4 packets per second i.e. the send rate of 0.25. The speed is varied starting from 10 m/s, 20 m/s, 30 m/s, 40 m/s, 50 m/s, and 60 m/s (i.e. in the steps of 10 m/s) implemented respectively in a 1 Km. x 1 Km., 2 Km. x 1 Km. and 2 Km. x 2 Km. terrain areas keeping the pause time constant as 0 s. The details of general simulation parameter are depicted in Table 1.
Table I. Simulation Parameter Values
S.No. Parameters Values
13. Radio propagation method
Two Ray Ground
VII. RESULTANDANALYSIS
The investigations are performed on Parameters such as Packet Delivery Fraction, End-to-End Delay, Average Throughput, NRL and Packet loss%. The experimental data are shown in Tables 2, 3, 4, 5 and 6 respectively and their
respective performance being shown in Figure 3, 4, 5, 6 and 7 respectively.
a. When nodes= 100, Constant Pause Time= 0 s, Maximum Speed= 10-60 m/s (Interval of 10 m/s), Routing protocol= DSR, and Finding Metrics= Packet Delivery Fraction
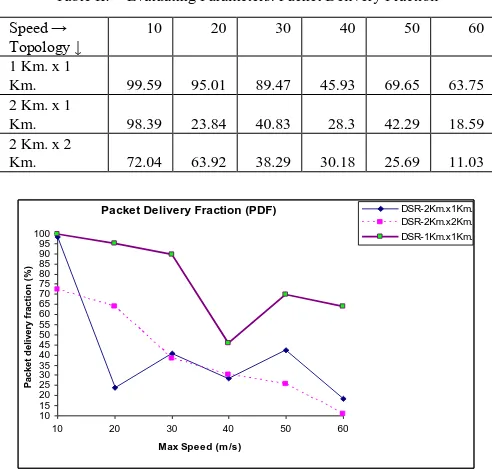
Table II. Evaluating Parameters: Packet Delivery Fraction
Speed →
Figure 3. Maximum Speed versus packet delivery fraction when terrain areas are 1 Km. x 1 Km., 2 Km. x 1 Km. and 2 Km. x 2 Km.
Using the DSR routing Protocol with 100 nodes, Pause Time 0 s, varying maximum Speed (10-60 m/s by interval of 10 m/s) and 1 Km. x 1 Km., 2 Km. x 1 Km. and 2 Km. x 2 Km. terrain areas, we examine that Packet Delivery Fraction in 1 Km. x 1 Km. is more optimal than 2 Km. x 1 Km. and 2 Km. x 2 Km.. So if we implement wireless sensors in biggest terrain areas, the packet delivery fraction is decreased on varying speed with keeping constant pause time. We can derive a formula according to simulation results as:
Packet Delivery Fraction α 1/Terrain Areas
b. When nodes= 100, Pause Time= 0 s, Maximum Speed= 10-60 m/s (Interval of 10 m/s), Routing protocol= DSR, and Finding Metrics= Average End-to-End Delay
Table III. Evaluating Parameters: Average End-to-End Delay
Average End-End delay
Figure 4. Maximum Speed versus Average End-to-End Delay when terrain areas are 1 Km. x 1 Km., 2 Km. x 1 Km. and 2 Km. x 2 Km.
Using the DSR routing Protocol with 100 nodes, Pause Time 0 s, varying maximum Speed (10-60 m/s by interval of 10 m/s) and 1 Km. x 1 Km., 2 Km. x 1 Km. and 2 Km. x 2 Km. terrain areas, we examine that Average End-to-End Delay in 2 Km. x 2 Km. is more optimal than 2 Km. x 1 Km. and 1 Km. x 1 Km.. So if we implement wireless sensors in biggest terrain areas, the Average End-to-End Delay is increased on varying speed with keeping constant pause time. We can derive a formula according to simulation results as:
Average End-to-End Delay α Terrain Areas
c. When nodes= 100, Pause Time= 0 s, Maximum Speed= 10-60 m/s (Interval of 10 m/s), Routing protocol= DSR, and Finding Metrics= Average Throughput (kbps).
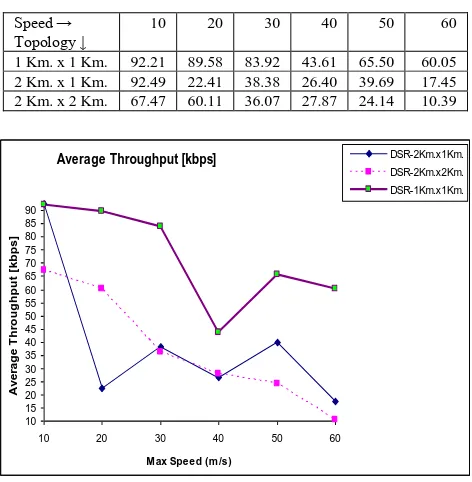
Table IV. Evaluating Parameters: Average Throughput (kbps)
Speed →
Figure 5. Maximum Speed versus Average Throughput when terrain areas are 1 Km. x 1 Km., 2 Km. x 1 Km. and 2 Km. x 2 Km.
Using the DSR routing Protocol with 100 nodes, Pause Time 0 s, varying maximum Speed (10-60 m/s by interval of 10 m/s) and 1 Km. x 1 Km., 2 Km. x 1 Km. and 2 Km. x 2 Km. terrain areas, we examine that Average Throughput in 1 Km. x 1 Km. is more optimal than 2 Km. x 1 Km. and 2 Km. x 2 Km.. So if we implement wireless sensors in biggest terrain areas, the Average Throughput is decreased on
varying speed with keeping constant pause time. We can derive a formula according to simulation results as:
Average Throughput α 1/Terrain Areas
d. When nodes= 100, Pause Time= 0 s, Maximum Speed= 10-60 m/s (Interval of 10 m/s), Routing protocol= DSR, and Finding Metrics= Normalized Routing Load.
Table V. Evaluating Parameters: Normalized Routing Load
Speed →
Figure 6. Maximum Speed versus Normalized Routing Load when terrain areas are 1 Km. x 1 Km., 2 Km. x 1 Km. and 2 Km. x 2 Km.
Using the DSR routing Protocol with 100 nodes, Pause Time 0 s, varying maximum Speed (10-60 m/s by interval of 10 m/s) and 1 Km. x 1 Km., 2 Km. x 1 Km. and 2 Km. x 2 Km. terrain areas, we examine that Normalized Routing Load in 2 Km. x 2 Km. is more optimal than 2 Km. x 1 Km. and 1 Km. x 1 Km.. So if we implement wireless sensors in biggest terrain areas, the Normalized Routing Load is increased on varying speed with keeping constant pause time. We can derive a formula according to simulation results as:
Normalized Routing Load α Terrain Areas
e. When nodes= 100, Pause Time= 0 s, Maximum Speed= 10-60 m/s (Interval of 10 m/s), Routing protocol= DSR, and Finding Metrics= Packet Loss%.
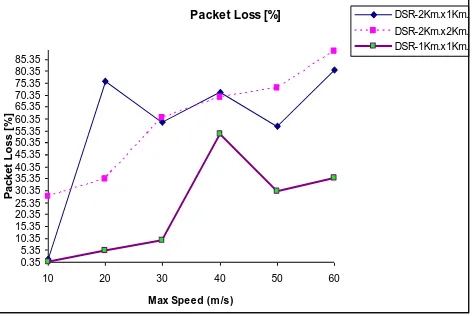
Table VI. Evaluating Parameters: Packet Loss%
Packet Loss [%]
Figure 7. Maximum Speed versus packet Loss% when terrain areas are 1 Km. x 1 Km., 2 Km. x 1 Km. and 2 Km. x 2 Km.
Using the DSR routing Protocol with 100 nodes, Pause Time 0 s, varying maximum Speed (10-60 m/s by interval of 10 m/s) and 1 Km. x 1 Km., 2 Km. x 1 Km. and 2 Km. x 2 Km. terrain areas, we examine that packet Loss% in 2 Km. x 2 Km. is more optimal than 2 Km. x 1 Km. and 1 Km. x 1 Km.. So if we implement wireless sensors in biggest terrain areas, the packet Loss% is increased on varying speed with keeping constant pause time. We can design a formula according to simulation results as:
Packet Loss% α Terrain Areas
VIII. CONCLUSION
The results of our simulations are analyzed and discussed in different terrain areas having networks of 100 sensor nodes on varying maximum speed (10-60m/s with interval of 10m/s) for evaluating performance of different parameters like Packet Delivery Fraction, End-to-End Delay, Average Throughput, NRL and Packet loss% in small, large and very large terrain areas.
Our study provides an optimal result which is fully based on simulation and analysis. Every case explains evaluation of parameter with the help of table and generated graph. Each case represents a special issue for metrics and Terrain areas (which is small (1 Km. x 1 Km.), large (2 Km. x 1 Km.) and very large (2 Km. x 2 Km.)). According to the analysis value we drive a formula for each case that fully satisfies the values and relationship between parameters and terrain areas.
The overall results says that when we implement sensor nodes in small terrain areas give better performance rather than Large and very large terrain areas.
IX. ACKNOWLEDGEMENT
The authors are thankful to the Department of Electronics and Communication, Bhagwant University, Ajmer, and BIT, Bhagwantpuram, Muzaffarnagar UP, India for providing research facilities and their faculty for being the constant source of inspiration. The authors would like to thank Jagan Nath Gupta Institute of Engineering and Technology for his valuable support during the preparation of this paper.
X. REFERENCE
[1] David B. Johnson and David A. Maltz., “Dynamic source routing in adhoc wireless networks”, Mobile Computing, Kluwer Academic Publishers 1996, pp.153–181, 1996.
[2] J.M. van Dam,” An Adaptive Energy-Efficient MAC Protocol for Wireless Sensor Networks”, parallel distributed system, June, 2003.
[3] V. Rohit, “Application Of Wireless Sensor Networks for Environmental Monitoring & Development of an Energy Efficient Hierarchical Cluster based Routing,” Department Of Electrical Engineering, National Institute Of Technology, Rourkela, 2008-2009.
[4] Bikash Rath,”Implementing and comparing DSR and DSDV Routing Protocols for Mobile Adhoc Networking, National Institute of Technology Rourkela 2009.
[5] Gnuplot download and tutorial, http://gnuplot.sourceforge.net/.
[6] David B. Johnson David A. Maltz Josh Broch,” DSR: The Dynamic Source Routing Protocol for Multi-Hop Wireless Adhoc Networks”, Carnegie Mellon University Pittsburgh, PA 15213-3891 http://www.monarch.cs.cmu.edu/.
[7] NS2_Srividhya, NS-2 an Overview.
[8] The ns Manual, the VINT Project, Kevin Fall, Kannan Varadhan, May 9, 2010
[9] Imad Aad, Mohammad Hossein Manshaei, and JeanPierre Hubaux, “ns2 for the impatient”, EPFL Lausanne, Switzerland, March, 2009
[10] Chris Townsend, Steven Arms MicroStrain,” Wireless Sensor Networks: Principles and Applications”, WilsonChapter22.indd 443.
[11] Satya Ranjan Rath,” Study Of Performance Of Routing Protocols for Mobile Adhoc Networking In Ns-2” National Institute of Technology Rourkela 2009.
[12] Ian F. Akyildizy Mehmet C. Vurany O¨ zgu¨ r B. Akanz Weilian Su,” Wireless Sensor Networks: A Survey Revisited”, Computer Networks Journal (Elsevier Science),
[13] Siti Rahayu, Abdul Aziz, Nor Adora Endut, Shapina Abdullahand Mior Norazman Mior Daud” Performance Evaluation of AODV, DSR
and Dymo Routing Protocol in
Manet,”Conferenceonscientific&Socialresearch, Cssr 08’09, 14-15 March 2009
[14] Asar Ali Zeeshan Akbar,” Evaluation of AODV and DSR Routing Protocols of Wireless Sensor Networks for Monitoring Applications”, Master’s Degree Thesis, Karlskrona October 2009
[15] W. Heinzelman, J. Kulik, and H. Balakrishnan, "Adaptive Protocols for Information Dissemination in Wireless Sensor Networks," Proc. 5th ACM/IEEE Mobicom Conference (MobiCom '99), Seattle, WA, August, 1999. pp. 174-85.
Short Bio Data for the Author
Vijay Mohan Shrimal S/o Mr. Mohan Lal
years Academic/Research experience. He is a Member of Computer Science of Teachers Association Collaborate with Association of Computing Machinery, International Association of Computer science and Information technology and International Association of Engineers. He has guided several projects in B. Tech. He had published national and International papers in India and abroad.
Ravindra Prakash Gupta S/o Mr. S.P. Gupta was
born on 27-10-1973. He completed his B. Tech Degree in Electronics and Communication Engineering from Marathwada University, Aurangabad in year 1998 and Master Degree in Electronic and Communication from Malviya National Institute of Technology, Jaipur, India in year 2004. Presently, he is a research scholar of Bhagwant University, Ajmer, India and working as Associate Professor in Electronic and Communication Department at Jaipur National University, Jaipur. His area of interests includes Signal Processing, Digital Communication, Wireless Communication, Wireless Sensor Networks and Design of Computer Network. He has more than 13 years Academic/Research experience. He has worked with the prestigious Military College of Telecommunication Engineering, Mhow, Indore, India. He is a Life-Member of Indian Society of Technical Education (ISTE), New Delhi and The Institution of Electronics and Telecommunication Engineers (IETE), New Delhi. He is Member of International Association of Engineers (IAENG), Computer
Science Teachers Association (CSTA). He has guided several projects and dissertations in B. Tech and M. Tech courses. He had published numerous International papers in India and abroad.
Virendra Kumar Sharma S/o of Shri Jitendra
![Figure 2. Route Reply Message [6]](https://thumb-us.123doks.com/thumbv2/123dok_us/705170.1078576/2.595.57.253.647.751/figure-route-reply-message.webp)