Volume 3, No. 1, Jan-Feb 2012
International Journal of Advanced Research in Computer Science
REVIEW ARTICLE
Available Online at www.ijarcs.info
ISSN No. 0976-5697
A survey of
feature selection models for classification
B. Kalpana*
Ph.d Research scholar, Bharathiar university & A.P,Department of computer science & Applns., PSG College of arts and science, Coimbatore, India
Dr V. Saravanan
Professor & Director Dr. NGP Institute of Technology Kalapatti Road, Coimbatore, India
[email protected] irrelevant or redundant attributes. This increases the processing time. The data set, selected for classification should contain the right attributes for accurate results. Feature selection is an essential data processing step, prior to applying a learning algorithm. Here we discuss some basic feature selection models and evaluation function. Experimental results are compared for individual datasets with filter and wrapper model.
Keywords:Data mining , feature selection , filter model, wrapper model, classification
I. FEATURE SELECTION
There are many potential benefits of variable and feature selection facilitating data visualization and data understanding, reducing the dimensions and storage requirements, reducing training and utilization times, defying the curse of dimensionality to improve prediction performance[1] . Even if resources are not an issue, we want to remove unneeded columns because they might degrade the quality of discovered patterns, for the following reasons:
a) Some columns are noisy or redundant. This noise makes it more difficult to discover meaningful patterns from the data;
b) To discover quality patterns, most data mining algorithms require much larger training data set on high-dimensional data set. But the training data is very small in some data mining applications.[2] Let Y be the original set of features, with cardinality n. Let d represent the desired number of features in the selected subset X, X Í Y. Let the feature selection criterion function criterion function makes feature selection dependent on the specific classifier used and the size of the training and test data sets. Formally, the problem of feature selection is to find a subset X Y such that |X| = d and
Feature selection is mainly based on relevance. John, Kohavi and Pfleger[3] define two notations of relevance
a. Weak Relevance: An attribute xi is weakly relevant if
not strongly relevant and there exists a subset of
variables V such that the performance on V [ {xi} is
better than the performance on V .
b. Strong Relevance: An attribute xi is strongly relevant
if its removal yields a deterioration of the performance of the Bayes Optimum Classifier.
II. GENERAL CHARACTERISTICS OF FEATURE SELECTION
a. The starting point of a feature space: Here initially the dataset has no dimensions and by forward search the dimensions are added. This is called Forward selection. Alternatively, initially the database may contain n dimensions and we can reduce dimensions by backward selection.
b. The search strategy: A complete search can be exhaustive by searching all 2n combinations or finding a minimum set which acts as a optimal set using branch and bound[14] or beam search can be employed. A sequential strategy is based on hill climbing approach which can sequential forward selection, sequential backward elimination, and bidirectional elimination. A random search starts with random subsets and further search is done by sequential strategy or generate next subset in a random manner.
c. The evaluation criteria: This can be dependency, distance measure, information gain, probability measure with which the search is steered forward.
d. Stopping criteria: We can stop the search if there is no distinction between previous subset space and currently chosen one or desired no iterations or dimensions has been reached or we reached a good feature subset.
III. AVAILABLE MODELS FOR FEATURE SELECTION
evaluate the worth of features using the learning algorithm that is to ultimately be applied to the data, and those which evaluate the worth of features by using heuristics based on general characteristics of the data. The former are referred to as wrappers and the latter filters [8],[9].There are three models available for feature selection.
A. Filter model:
This utilizes an independent search criterion to find the appropriate feature subset before a machine learning algorithm is performed, thus it was termed as filter method
by John, Kohavi and Pfleger. The advantage of this algorithm is, it need not run the induction algorithm every time an attribute is tested for relevancy. The algorithm shows high time efficiency. The disadvantage is that it totally ignores the effects of selected feature subset on the performance of the induction algorithm.
The generalized filter model algorithm is given [10]
Figure: 1 Feature selection using filter model
B. Wrapper model:
Figure 2: Wrapper model of feature selection Wrapper algorithm as given in [12]
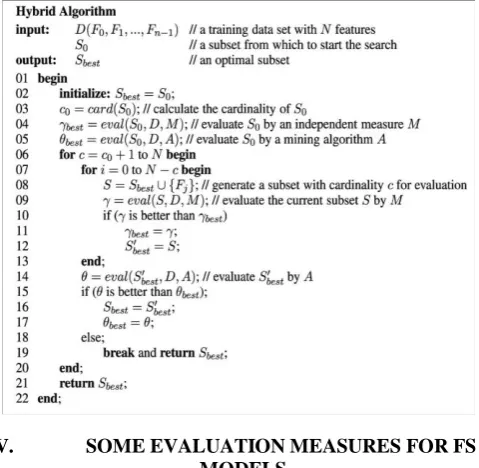
C. Hybrid model:
The hybrid model does not have a prespecified stopping criterion. A typical hybrid method makes use of both an independent measure and and a mining algorithm to select the final best subset among the best subsets across different cardinalities. With an initial empty subset S0 the algorithm
tries to add a new subset in each iteration. The current subset with cardinality c,is incremented by searching the subset space c+1 and a new subset S is formed. It is evaluated by an independent measure M and compared with previous best .If S is best it becomes current best subset at level and becomes S‘best
Figure 3. Feature
At the end of each iteration a mining algorithm A, is applied to s‘best and the result ө, of the mining algorithm is
compared with the result of best subset at level c. If s‘best is
better, the algorithm tries to find the best subset for next
IV. SOME EVALUATION MEASURES FOR FS MODELS.
Within filter and wrapper categories, algorithms can be further differentiated by the exact nature of their evaluation function, and by how the space of feature subsets is explored. Filter algorithms can be performed on univariate or multivariate attributes. Wrapper algorithms mainly depend on consistency and dependency measures. General measures of evaluation criteria are discussed below.
A. Chi-square test: Chi-Square (χ2): based on the
statistical theory. It measures the lack of independence between the terms in the category as shown in the equation
The primary advantage of the chi square goodness of fit test is that it is quite general. It can be applied for any distribution, either discrete or continuous, for which the cumulative distribution function can be computed[5]. There are two primary disadvantages:
a. The test is sensitive to how the binning of the data is performed.
b. It requires sufficient sample size so that the minimum expected frequency is five.
B. Euclidian Distance: Euclidean distance d, between features Xi and Yi is calculated using the formula
C. T test: The t-test assesses whether the means of two groups are statistically different from each other. This helps to find how far two groups deviate from each other T test =
D. Information gain : The information gain of a given attribute X with respect to the class attribute Y is the reduction in uncertainty about the value of Y when we know the value of X, I(Y ;X). Entropy is a measure of how "mixed up" an attribute is. It is sometimes equated to the purity or impurity of a variable.
E. E.Correlation based computation – A dependency
measure: The search evaluator aims to find the subsets
of features that are individually highly correlated with the class but have low inter-correlation. The subset evaluators use a numeric measure, such as conditional entropy, to guide the search iteratively and add features that have the highest correlation with the class. The downside of univariate filters for e.g information gain is, it does not account for interactions between features, which is overcome by multivariate filters for e.g CFS. CFS evaluates the worth of a subset of attributes by considering the individual predictive ability of each feature along with the degree of redundancy between them. Correlation coefficients is used to estimate correlation between subset of attributes and class, as well as inter-correlations between the features. Relevance of a group of features grows with the correlation between features and classes, and decreases with growing inter-correlation. CFS is used to determine the best feature subset and is usually combined with search strategies such as forward selection, backward elimination, bi-directional search, best-first search and genetic search. Correlation is given by[7]
F. F. Consistency measure: This unlike all mathematical
measure rely heavily on class information and depend on Min-Feature bias in selecting the subset. These measures attempt to find a minimum number of features that separate classes as consistently as the full set of features can. An inconsistency is defined as two instances having the same feature values but different class labels[12]
V. EXPERIMENTS AND RESULT
Fourteen standard datasets drawn from the UCI collection were used in the experiments .These datasets were chosed because of nominal class features. The number of instances, attributes and number of classes vary in the chosen dataset to represent different combinations. The learning algorithm chosen for classifying are Naïve Bayes, K-NN(k=10) and C4.5 tree. All datasets were run on Pentium machine with Java 6 and 3 GB RAM.The results in table.b shows that C4.5 performs well in most cases. Naïve Bayes is a true predictor. So the poor performance even though time taken by Naïve Bayes and C4.5 were very small compared to KNN. KNN algorithm had k=10 and has an overall average good performance on all types of datasets. Results in bold indicate the best performance for a dataset between the three chosen algorithm.
Table 1: Datasets taken for study
Dataset Instances Attributes No. of classes
Weather 14 5 2
Zoo 101 18 7
The performance of the correlation based feature subset filter model with correlation subset as evaluator is shown in table 3. The figures are marked for percent correct with 10 fold cross validation. A ‗–‘ in table c indicates feature selection does have a negative performance on the dataset.
Table 2: Percent correct-without attribute selection and 10 fold cross validation
segment-challenge 80.17 96.79 95.25
Soybean 92.94 91.78 90.12 correlation based subset evaluation for anneal, contact-lens, iris, soybean and ranker search with information gain as evaluation criteria for splice, letter, lymph, vowel, vehicle, waveform and zoo.
Table 3: Filter method implemented on datasets
Dataset Naive Bayes C4.5 KNN classification result. KNN with wrapper approach shows a huge deviation from original results as shown in table 4.
Table 4: Wrapper method on datasets with 10 fold CV
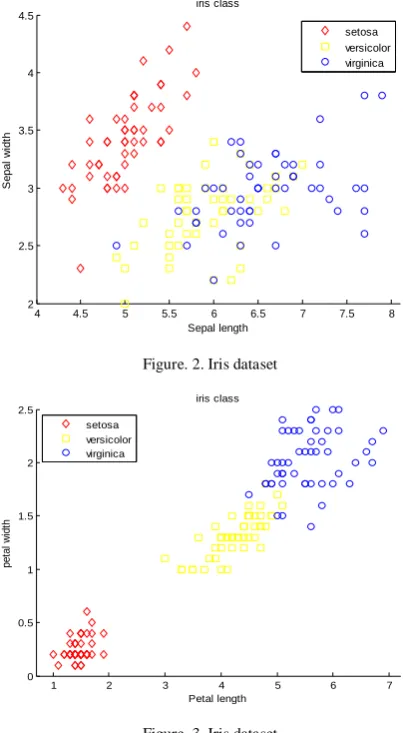
Dataset Naive Bayes C4.5 KNN classified and results shown. The classification based on sepal length and sepal width is shown in fig a. The same classification based on petal length and petal width are shown in fig 2
Figure 1. Wrapper selection time in sec between three datasets
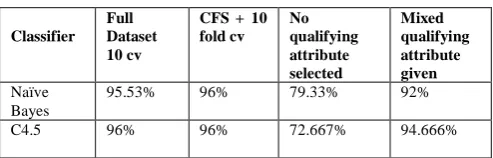
From the figure b we can find that only petal width and petal length are prime attributes that can be used for classification. Table 5 shows the results recorded using Naïve Bayes classification and c4.5 on iris data set. The figures shows the number of correctly classified instance in each category. NaiveBayes being a probabilistic classifier has the ability to classify with an increase about 6.7% correct classifica. When either petal length or petal width is available C4.5 performs a good classification
Table 5. iris dataset Naïve Bayes with correlation based feature selection and 10 fold cross validation.
Table 6. Soybean dataset
Classifier Full Dataset CFS+ 10 fold cv
Naïve Bayes 92.94% 92.5329 classification with filter and wrapper based feature selection models. We propose to combine these two models to produce a genetic approach to feature selection that classifies more accurately with minimum number of attributes.
VII. REFERENCES
[1]. I.Guyon, Andr´e Elisseeff.‖An Introduction to Variable and Feature Selection‖, Journal of Machine Learning Research 3 (2003) pp. 1157-1182
[2]. http://msdn.microsoft.com/en-us/library/ms175382.aspx [3]. G.H. John, R. Kohavi, and K. Pfleger. Irrelevant features and
the subset selection problem.In Proceedings of the Eleventh International Conference on Machine learning, pages 121– 129,New Brunswick, NJ, 1994. Morgan Kaufmann
[4]. P. Saengsiri, P. Meesad, S. Na Wichian and U. Herwig, ―Comparison of Hybrid Feature Selection Models on Gene Expression Data,‖ IEEE International Conference on ICT and Knowledge Engineering, 2010, pp.13 -18
[5]. http://www.itl.nist.gov/div898/software/dataplot/refman1/aux illar/chsqgood.htm
[6]. A.Jain, D Zongker,‖ Feature selection: evaluation, application, and small sample performance”, IEEE transactions on pattern analysis and machine intelligence, vol. 19, no. 2,1997
[7]. A.Gowda karegowda1, A.S.Manjunath, M.A.Jayaram,‖ comparative study of attribute selection using gain ratio and correlation based feature selection‖, Vol 2,Dec,2010
[8]. R. Kohavi. ―Wrappers for Performance Enhancement and Oblivious Decision Graphs‖, PhD thesis, Stanford University, 1995.
[9]. R. Kohavi and G. John. ―Wrappers for feature subset selection‖. Artificial Intelligence, special issue on relevance, 97(1–2):273–324, 1996.
[10]. H.Liu, L.Yu,‖Toward Integrating Feature Selection Algorithms for Classification and Clustering‖, IEEE Transactions on knowledge and data engineering, vol. 17, no. 4, April 2005. Artificial Intelligence, vol. 69, nos. 1-2, pp. 279-305, 1994 [13]. P.M. Narendra and K. Fukunaga, ―A Branch and Bound
Algorithm for Feature Subset Selection,‖ IEEE Trans. Computer, vol. 26, no. 9, pp. 917-922, Sept. 1977
![Figure 2: Wrapper model of feature selection Wrapper algorithm as given in [12]](https://thumb-us.123doks.com/thumbv2/123dok_us/704321.1078447/3.595.85.503.505.713/figure-wrapper-model-feature-selection-wrapper-algorithm-given.webp)