Volume 3, No. 2, March-April 2012
International Journal of Advanced Research in Computer Science
RESEARCH PAPER
Available Online at www.ijarcs.info
ISSN No. 0976-5697
An Uncertain Decision Making Model: An Application to AHP
Chao Wang* College of Science
Guilin University of Technology (GLUT) Guilin, 541004, China
Liang Lin College of Science
Guilin University of Technology (GLUT) Guilin, 541004, China
[email protected] Shuai Wu
College of Science
Guilin University of Technology (GLUT) Guilin, 541004, China
Abstract: This paper introduces uncertainty theory to deal with uncertain factors in decision making problems. The uncertain variable method (UVM) for generation weight vector, the definition of uncertain consistency and consistency theorem are proposed. An algorithm for checking whether or not an uncertainty comparison matrix is consistent is put forward. The final raking is indicated by uncertainty weight vector if it is acceptable; otherwise we rely on the ranks of expected weight vector instead. Three numerical examples are examined to illustrate the validity and practicality of the proposed method.
Keywords: uncertainty theory; uncertain variable; uncertain measure; uncertainty distribution; uncertain variable method; AHP
I. INTRODUCTION
The Analytic Hierarchy Process (AHP) is a decision making technique founded by Saaty (1977, 1980), that integrates pairwise comparison ratios into a ratio scale. The reciprocal ratio scale which is used by experts to provide their subjective opinion concerning each pair of stimuli considered. However, in practical application, non-deterministic factors appear in AHP, which leads to new situations. Such as what is the ratio criterion 1 over criterion 2, whether or not it is 2 or 3 cannot be provided exactly by expert. If the each element is non-deterministic, the consistency of comparison matrices cannot be checked and ranks of alternatives cannot be obtained, either.
This problem was first investigated by Vargas (1982). He considered such imprecise judgments as uncertainty in the stochastic or statistical context where the judgment ratio
ij
r
was viewed as a random variable. Subsequently, a number of techniques have been developed to use such a fuzzy or interval comparison matrix to generate weights. More details can be obtained in works [1-8].Unfortunately, it is not suitable to regard every non-deterministic phenomenon as random phenomenon, especially when the uncertain phenomenon is caused by subjective judgment. In some works, fuzzy parameters are assumed to have known membership functions and credibility distributions. However, Atanu Sengupta and Tapan Kumar Pal [7] considered that in real-world to a decision maker (DM) it is difficult to specify the membership function or probability distribution in an ambiguous environment.
As is well known, the non-deterministic phenomenon above is caused by subjective judgment. Let us name it “uncertainty”. In order to deal with these uncertainties, Liu [9] proposed uncertainty theory and refined it in 2010 [10]. This provides a motivation to introduce uncertainty theory into AHP.
In this paper, uncertain variable instead of precise ratio is used to represent human judgments. Then uncertain measure is used to indicate the belief degree of an uncertain event. Subsequently uncertainty distribution is used to describe uncertain variables in an incomplete but easy-to-use way. Based on uncertainty comparison matrix, weights are derived by using inverse uncertainty distribution and ranking with uncertain measure α0 is obtained. Finally, consistency of matrices is tested and the inconsistent matrices are modified by expert. After that the reliable weights can be obtained. We call this decision problem model uncertain AHP when uncertain variable is brought in. This paper is focused only on the generating uncertainty weights and consistency check.
II. UNCERTAINVARIABLEMETHOD(UVM)
Uncertainty theory has become a branch of mathematics based on normality, self-duality, countable subadditivity, and product measure axioms. It is well developed in different fields. To explore the recent developments of uncertainty theory, readers may consult Liu [10]. In order to determine the uncertain AHP, we give the following fundamental concepts.
We consider treating elements in a comparison matrix as uncertain variables having uncertainty distributions. Then we get the definition of uncertainty comparison matrix.
Definition 2.1 Let
A
be an uncertainty comparisonmatrix of order
n
, whose entries are uncertaintydistributions Φij
(
i=1, 2,,n−1;j= +i 1,n)
ofuncertain variables
ξ
ij(
i=1, 2,,n−1;j= +i 1,n)
representing the ratios criterion
i
over criterionj
, then the uncertainty comparison matrix is denoted by
12 1
2
1
1
.
1
n
n
Φ Φ
Φ =
A
(1)
The lower triangular uncertainty ratios can be obtained by
( )
( )
(
)
1
1
1
1, 2, , 1; 1, , ,
ji
ij
i n j i n
α
α
−−
Φ = = − = +
Φ (2)
where
α
is the uncertain measure (confidence level) with[ ]
0,1α∈ .
As we know the pairwise comparison ratios are supplied by decision maker in the conventional-AHP. Here in this paper, uncertain variable (Liu [9])
ξ
ij can be obtained byDelphi method and has a linear uncertainty distribution (Liu [9]). The consultation process is as follows:
Q1: What do you think is the minimum ratio criterion i
over criterion j?
A1:
a
. (an expert’s experimental data( )
a
, 0
is acquired) Q2: What do you think is the maximum ratio criterion iover criterion j?
A2:
b
. (an expert’s experimental data( )
b
,1
is acquired) Where( ) ( )
a
, 0 ,
b
,1
represents Φ( )
a =M{
ξ
ij ≤a}
0,
= Φ
( )
b =M{
ξ
ij ≤b}
=1 , respectively. So the uncertainty ratioξ
ij has an linear uncertainty distribution( )
,ij a b
L .
Crawford and Williams [11] suggested for the Row Geometric Mean Method (RGMM), where the priorities (without the normalization factor) are given by
1
1
1, 2, , ,
n n
i ij
j
w a i n
=
=
=
∏
(3)where wi is the priority of the
i
th
attribute. Liu [12] proposed the concept of strictly increasing function of uncertain variables. A real-valued function(
1,
2,
,
n)
f x x
x
is said to be strictly increasing if(
1,
2,
,
n)
(
1,
2,
,
n)
f x x
x
≤
f y y
y
whenever xi ≤ yi for i=1, 2,,n, and
(
1,
2,
,
n)
(
1,
2,
,
n)
f x x
x
<
f y y
y
whenever xi < yi for i=1, 2,,n. Eq. (3) can be expressed as
(
)
1
1 2
1
, , , , 0
n n
n j j
j
f x x x x x
=
=
>
∏
then f is a strictly increasing function.
Proof
Apparently,
(
)
(
)
1
1 1 2
1 1
1
1
, , ,
,
n
n n
n
n j j
j j
n
n
j j j
j
f x x x x x
y y x
= =
=
= =
= =
∏
∏
∏
where
( )
1
n
j j
j
g y y
=
=
∏
is a strictly increasing function and( )
1nj j
h x =x is a strictly increasing function, so the composite function f is a strictly increasing function of uncertain variables x x1, 2,,xn. The proof is finished.
In order to derive the weights from the uncertainty comparison matrices, the inverse uncertainty distributions
are used. The reason is that 1
( )
α
0 −Φ is a precise number. Here we introduce a theorem proposed by Liu.
Theorem 2.1 (Liu [10]) Let ξ ξ1, 2,,ξn be
independent uncertain variables with regular uncertainty distribution Φ Φ1, 2,,Φn , respectively. If f is a strictly increasing function, then
(
1,
2,
,
n)
f
ξ
=
ξ ξ
ξ
is an uncertain variable with inverse uncertainty distribution
( )
(
( )
( )
( )
)
1 1 1 1
1 , 2 , , n .
f
α
α
α
α
− − − −
Ψ = Φ Φ Φ
By the Theorem 2.1, it is clear that
(
1,
2,
,
)
i i i in
w
=
f
ξ ξ
ξ
is an uncertain variable withinverse uncertainty distribution
( )
( )
1 1
1 1
1 1
n n
n n
i ij ij i
j j
w
α
α
ξ
− −
= =
Φ =
Φ
=
where
α
∈
[ ]
0,1
is the uncertain measure (Liu [9]). wiis defined as uncertainty weight of the
i
th
attribute. For all i=1, 2,,n , the uncertainty weight vector(
1, 2, , n)
w= w w w is obtained. The uncertainty weight vector is acceptable when the ranking order does not alter if
0.5
α
≥
. Otherwise experts will be required to supply new judgments. Without any modification or new information, we rely on the ranks of expected values of uncertainty weights instead. Liu and Ha [12] give the expected value[ ]
E ξ of monotone function of uncertain variables
[ ]
1 1( )
10 1
,
n n
i ij
j
E
ξ
−α
dα
w=
=
Φ
=
∏
∫
(5)which is a precise number showing expected value of uncertain variable wi (priority of
i
th
attribute) in formula (4). However, only the numerical solution of the expected value could be calculated by computer. Finally theexpected weight vector w=
(
w w1, 2,,wn)
is obtained.The uncertainty weight
w
i is changed along with different uncertain measures. A certain group of weights will be used to check consistency of uncertainty comparison matrix and indicate the ranking if uncertainty weight vector is unacceptable. The expected value of weight plays an important role here.III. CONSISTENCYTESTANDRANKSOFWEIGHTS
As is well known, only comparison matrices passing the test of satisfactory consistency can be used to derive reliable weights. We must check the consistency of comparison matrices in the process of generation weights. Since the complexity and uncertainty of real-world decision analysis problems and the subjectivity of expert judgments, it is inevitable to generate inconsistent comparisons. In previous works, the definition of fuzzy consistency [4] and consistency of interval comparison matrix [13] were proposed. In this paper, the definition of uncertain consistency and a theorem for identification of consistency are given.
Definition 3.1 Let
A
is an uncertainty comparisonmatrix defined by (1) with Φ−ij1
( )
0 ≤ξ
ij ≤ Φij−1( )
1 and( )
( )
1 1
0 1 1
ii ii ii
ξ
= Φ− = Φ− =for i j, =1, 2,,n . If the convex feasible region
(
)
1( )
1( )
1 2
1
{ , , , 0 1 ,
1, 0, 1, 2, , }
w n ij i j ij
n
i j
i
S w w w w w w
w w j n
− −
=
= = Φ ≤ ≤ Φ
= > =
∑
is nonempty, then
A
is considered to be a consistent uncertainty comparison matrix.Theorem 3.1
A
is a consistent uncertaintycomparison matrix if and only if it satisfies the following inequality constraints:
( )
( )
(
1 1)
(
1( )
1( )
)
max Φik− 0 ⋅ Φkj− 0 ≤min Φik− 1 ⋅ Φ−kj 1 .
for all k =1, 2,,n.
(6)
Proof
If
A
is a consistent uncertainty comparison matrix, it means the convex feasible regsion Sw is nonempty and there is no contradiction among the following inequalityconstraints:
( )
( )
1 1
0 1 , 1, 2, , ,
ik w wi k ik i k n
− −
Φ ≤ ≤ Φ = (7)
( )
( )
1 1
0 1 , 1, 2, , .
kj wk wj kj k j n
− −
Φ ≤ ≤ Φ = (8)
Multiplying (7) by (8) leads to the following inequalities
( )
( )
( )
( )
1 1 1 1
0 0 1 1 , , , 1, 2, , .
ik kj ik kj i j k n
− − − −
Φ ⋅ Φ ≤ Φ ⋅ Φ =
(9) Since (9) holds for any k =1, 2,,n, it follows that
( )
( )
(
1 1)
(
1( )
1( )
)
max Φik− 0 ⋅ Φkj− 0 ≤min Φik− 1 ⋅ Φkj− 1 holds for all i j k, , =1, 2,,n.
Conversely, if (6) holds for all i j k, , , then
( )
( )
1 1
0 1
ij w wi j ij
− −
Φ ≤ ≤ Φ holds for any
, 1, 2, ,
i j= n . So, Sw is nonempty and
A
is a consistent uncertainty comparison matrix in the sense of Definition 3.1.Certainly, the definition of consistency test for uncertainty comparison matrices can be used to check the consistency. It is clear that it computes inefficiently when the matrix order is large. Here we introduce an algorithm enlightened by R. Islam et al. [14],
(
)
1
1 1
n n
ij ij
i j i
a p p
− = = +
′
=
∑ ∑
+(10)
subject to
( )
( )
1
1
0 0,
1 0,
1, 2, , 1; 1, , ,
i ij j ij ij
i ij j ij ij
w w n p
w w n p
i n j i n
− −
− + Φ + − =
′ ′
− Φ + − =
= − = +
where n pij ij =0,n pij′ ′ij =0,p pij ′ij =0 , and wi
(
i=1, 2,,n)
is the normalized expected weights. There must be a group of weights w ii(
=1, 2,,n)
taken into formula (10). Using the UVM, we consider the expected values of uncertainty weights as the estimations of weights w ii
(
=1, 2,,n)
. Note that w ii(
=1, 2,,n)
are normalized expected values. After that, the ratios
i j
w w for all i and j may or may not belong to the
interval
Φ−ij1( )
0 ,Φ−ij1( )
1
. The pij or pij′ reflects thedeviation w wi j exceeding the set
Φij−1( )
0 ,Φij−1( )
1
. It is clear that the matrix is consistent if and only if0
Because the expected weight vector or uncertainty weight vector (with uncertain measure α0) is an exact priority vector, the ranking is obvious. The whole process introduced for generating uncertainty weights and expected weights from uncertainty comparison matrices is summarized in Figure 1.
Figure 1 Process for generating priorities from uncertainty comparison matrices.
IV. NUMERICALEXAMPLES
In this section, we offer three numerical examples that are solved using the proposed UVM. The linear uncertainty distributions are obtained by Delphi method.
Example 1 Consider the following uncertainty
comparison matrix
( )
( )
( )
( )
( )
(
)
12 13 14
23 24
34
2, 5 2, 4 1, 3
1, 3 1, 2
1 2 ,1 1
1
. 1
1
=
L L L
L L
L
A
As introduced in section 2, the uncertainty weights and expected weights are obtained by formulas (2), (4) and (5). The normalized expected weight vector is
(
0.4514, 0.2134, 0.1388, 0.1963
)
. Using the formula (10),a
=
0
is obtained andA
is consistent uncertainty comparison matrix. Table 1 expresses the weights with different uncertain measures, from which it is clear that criterion 1 is the most important because its weight is greater than weights of all the other criteria holds for[ ]
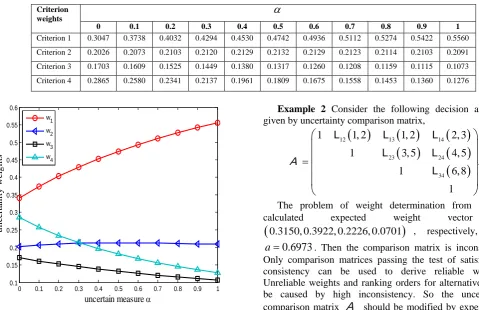
0,1 [image:4.612.54.265.134.284.2]α∈ . To provide a complete ranking order for the four uncertainty weights, a directed diagram is depicted in Figure 2, from which it is quite clear that the ranking order is generated to be w1 >w2 >w4 >w3
(
if α >0.4)
, and the result is acceptable. Our ranking order provides the information about uncertain measure of preference, which reflects uncertain nature of the ranking.Table 1 Uncertainty weights in Example 1
Criterion
weights
α
0 0.1 0.2 0.3 0.4 0.5 0.6 0.7 0.8 0.9 1
Criterion 1 0.3047 0.3738 0.4032 0.4294 0.4530 0.4742 0.4936 0.5112 0.5274 0.5422 0.5560 Criterion 2 0.2026 0.2073 0.2103 0.2120 0.2129 0.2132 0.2129 0.2123 0.2114 0.2103 0.2091
Criterion 3 0.1703 0.1609 0.1525 0.1449 0.1380 0.1317 0.1260 0.1208 0.1159 0.1115 0.1073 Criterion 4 0.2865 0.2580 0.2341 0.2137 0.1961 0.1809 0.1675 0.1558 0.1453 0.1360 0.1276
Figure 2 Preference relations in Example 1
Example 2 Consider the following decision analysis
given by uncertainty comparison matrix,
( )
( )
( )
( )
( )
( )
12 13 14
23 24
34
1, 2 1, 2 2, 3
3, 5 4, 5
6, 1
.
1 8 1
1
=
L L L
L L
L
A
The problem of weight determination from
A
is calculated expected weight vector is(
0.3150, 0.3922, 0.2226, 0.0701)
, respectively, with0.6973
a
=
. Then the comparison matrix is inconsistent. Only comparison matrices passing the test of satisfactory consistency can be used to derive reliable weights. Unreliable weights and ranking orders for alternatives may be caused by high inconsistency. So the uncertainty comparison matrixA
should be modified by expert until it becomes consistent.Acceptable ? Yes
Yes No
Modifying the Judgments Generating uncertainty
weights by UVM
Uncertainty Comparison Matrices
No Consistent ?
Uncertainty Weights Expected Weights
0 0.1 0.2 0.3 0.4 0.5 0.6 0.7 0.8 0.9 1
0.1 0.15 0.2 0.25 0.3 0.35 0.4 0.45 0.5 0.55 0.6
uncertain measure α
unc
e
rt
a
int
y w
e
ight
s
w1
w 2
w 3 w
[image:4.612.52.532.403.713.2]Example 3 The problem is about a government agency’s goal (G) to rank chemicals A1, A2, A3 in terms of their level
of harm to the environment. The goal is affected by three criteria with criterion C1: Air, C2: Water, and C3: Soil, see
[image:5.612.317.558.71.321.2]Figure 3.
Figure 3 Hierarchy Structure in Example 3.
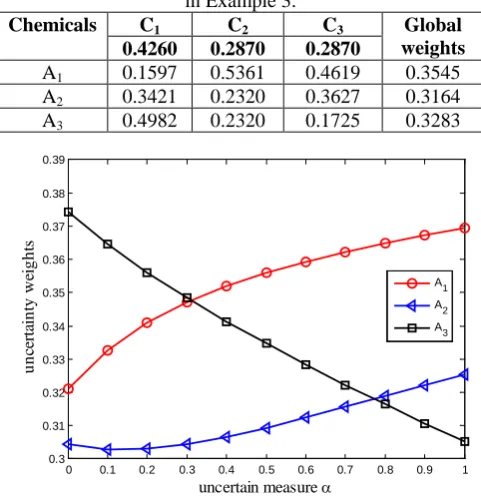
The uncertainty comparison matrices for the three criteria as well and for the three alternatives are summarized in Table 2. Both the local and global expected weights are showed in Table 3, from which our uncertainty comparison matrices all turn out to be consistent. It is can be seen that the expected weights indicate the ranking A1 A3 A2. Based on the consistent matrices, the UVM are used to generate the global uncertainty weights and plotted in Figure 4. It can be seen from Figure 4 that the ranking given by uncertainty weights is unacceptable, because the ranking alters with
α >
0.5
. It is clear that A1 is preferred over A2 and A3, but whether A3 ispreferred over A2 is ambiguous. Perhaps the reason is that the
consistent matrices include contradictory information. M. Kwiesielewicz and E. Van Uden [15] expressed that the consistency test is performed to ensure that judgments are neither random nor illogical. They proposed that even if a matrix will pass a consistency test successfully, it can be contradictory. Maybe the judgments for A3 have been given
carelessly. Without any new information, we take the ranking
1 3 2
A A A given by expected weights as the final ranks of alternatives.
Table 2 Uncertainty comparison matrices in Example 3.
( ) ( )
( )
12 13 23
1, 3 1, 3 1 1
: 1
1 2 , 2
G
L L
L
( ) ( )
( )
1 1
12 3
23
1 4 ,1 2 1 6 ,1 3 1
: 1
1 1 3 ,1
C
L L
L
( ) ( ) ( )
1 2
12 3
23
2, 5 2, 5 1 2 , 2 1
: 1
1
C
L L
L
( ) ( )
( )
12 13 23 3
1 : 1
1, 2 2, 6 2, 1
4
C
L L
L
Table 3 Local expected weights and global expected weights in Example 3.
Chemicals C1 C2 C3 Global
weights
0.4260 0.2870 0.2870
A1 0.1597 0.5361 0.4619 0.3545
A2 0.3421 0.2320 0.3627 0.3164
A3 0.4982 0.2320 0.1725 0.3283
Figure 4 Preference relations in Example 3.
V. CONCLUSION
In order to deal with subjective uncertainty in decision making, this paper introduced uncertainty theory into analytic hierarchy process (AHP). Uncertain variable method (UVM), a new approach to consistency and inconsistency of uncertainty comparison matrices was proposed to generate uncertainty weights. The definition of uncertain consistency and a theorem for identification of consistency were provided and a simple yet pragmatic approach for testing whether or not an uncertainty comparison matrix is consistent was put forward without solving any optimization model. Both the uncertainty weight vector and expected weight vector indicated the ranks of alternatives. We considered the uncertainty weight vector as the final ranking if it was acceptable. Otherwise the ranks of expected weight vector would be adopted. Three numerical examples illustrated the simplicity and wide applicability of the proposed methods. Because interval comparison matrices can be transformed into uncertainty comparison matrices, the proposed method is applicable to interval comparison matrices. We can find that uncertainty comparison matrices with zigzag uncertainty distributions can be applied to the fuzzy comparison matrices with triangular membership functions. Therefore they can be widely used to deal with decision analysis problems.
VI. REFERENCES
[1]. P.J.M. Van Laarhoven, W. Pedrycz, A fuzzy extension of Saaty’s priority theory, Fuzzy Sets and Systems, 11 (1983) 229-241.
[2]. J.J. Buckley, Fuzzy hierarchical analysis, Fuzzy Sets and Systems, 17 (1985) 233-247.
Harm to Environment
Chemical 1 Chemical 2 Chemical 3
Air Water Soil
0 0.1 0.2 0.3 0.4 0.5 0.6 0.7 0.8 0.9 1
0.3 0.31 0.32 0.33 0.34 0.35 0.36 0.37 0.38 0.39
uncertain measure α
unc
er
ta
int
y w
ei
ght
s
A1
A2
[image:5.612.53.268.120.256.2][3]. C.G.E. Bonder, J.G. de Graan, F.A. Lootsma, Multicretia decision analysis with fuzzy pairwise comparisons, Fuzzy Sets and Systems, 29 (1989) 133–143.
[4]. L.C. Leung, D. Cao, On consistency and ranking of alternatives in fuzzy AHP, European Journal of Operational Research, 124 (2000) 102-113.
[5]. T.L. Saaty, L.G. Vargas, Uncertainty and rank order in the analytic hierarchy process, European Journal of Operational Research, 32 (1987) 107-117.
[6]. Ying-Ming Wang, Jian-Bo Yang and Dong-Ling Xu, A two-stage logarithmic goal programming method for generating weights from interval comparison matrices, Fuzzy Sets and Systems, 152 (2005) 475-498.
[7]. Atanu Sengupta, Tapan Kumar Pal, On comparing interval numbers, European Journal of Operational Research, 127 (2000) 28-43.
[8]. J. Barzilai, F.A. Lootsma, Power relation and group aggregation in the multiplicative AHP and SMART. Journal of Multi-Criteria Decision Analysis, 6 (1997) 155-165.
[9]. B. Liu, Uncertainty Theory, 2nd ed., Springer-Verlag, Berlin, 2007.
[10]. B. Liu, Uncertainty Theory: A Branch of Mathematics for Modeling Human Uncertainty, Springer-Verlag, Berlin, 2010.
[11]. G. Crawford, C. Williams, A note on the analysis of subjective judgment matrices. European Journal of Operational Research, 29 (1985) 387-405.
[12]. Y.H. Liu and M.H. Ha, Expected value of function of uncertain variables, Journal of Uncertain Systems, 4 (2010) 181-186, 2010.
[13]. Y.M. Wang, J.B. Yang and D.L. Xu, Interval weight generation approaches based on consistency test and interval comparison matrices, Applied Mathematics and Computation, 167 (2005) 252-273.
[14]. R. Islam, M.P. Biswal and S.S. Alam, Preference programming and inconsistent interval judgments, European Journal of Operational Research, 97 (19973) 53-62.