Volume 8, No. 5, May-June 2017
International Journal of Advanced Research in Computer Science RESEARCH PAPER
Available Online at www.ijarcs.info
ISSN No. 0976-5697
Interval Type-2 Fuzzy Integral Based Iris Recognition
Thiyam Churjit Meetei
Department of Computer Science,Assam University, Silchar, Assam-788011, India
S. A. Begum
Department of Computer Science, Assam University, Silchar,
Assam-788011, India
Abstract:
Keywords: Iris recognition; Match score fusion; Fusion rules; Fuzzy integral; Interval type-2
Most of iris recognition system uses single matcher or classifier for decision making. In this paper, an Interval Type-2 Fuzzy Integral (IT2 FI) is proposed as a new approach to combine the match scores of three classifiers viz. fuzzy k-NN and two backpropagation neural networks with logsig and tansig transfer functions in order to improve the performance as well as robustness of the system. A comparison with other fusion rules viz. the sum rule, max-rule, product-rule and fuzzy integral, is also conducted. From the experimental results, it is observed that the proposed Interval Type-2 Fuzzy Integral based matching score fusion approach outperforms some of the existing fusion methods.
I. INTRODUCTION
Biometrics aims to identify each individual by using various physiological (e.g. fingerprints, face, iris and hand geometry) and/or behavioral characteristics (e.g. gait, voice and signature). Among biometrics modalities, iris is receiving attention as one of the most accurate and reliable biometric for personal identification because of its characteristics like stability over a person’s life, naturally protected, highly complex and distinctive pattern which provides desirable properties of a biometric (i.e., uniqueness, stability, and noninvasiveness) [1- 4].
Biometric can be treated as a pattern recognition problem and many classifiers such as k-NN classifier [5], neural network, SVM [6] etc. can be employed. Employing multiple classifiers can overcome the weaknesses of individual classifiers. By combining the scores of multiple classifiers the final decision becomes more robust [1]. The commonly used score fusion methods include the (weighted) sum rule, max-rule, min-rule, product-rule, median rule, the majority voting [7], the Borda count, the fuzzy integral, fuzzy templates, decision templates [8-9] etc,. Most of the iris recognition systems in literature use single matching or classification method and are prone to limitations.
Some biometric systems were improved using type-1 fuzzy systems [10-11], Sugeno integral [12] etc,. In this paper, Interval Type-2 fuzzy integral is proposed as a score level fusion method in iris recognition. Iris patterns (IrisPattern) are formed by extracting features from iris images. Principal Component Analysis (PCA) and Independent Component Analysis (ICA) are employed to reduce size of IrisPattern and these patterns are then classified by using three classifiers namely fuzzy k-NN and two neural networks with logsig and tansig transfer functions. An Interval Type-2 Fuzzy Integral (IT2 FI) is employed to combine the scores of the classifiers and a comparison with the sum rule, max-rule, product-rule and fuzzy integral is performed.
The remaining of this paper is organized as follows. Section 2 gives an overview of iris recognition stages. The combination approach to score level fusion viz. the sum rule, max-rule, product-rule, fuzzy integral and IT2 FI are
described in Section 3. In Section 4, experimental evaluation is carried out and Section 5 concludes the paper.
II. IRISRECOGNITIONSYSTEMWITHMULTIPLE
CLASSIFIERS
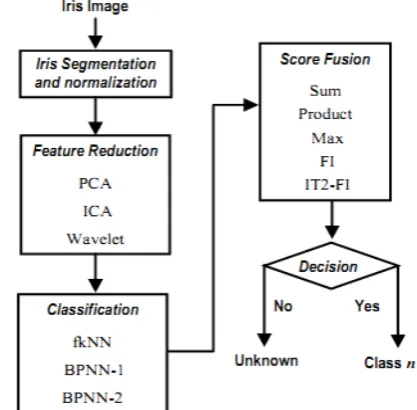
[image:1.595.336.545.550.755.2]Many authors use different techniques for each stage of iris recognition. Daugman uses integro-differential operator in iris segmentation and normalizes the segmented iris by using the homogeneous rubber sheet model [2]. Hough transformation [4] and Canny edge detection [13] are some other iris segmentation methods. Discrete Wavelet Transform (DWT) [3] and Discrete Cosine Transform (DCT) [14] are some common methods of feature encoding.
Figure 1. Iris recognition system with multiple classifiers. Chitte et al. used statistical techniques namely Principal Component Analysis (PCA) and Independent Component Analysis (ICA) to reduce iris features [15]. k-Nearest Neighbour [16] and neural network [17] were used to classify iris pattern.
A. Iris Segmentation and Normalization
Iris segmentation is a critical stage to the success of an iris recognition system and mainly consists of defining the pupillary and limbic boundaries of the iris. Hough transform is a computer vision algorithm to determine the parameters of simple geometric objects and Wildes et al. employed a circular Hough transform in iris segmentation [4]. Firstly, an edge map is generated by employing Canny edge detection [13]. From the edge map, the parameters of circles viz. centre co-ordinates (xc, yc
0
2 2
2+ − =
r y xc c
) and the radius r, are determined by (1).
(1) and the circle which is passing through maximum edge points is chosen. The upper and lower eyelids were isolated using the linear Hough transform.
The input eye images may be dimensionally inconsistent due to the stretching of the iris caused by pupil dilation, rotation of the eye or camera, varying imaging distance etc. Hence, normalization is needed in which the segmented iris image is transformed into a fixed dimension in order to allow comparisons. Daugman’s rubber sheet model is commonly employed to normalize the segmented iris regions [2]. Each point (x, y) within the iris region is remapped into a pair of polar coordinates (r, θ) by (2).
) ( ) ( ) 1 ( ) , (
) ( ) ( ) 1 ( ) , (
θ θ θ
θ θ θ
i p
i p
ry y
r r
y
rx x
r r
x
+ −
=
+ −
=
(2) where, (xp, yp) and (xl, yl) are the coordinates of the pupil and iris boundaries along the θ direction respectively. The segmented iris images and normalized iris template are shown in Fig. 2.
(a) (b)
Figure 2. (a) Segmented iris (b) Normalized iris template.
B. Feature Reduction
During segmentation, iris template (240×20 pixels) is isolated from iris image (320×280 pixels). Still a large amount of redundant information is associated with iris template. At this stage, dimension of iris template is reduced by using three different methods, namely PCA, ICA and DWT to a vector of size 40 in order to reduce dimension of problem and also to minimize classification error.
1) Principal component analysis (PCA) : PCA is an unsupervised linear feature extraction algorithm based on the eigenvectors with the largest eigenvalues. The basic idea for PCA is to find the n linearly transformed components s1,
s2, …, sn so that their variance is to be maximized. Mathematically, PCA is the method of the eigenvalues and eigenvectors decomposition of the covariance matrix of a random matrix [18]. Let A be a square symmetric n×n
matrix (i.e. covariance matrix of a random matrix X) and it can be decomposed as
T i n
i i i T
p p P
P
A
∑
= = ∧ =
1
λ
(3) where, P is an orthogonal matrix with eigenvectors p1, …,
pn and Λ is a diagonal matrix with eigenvalues λ1, λ2, ···, λn
which are sorted in descending order. The first p
eigenvectors contain substantial information, and the vector tail can be cropped up without significant loss of generality.
2) Independent component analysis (ICA): Independent component analysis (ICA) is a general-purpose statistical technique in which a multidimensional source vectors are transposed as linear combination of non-gaussian and maximally independent variables called independent components [19]. In matrix notation, ICA can be model as follows:
Let random (source) vector sT= (s1, …, sm) and (unknown) random vector xT = (x1, …, xn). Let A be a (unknown) matrix with elements aij
Ax
s
=
, i = 1, ..., m, j = 1, ..., n then, (4) where, ‘T’ represent matrix transpose. The maximally independent components (x1, …, xn) is measured by some objective function F (s1, …, sm) of independence. The
FastICA algorithm [20] is employed in the present work.
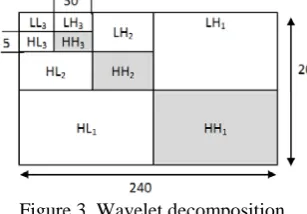
[image:2.595.360.514.399.506.2]3) Wavelet transform (DWT): Wavelet transform can be used to extract features from normalized iris template. In the present work, ‘db2’ wavelet filter has been used [21]. The conceptual process of obtaining the feature vectors using wavelet transform (upto level 3) is shown in Fig. 3. Here, L and H mean the low-pass and the high-pass filter, respectively, and HH indicates that the high-pass filter is applied to the signals of both axes. In the present work, Wavelet transform is applied upto four levels to the normalized iris template (240×20 pixels) in order to get the 4×17 sub-images.
Figure 3. Wavelet decomposition.
C. Classification
The IrisPattern obtained after feature reduction is classified using fuzzy k-NN and two neural networks with
logsig and tansig transfer functions.
1) Fuzzy k-NN classifier (fk-NN): Fuzzy k-NN classifier is an extension of k-NN classifier [5]. In fkNN classification, the subsequent fuzzy information is derived from the training data and these information is used to set a defuzzification threshold dynamically. One advantage is that a decision is not made if confidence is low and classified as
unknown.
Let X = {x1, …, xn} be a labeled set of n samples. A membership µi
(
)
(
)
∑
∑
=
− =
−
− − = k
i j
m j k
i j
m j ij
i
x x
x x x
) 1 /( 2
) 1 /( 2
|| || / 1
|| || / 1 )
(
µ
µ
(x) to a test vector x to class i is assigned according to the relationship in (5).
[image:2.595.44.273.420.484.2]nearest neighbor vector xj
∑
= ij j
i w o
net
and m (> 1.0) is the “strength” of the fuzzy distance function.
2) Neural Network: The problem in hand belongs to supervised learning and multilayer perception (MLP) NN is well suited for the purpose [6]. In the present work, the input layer contains a set of input nodes that represent the
IrisPattern features, one hidden layer containing computation nodes, and an output layer containing node that represent iris classes. Backpropagation learning method has been used for changing the weights in a feed-forward network. It minimizes the total squared error of the output computed. Each neuron in a hidden output layer is activated by using (6).
and yi = f(neti) (6) where, neti is the activation of the ith neuron, j is the set of neurons in the preceding layer, wij is the weight of the connection between neuron i and neuron j, oj is the output of neuron j and yi
1 exp
1 2 )
( 2*
1 = + − −
− i neti
BPNN net f
is the transfer function. The transfer functions of two backpropagation neural networks (viz. BPNN-1 and BPNN-2) are tansig and logsig respectively and is given by (7).
and i
net i BPNN net f exp 1 1 ) (
2 = +
−
(7)
D. Score Fusion
The scores produced by the three classifiers are combined in this module to make final decision. The details of the combination approaches to score level fusions are discussed in Section 3.
III. COMBINATION APPROACHES TO SCORE
LEVELFUSION
A. Statistical Methods
The evidence obtained from multiple classifiers can be combined by using schemes like the sum rule, product rule and max rule [7]. In these schemes, an input pattern Z is classified into one of m possible classes based on the scores produced by R different classifiers. Let Xi be the input feature vector (derived from the input pattern Z) to the ith
classifier. Let the posterior probability P(ωj|Xi ) be the outputs of the individual classifiers for class ωj given the feature vector Xi
1) Sum Rule
. Finally, the input pattern Z is to be assigned to class c∈{1, 2, ..., m} and c is determined by the rules:
∑
= R i i jj P X
c argmax (
ω
| )2) Product Rule
∏
= R
i
i j
j P X
c argmax (
ω
| )3) Max Rule c=argmaxj maxi P(
ω
j|Xi)B. Fuzzy Measure and Fuzzy Integral
Fuzzy integral (FI) introduced by Sugeno is a good competitor of classifier combiners [8]. In fuzzy integral, the expected worth of subset of classifiers called fuzzy measures (like weight) are measured and each measure expresses how much each subset of experts supports to an
input evidence. In literature, there are many type of fuzzy integral. Sugeno fuzzy integral and the Choquet fuzzy integral are the most popular types [9]. In the present work, the implementation is based on Sugeno fuzzy integral.
1) Fuzzy measure [9]: Fuzzy measure (µ) is defined by the function µ: P(X) → [0, 1] satisfying the conditions given in (8) and (9).
1 ) ( , 0 )
(Φ = µ X =
µ (8)
) ( , ), ( )
(A ≤
µ
B if A⊂B and A B∈P Xµ
(9)where X is a finite set. µ(A) represents the importance or the power of coalition A for the fusion problem. Following this definition, λ-fuzzy measure is calculated using (10).
∏
= ≠ − > + = + L i i 1 0 & 1 ), 1 (1
λµ
λ
λ
λ
(10) where µi is the individual importance of classifier Di , i = 1, ... , L.
2) Fuzzy integral [9]: Fuzzy integral (Sugeno) S(gi
)) ( ), ( (min( max ) (
1 i i
N
i
i g x A
g
S
µ
=
=
) of a function g: P(X) → [0, 1] with respect to µ is defined by (11).
(11) where g(xi) is the indices to be permuted so the 0 ≤ g(x1) ≤ … ≤ g(xn) ≤ 1 and Ai = { xi, …, xN}, A1 =∅.
The Sugeno measure μ(Ai
) ( )
(A1
µ
x1µ
=) can be calculated recursively from the fuzzy densities using (12).
) ( ) ( ) ( ) ( )
(Ai =µ xi +µ Ai−1 +λµ xi µ Ai−1
µ (12)
3) Interval type-2 fuzzy integral (IT2 FI): The concept of type-2 fuzzy sets was introduced by Zadeh as an extension of the concept of an ordinary (i.e. type-1) fuzzy set [22]. In type-2 fuzzy set, grades of membership are fuzzy (subsets of [0, 1]) and is known as the primary memberships. Corresponding to each primary membership, there is a secondary membership which defines the possibilities for the primary membership.
Definition 1: A type-2 fuzzy set à in X is a fuzzy set whose membership grades are fuzzy. This implies that µÃ(x) is a fuzzy set in U for all x, i.e. µÃ
) ( ) ( ) ( ) ( )
(Ai =µ xi +µ Ai−1 +λµ xi µ Ai−1
µ
: X →P̃(U) where, P̃(U) be the set of fuzzy sets in U [23]. Then, Ã is represented by (13).
(13)
It follows that ∀x∈X ∃Jx⊆U such that µ Ã(x): Jx
U J u U u x u x x
x A A x
A( )={( , ~( )( ))| ~( )( )∈ ∀ ∈ ⊆
~
µ
µ
µ
→ U(14)
X is the primary domain and Jx the primary membership of x while U and µÃ
} ) )( ( | ))) )( ( , ( , ( { ~ ~
~ x u x u U x X u J U
u x
A= µA µA ∈ ∀ ∈ ∧∀ ∈ x⊆
(x) are known as the secondary domain and the secondary membership of x respectively.
Then, (14) is rewritten as
(15) An interval type-2 fuzzy set is a type-2 fuzzy set whose secondary membership grades (i.e. µÃ
} )) 1 , ( , ( { ~ U J u X x u x
A= ∀ ∈ ∧∀ ∈ x⊆
(x)(u)) are all 1. In the interval case, (15) is reduced to (16).
(16)
Definition 2: Footprint Of Uncertainty (FOU) is the projection of the type-2 fuzzy set onto the x-u plane.
xXDefinition 3: The Lower Membership Function (LMF) of a type-2 fuzzy set is the type-1 membership function associated with the lower bound of the FOU and is denoted
by
µ
~A(x).Definition 4: The Upper Membership Function (UMF) of a type-2 fuzzy set is the type-1 membership function associated with the upper bound of the FOU and is denoted
by ~(x) A
µ .
The shaded region in Fig. 4 is the FOU. The solid line denotes upper MFs and the dashed line denotes lower MFs.
The FOU is bounded by a lower membership ~(x) A
µ
and an
upper membership
µ
~A(x), both of which are T1 FSs, consequently, the membership grade of each element of anIT2 FS is an interval [ ~(x), A~(x)]
A µ
µ
.
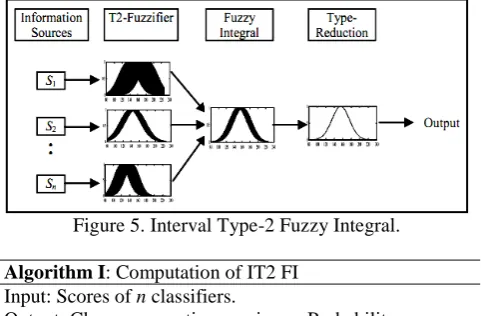
In the present work, the evidences (i.e. scores) of classifiers are fuzzified into interval type-2 fuzzy and the uncertainty of the evidences as well as the fuzzy integral are handled correspondingly. In order to extend Fuzzy integral to IT2 FI, the uncertainty is modelled by using Interval Type-2 Fuzzy Sets. The steps are shown in Fig. 5 and the different steps are described in Algorithm I.
(a) (b)
Figure 4. (a) Two IT2 fuzzy sets (b) FOU (shaded area) of
[image:4.595.39.280.478.636.2]Logsig MFs with uncertain mean (the centres of Logsig MFs varies from 4.5 to 6.5).
Figure 5. Interval Type-2 Fuzzy Integral.
Algorithm I: Computation of IT2 FI
Input: Scores of n classifiers.
Output: Class representing maximum Probability Step 1: The scores of ith
)) / ) ( exp( 1 /( 2 )
(x x x σ
f i = + − i−
classifiers (i.e. evidences) is fuzzyfied into IT-2 Fuzzy by using the logsig
function given by (18).
(18) where, x is mean and σ is standard deviation. Considering the case of logsig primary MF having
a fixed standard deviation σ and an uncertain mean
that takes on values in
[
x
l,
x
u]
, the upper MF )( ~ i A x
µ is given by (19).
< − − + ≤ ≤ < − − + = i u i u u i l l i l i i A x x x x x x x x x x x x )), / ) ( exp( 1 /( 2 , 1 )), / ) ( exp( 1 /( 2 ) ( ~ σ σ µ (19)
and the lower MF
µ
A~(xi)is given by (20).
+ > − − + + ≤ − − + = 2 / ) ( )), / ) ( exp( 1 /( 2 2 / ) ( )), / ) ( exp( 1 /( 2 ) ( ~ u l i i l u l i u i i
A x x x x x
x x x x x x σ σ µ (20) Step 2: The max and the min operator are replaced with the interval join and the interval meet operator respectively [22]. Consider a problem with each
information source i in an interval [g(xi),g(xi)] and corresponding fuzzy measures with an interval
)] ( ), (
[ ~ i ~A i
A x
µ
xµ
, IT2 FI is computed by extending (11) to (21).
)]) ( ), ( [ )], ( ), ( ([ ( ] ,
[ i i ~A i A~ i
N
i U
L S join meet g x g x x x
S = µ µ
(21) In IT2 FI, the fuzzy lambda (λ) and fuzzy measures are to be computed for each extreme of the interval with the same manner of the fuzzy Integral by using (12).
Step 3: The output of Interval Type-2 Fuzzy Integral is an interval of possible solutions. A final decision is made after type-reduction to type-1 Fuzzy Integral. For this purpose, the Nie-Tan type-reduction method is employed in the present work [24]. This method involves taking the mean of the lower and upper membership functions of the Interval Type-2 Fuzzy set, so creating a type-1 fuzzy set as in (22).
)] ( ), ( [ 2 1 )
( i ~A i A~ i
T x µ x µ x
µ =
(22) where, T is the resultant type-1 fuzzy set.
IV. EXPERIMENTALRESULTS
In the present work, iris images are taken from the CASIA-IrisV1.0 database and CASIA-IrisV3-Interval database collected by the Chinese Academy of Sciences’ Institute of Automation [25]. The CASIA-IrisV1.0 database consists of 756 gray scale iris images (7 sample images for each 108 classes) of size 320×280 pixels. The images are taken in two sessions, three samples during the first session and four samples during the second by a digital optical sensor designed by National Laboratory of Pattern Recognition – Chinese Academy of Sciences (NLPR). CASIA-IrisV3-Interval database a superset of CASIA V1.0 and consists of 2655 gray scale iris images of size 320×280 pixels collected from 249 subjects.
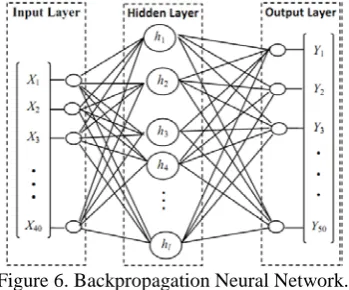
is shown in Fig. 6. The network design parameters of the two BPNNs are summarized in Table 1. Each classifier produces a matching score matrix of size (250×50) containing 250 genuine scores and 250×49 imposter scores during training and matching score matrix of size (100×50) containing 100 genuine scores and 100×49 imposter scores during testing. The matching scores produced by the three classifiers are combined by Interval Type-2 Fuzzy Integral (IT2 FI).
Figure 6. Backpropagation Neural Network.
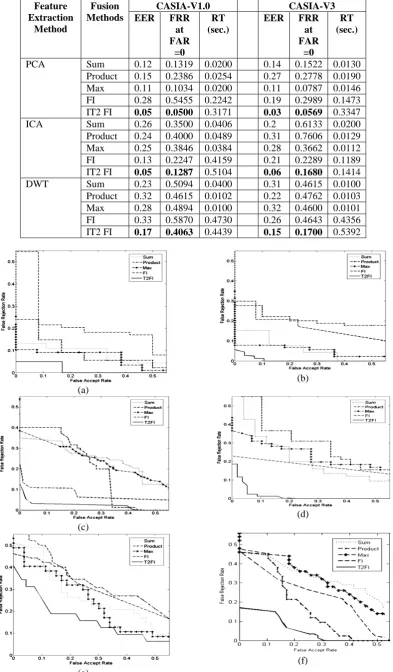
The performance of the proposed IT2 FI based approach for iris recognition is compared with four existing fusion methods viz. Sum, Product, Max and Fuzzy Integral (type-1 FI) in terms of Equal error rate (EER), False Rejection Rate (FRR) and Run Time (RT) in sec. and is summarized in Table 2. The run time in Table 2 is the time taken by each of the methods for combining the matching scores. The ROC curves of fusion methods are shown in Fig. 7. It is observed that the best performance of 0.05 ERR and 0.05 FRR at 0.00 FAR is achieved using the proposed IT2 FI match score fusion method with PCA for CASIA-V1 iris database. For CASIA-V3 iris database also, the proposed IT2 FI match score fusion method with PCA outperforms over other four fusion methods with the best performance of 0.03 ERR and 0.0579 FRR at 0.00 FAR. The experimental results over benchmark dataset demonstrate that the proposed IT2 FI outperforms others four fusion strategies, including the type-1 FI, in terms of EER and FRR. However, the run time of the proposed approach, IT2 FI based iris recognition, is comparatively higher than the other four approaches pertaining to the computational time needed for the computation of the lower and the upper membership
functions of the interval type-2 fuzzy set. Furthermore, it is observed that the IT2 FI fusion approach performs better with PCA among the three feature reduction methods.
Table 1. BPNN Network design parameters.
Parameters BPNN-1 BPNN-2
Training function traingda traingda
Transfer function tansig logsig
No. of neuron in hidden layer
80 80
Initial learning rate 1.15 0.20 Learning rate increment 1.12 1.02
Epochs 50,000 50,000
Error goal 0.000001 0.000001
V. CONCLUSION
In this paper, a new approach to combine the scores of multiple classifiers by Interval Type-2 Fuzzy Integral for iris recognition is proposed. Iris image is segmented and normalized using Hough transform and Daugman’s rubber sheet model respectively and, features are extracted using PCA, ICA and DWT to form iris templates. The normalized iris templates with the reduced features are classified by using three classifiers viz. fuzzy k-NN and two neural networks, BPNN-1 and BPNN-2, with logsig and tansig
transfer functions respectively. The proposed Interval Type-2 fuzzy integral (ITType-2 FI) is employed to combine the matching score of the three classifiers and also the performance is compared with the other fusion methods namely the sum rule, max-rule, product-rule and type-1FI. From the experimental results, it is observed that the proposed Interval Type-2 fuzzy integral (IT2 FI) based match score fusion approach outperforms the four other fusion methods including the type-1 FI in terms of EER and FRR. The proposed IT2 FI based match score fusion approach is found to be promising for iris recognition. However, as future work, steps are needed to be taken to make the IT2 FI based match score fusion approach run faster with special attention to achieve trade-off between accuracy and the running time.
Table 2. Performances of different fusion methods Feature
Extraction Method
Fusion Methods
CASIA-V1.0 CASIA-V3
EER FRR
at FAR
=0
RT (sec.)
EER FRR
at FAR
=0
RT (sec.)
PCA Sum 0.12 0.1319 0.0200 0.14 0.1522 0.0130 Product 0.15 0.2386 0.0254 0.27 0.2778 0.0190 Max 0.11 0.1034 0.0200 0.11 0.0787 0.0146 FI 0.28 0.5455 0.2242 0.19 0.2989 0.1473 IT2 FI 0.05 0.0500 0.3171 0.03 0.0569 0.3347 ICA Sum 0.26 0.3500 0.0406 0.2 0.6133 0.0200 Product 0.24 0.4000 0.0489 0.31 0.7606 0.0129 Max 0.25 0.3846 0.0384 0.28 0.3662 0.0112 FI 0.13 0.2247 0.4159 0.21 0.2289 0.1189 IT2 FI 0.05 0.1287 0.5104 0.06 0.1680 0.1414 DWT Sum 0.23 0.5094 0.0400 0.31 0.4615 0.0100 Product 0.32 0.4615 0.0102 0.22 0.4762 0.0103 Max 0.28 0.4894 0.0100 0.32 0.4600 0.0101 FI 0.33 0.5870 0.4730 0.26 0.4643 0.4356 IT2 FI 0.17 0.4063 0.4439 0.15 0.1700 0.5392
(a)
(b)
(c)
(d)
(e)
(f)
Figure 7. ROCs of different fusion algorithms under different combinations of feature extraction methods with databases (a) PCA with CASIA-V1.0 (b) PCA with CASIA-V3-Interval (c) ICA with CASIA-V1.0 (d) ICA with CASIA-V3- Interval (e) DWT with
VI. REFERENCES
[1] A. Ross, K. Nandakumar and A. K. Jain, Handbook of Multibiometrics, New York: Springer, 2006.
[2] J. Daugman, “How Iris Recognition Works”, IEEE
Transactions on Circuits and Systems for Video Technology, vol. 14(1), pp. 21-30, 2004.
[3] S. Lim, K. Lee, O. Byeon and T. Kim, “Efficient Iris Recognition through Improvement of Feature Vector and Classifier”, J. ETRI, vol. 23(2), pp. 61-70, 2001.
[4] R. Wildes, “Iris Recognition: an Emerging Biometric Technology”, Proc. IEEE, 85(9), pp. 1348-1363, September 1997.
[5] J. M. Keller, M. R. Gray and J. A. Givens, “A Fuzzy K-Nearest Neighbor Algorithm”, IEEE Transactions on Systems, Man, and Cybernetics, vol. 15(4), pp. 580-585, 1995.
[6] M. Bishop, Pattern Recognition and Machine Learning, New York: Springer Science and Business Media, 2006.
[7] J. Kittler, M. Hatef, R. P. W. Duin, and J. Matas, “On Combining Classifiers”, IEEE Transactions on Pattern Analysis and Machine Intelligence, vol. 20, pp. 226-239, 1998.
[8] S. B. Cho and J. H. Kim, “Combining multiple neural networks by fuzzy integral and robust classification”, IEEE Transactions on Systems, Man, and Cybernetics, vol. 25, pp. 380–384, 1995. [9] L. I. Kuncheva, Combining Pattern Classifiers: Methods and
Algorithms, New Jersey: Wiley-Interscience, 2004.
[10] H. P. S. Hui, H. M. Meng and M. W. Mak, “Adaptive Weight Estimation in Multi-Biometric Verification using Fuzzy Logic Decision Fusion”, Proc. International Conference of Acoustics, Speech and Signal Processing (ICASSP), Hawaii, U.S.A. (2007), pp. 501- 504, April, 2007.
[11] V. Conti, G. Milici, P. Ribino, F Sorbello and Vitabile, “Fuzzy Fusion in Multimodal Biometric Systems”, in KES 2007/WIRN 2007, Part I, LNAI 4692, B. Apolloni et al. (Eds.), Berlin Heidelberg: Springer-Verlag, 2007, pp. 108–115, 2007.
[12] K. C. Kwak and W. Pedrycz, “Face Recognition Using Fuzzy Integral and Wavelet Decomposition Method”, IEEE Transactions on Systems, Man, and Cybernetics—Part B: Cybernetics, vol. 34(4), pp. 1666 – 1675, 2004.
[13] Y. Liu, S. Yuan, X. Zhu and Q. Cui, “A Practical Iris Acquisition System and a Fast Edges Locating Algorithm in Iris Recognition”, Proc. IEEE Instrumentation and Measurement
Technology Conf. (IMTC’03), CO, USA, pp. 166–168, May 2003.
[14] M. Monro, S. Rakshit and D. Zhang, “DCT-based Iris Recognition”, IEEE Transactions on Pattern Analysis and Machine Intelligence, vol. 29(4), pp. 586-595, 2007.
[15] P. P. Chitte, J. G. Rana, R. R. Bhambare, V. A. More, R. A. Kadu and M. R. Bendre, “Iris Recognition System using ICA, PCA, Daugman’s Rubber Sheet Model together”, International Journal of Computer Technology and Electronics Engineering, vol. 2(1), pp. 16-23, 2012.
[16] P. S. R. Chandra Murty and E. S. Reddy, “Iris Recognition System using Principal Components of Texture Characteristics”, TECHNIA- International Journal of Computing Science and Communication Technologies, vol. 2(1), pp. 343-348, 2009.
[17] A. Murugan and G. Savithiri, “Fragmented Iris Recognition System using BPNN”, International Journal of Computer Application, vol. 36(4), pp. 28-33. 2011.
[18] T. Jolliffe, Principal Component Analysis, New York: Spinger-Verlag, 2002.
[19] Hyvärinen and E. Oja, Independent component analysis: algorithms and applications, Neural Networks, vol. 13(4-5), pp. 411-430, 2000.
[20] H. Gävert, J. Hurri, J. Särelä and Hyvärinen, FastICA Matlab package. Aug 2014.
[21] Matlab, Wavelet Toolbox, at
[22] Q. Liang and J. M. Mendel, “Interval type-2 fuzzy logic systems: Theory and design”, IEEE Transactions on Fuzzy Systems, vol. 8(5), pp. 535–550, 2000.
[23] S. Greenfield and F. Chiclana, “Accuracy and complexity evaluation of defuzzification strategies for the discretised interval type-2 fuzzy set”, International Journal of Approximate Reasoning, vol. 54(8), pp. 1013-1033, 2013.
[24] M. Nie, and W. W. Tan, “Towards an Efficient Type-Reduction Method for Interval Type-2 Fuzzy Logic Systems”, Proc. IEEE International Conference of Hong Kong, China, pp. 1425–1432, June 2008.
[25] CASIA Iris image database, at
![2 [4 Chloro 3 (4 ethoxybenzyl)phenyl] 1,3 dithiane](data:image/gif;base64,R0lGODlhAQABAIAAAP///wAAACH5BAEAAAAALAAAAAABAAEAAAICRAEAOw==)