International Journal of Advanced Research in Computer Science
RESEARCH PAPER
Available Online at www.ijarcs.info
Improved Edge Detection Method by using Weighted Support Vector Machines
Dr.T.Karthikeyan1and N.P.Revathy2
1
Associate Professor, P.S.G. College of Arts and Science, Coimbatore,
2
Researchscholar,KarpagamUniversity,Coimbatore,India
Abstract--- Edge detection plays considerable part in recent years to various image processing applications. Detection of edge results for noise free images becomes easy and it is not applicable to practical applications .The quality of images for a practical case is degraded by noise. Detection of edges for noise image becomes more difficult task in several numbers of edge detection methods such as K means clustering, and SVM classification methods. All of these methods produce best edge detection results, but still the detection rate of methods needs to improve. In this paper presented a new weighted support vector machines (WSVM) method for edge detection. It uses different edge detection features as input to WSVM for edge detection process. This method enhances edge detection results by reducing the working out time and improvement the image quality it can be compared to existing edge detection methods.The overall performance of proposed WSVM edge detection results is high than the existing methods.
Keywords---Weighted support vector machines, Edge detection, Gradients, Image processing.
i. INTRODUCTION
Due to the importance of image processing applications such as object detection, computer vision, image segmentation, pattern recognition etc edge detection plays major significant part in recent years. Since, the edge is one of the important features for image. The detection of edge results can be applied to applications such as image development, detection, morphing, re-establishment, registration, compression, recovery, hiding etc. [1]. Edge in the image also the change the level of intensity [2]. Since anyone of the existing edge detection methods produce best edge detection results for different categories of images and different level of noises, so finding an edge for noise free image still becomes an investigation area in nowadays.
Since natural images are easy to fall into stage and object. Generally noises in the images are in the form of types such as salt, pepper and Gaussian noise. These types of noises under the category of white and black pixels, where salt and pepper noise under the category of black pixels , Gaussian noise is under the category of white noises .In Gaussian noise where the pixels of each value is changed by adding the value taken from Gaussian distribution function.
A standard edge detection method uses an edge detection operator to detect edge results of each image. The Canny edge detection operator uses a continuous window with different smoothing filters. Canny edge requires some quality parameters to enhance detection accuracy rate [3]. Based on this simplicity it becomes low computational cost and results of these quality parameters dependent to lightening conditions, noise etc. Lack these dependencies it produces less edge detection results. In order to overcome these problems some of the existing methods uses a transformation method Hough transform for edge detection process, however all edges that corresponds to image doesn’t meet certain quality measurement.
In earlier work uses a Sobel [4] and Roberts [5] operators to detect the edge results for each image. All of this edge detection uses gradient operators to perform edge detection process. Later on, a different edge detection method i.e. Prewitt, Laplacian, Roberts and Sobel also proposed in earlier work. Anyone of the existing edge detection methods produce best edge detection results for different categories of images and different level of noises.
In this paper we propose a WSVM classification technique for edge detection process to enhance the results of edge detection and provided that enhanced resistance to noise. It uses different features vector such as variance, entropy, and gradient of each image pixel which is input to WSVM, in order to detect edge pixels and non-edge pixels.
ii. RELATED WORKS
In earlier work several numbers of edge detection methods have been proposed in the literature, each one of the methods have their own advantages and disadvantages, in this section we detail discuss about the edge detection methods and their problems. Cellular automata theory is used in earlier work by Tapas Kumar and Sahoo (2010) [2] for the edge detection process .Cellular automata (CA) theory based methods get enhanced edge detection results for complicated images. But the macroscopic physics which is specified by using the CA results for edge detection is not clear when compare to normal images edge detection results. Davoodianidaliki (2013) [3] develop a conventional edge detection operator such as Sobel and Canny with swarm intelligence based Ant colony optimization (ACO) algorithm. The magnitude matrix result from canny edge detection operator is measured as input for ACO. In this work image resizing methods also performed to decrease the size of original with best smoothing results. It is not applicable to all types of images.
edge detection uses pixel by pixel methods with mask. It highlights the edge detection pixel result using if then fuzzy rules. In this work there are four edge pixels values is considered as input to fuzzy model and has output becomes whether a selected edge corresponds to pixel or not .If the number of image samples is high it is not each to create more number of rules for each edge detection process .Similarly Hitesh Kapoor et.al (2012) [7] also develop a fuzzy logic based edge detection along with canny operator is discussed. It provides another way to characterize linguistic and individual attributes of the real world in computing manner. It is used to detect the edge pixels where the intensity level of the pixels is changed suddenly/sharply. Moreover it additionally detects the boundary values discontinuities for each edge image pixel features.
Akansha et al, (2012) [8] proposed a well organized edge detection algorithm for corrupted image samples. It finds the corrupted pixels by eliminating noise from the image. Consequently accurate pixels are found in this stage and noises in the images also removed .The noise values of the images are calculated based on morphological operators such as corrosion and dilation. The proposed algorithm uses a various type of combination operators for analysis the results of noise levels for corrupted images, so that corrupted image samples are identified exactly. Suryakant and Renu Dhir (2012) [9] used an ANFIS system algorithm to identify edges results of gray scale images. Initially the gray scale images are examined by using pixel window. The edges of each and every image pixel are straightforwardly resolute by using ANFIS network. The proposed ANFIS model is evaluated through Sobel operator and Roberts’s operator.
iii. BACKGROUND
Support vector machine is one of the significant machine learning algorithm to perform the classification task in many real world applications .One of the major issue in SVM is that the weight values are assigned randomly during classification process, because of this problem accuracy results of classification are degraded .In order to overcome these problem, in this work refer a weighted support vector machine [10] (WSVM). The proposed WSVM algorithm is used to assign weight values automatically to each training and testing samples to enhance the level of accuracy for each sample with different weight values that corresponds to class labels. Suppose that if the weights are known, then the training data set becomes,
(1)
Where the weight values of SVM is assigned by using kernel-based possible c-means (KPCM) algorithm, the assignment of weight values is detail discussed in the following steps.
iii.1.Formulation of WSVM
The creation of WSVM initiates through objective function through the maximization of boundary separation results with less classification error values for each training samples. In WSVM the penalty term for each weight values is treated differently with different assigning of weight values to each training process and optimization problem is specified as ,
(2)
Subject to
(3)
To assign the weight values automatically for each data points the above formulation is changed as,
(4)
subject to,
(5)
and the KT conditions of WSVM become,
(6)
In WSVM, the higher bounds values of are enclosed by weight values and weight values are assigned by using KPCM algorithm .From this step the outliers in the class values are exactly identified and error values of classification also reduced simultaneously. In WSVM, and
thus finitely positive.
iii.2.Weights generating algorithm
The weight values of SVM methods are automatically generated by using KPCM algorithm. To generate the weight values automatically, the training data samples are divided into number of clusters using kernel parameter and it is
denoted by (where characterize
high dimensional kernel space).
(7)
Where is the regularization parameter for each kernel space that belongs to each cluster .The value of training data results should be equal to value one for all clusters c as shown in (7). Then the Euclidian distance of each clusters cluster weight values automatically is formulated as follows by using the above distance function from an equation (8).
where is the squared Euclidian distance defined in (8), determines the fuzzification parameter, and is the possibility of correctly transformed dataset points
in the cluster. If the value of is known or specified, the (9) gives new updated results for each possibility of transformed data points outcomes and clustering results of kth kernel space as follows:
(10)
(11)
In equation (11) the parameter value of can be obtained from all possible number of inside -cluster distance to each cluster as,
(12)
Repeat these steps (11) and (12) until best classification results are achieved to each training data samples from WSVM methods. The clustered weight values results from KPCM is very perceptive to the value ,it is considered as best classification results or else worst weight values results .In classification algorithm the possibility of the positive and
negative class are represented as & be
denoted by and after the completion
of weight values estimation , correspondingly. (Here denote the weights values of data points that correspond to positive class and W− denote the weights values of data points that correspond to negative class.) .Finally the classification result are achieved in efficient manner when compare to SVM methods.
iv. PROPOSED METHODOLOGY
In this research, the proposed edge detection system consists of two major phases such as edge detection and analysis of edge detector results using WSVM classification method. The proposed flow diagram is shown in the figure 1.
Figure 1 proposed flow diagram
In order to perform edge detection process initially the images are converted into pixels and formation of matrix for those pixels values,
iv.1. Features selected for each image
In this section, will describe the three important features for image pixels to analysis edge detection results.
Pixel Features
The pixel value of every image information is obtained by comparing with its neighboring pixel features. Every pixel value features information comparison can be done by extracting matrix of neighboring features. For every one of the it’s neighborhood matrix contains
. To extract pixels values of features such as variance, entropy, and gradient, in this use a matrix of neighboring features. Based on this selected attributes only decides whether the selected pixels corresponds to edge and non-edge features or not. The color intensity level of each pixels that corresponds to grayscale images is represented as and it ranges starts from .
Variance
Variance is one of the usual metric that consists of information about pixels values .If the variance value is low it indicates only a small amount of changes occurs in grayness value and if the variance values are high it indicates that large amount of changes occurs in grayness value. A pixel which corresponds to high variance is used in this work to measure the edge detection values. The mean value of each pixel is computed as:
(13) Image
Converted into pixel and form matrix
Calculate feature vectors values for each pixel
Edge
Weighted SVM is used for Edge detection
Entropy
Gradient Variance
(14)
Entropy
From information theory if the value of entropy is less, it achieves high information gain ratio and rate of intensity level for each pixels is also high with larger dispersion. So the pixels with better entropy values are considered as an edge pixel [11] and remaining becomes non edge features. The entropy of each pixels is computed as:
(15)
Where
(16)
Gradient
The scales of the gradient tell concerning how rapidly the image is varying, whereas the direction value of gradient tell about the direction in which the image is changing most rapidly. In this work use Sobel method [4] to measure the gradient value of image. The gradient value of each pixel is computed as:
(17)
where represents the mask value in direction and represents the mask value in direction correspondingly.
iv.2. Edge detection using classification
In this paper present a Weighted SVM method to perform edge detection. In classification methods the decision of edge detection is made between pixels values that correspond to edge and non edge features. The decision of each pixels result should be obtained by using feature extraction that consists of information of pixels features, entropy, variance and gradients. Feature vector is formed between each pixel and their corresponding neighboring pixel matrix and it is considered as input to the WSVM for the edge detection process .Each and every feature vectors consists of information about pixels values that corresponds to pixels features, entropy, gradient and variance features. Our proposed edge detection methods takes less time to complete the process, since instead of consideration of image as input, in this work initially we extract feature from images and it considered as input to the training process. It improves the edge detection results with less execution time.
Different feature vectors are used in this work to edge detection .Each and every feature have threshold value to detect whether the selected feature is edge feature or not. If the values of the feature vectors are greater than the threshold value then it is considered as a non edge or else the pixel is considered as edge pixel. The predefined threshold value of each feature is calculated using some of the existing methods, for variance use an Otsu’s threshold calculation [12]. For
entropy feature use an image based entropy measure [12] to calculate threshold value for each entropy feature. For gradient feature, gradient based threshold calculation [13] is used for calculating the threshold. Once the threshold calculation is completed then group those feature into edge and non-edge feature separately based on the two class’s namely positive and negative class. The positive class is represented as and the negative class is represented as .
iv.3. Detection Method
Based on the above mentioned definitions the pixels of each images is labeled as either positive class or negative class with dark and bright region. The pixel values are clustered using KPCM to generate weight value automatically for each pixel in WSVM classification process. The positively labeled edge pixels are grouped into and negative non edge pixels are grouped into . In classification algorithm the possibility of the positive and negative class (edges) is represented as
& be denoted by and
after the completion of weight values estimation, correspondingly. (Here denote the weights values of data points that correspond to positive class and W− denote the weights values of data points that correspond to negative class.) .Finally the classification result are achieved in efficient manner when compare to SVM methods.
v. EXPERIMENTAL RESULTS
In order to measure the results of proposed WSVM based edge detection method and existing K means clustering, SVM based is simulated using MATLAB to different set of images. It shows that the proposed WSVM based edge detection methods provide more edge detection results when compare to existing edge detection algorithms such SVM, K means clustering algorithm. The edge detection methods results are analyzed using the parameters like MSE and PSNR.
PEAK SIGNAL TO NOISE RATIO (PSNR)
Peak signal to noise ratio is defined as the ratio among the utmost possible outcomes results and corrupted noise results of the image. The value for each image is calculated by using following formula,
(18)
MEAN SQUARE ERROR (MSE)
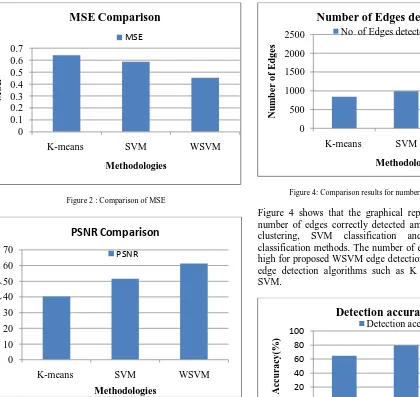
Figure 2 : Comparison of MSE
Figure 3 : Comparison of PSNR
Figure 2 and 3 shows that the graphical representation results of comparison of MSE and PSNR between proposed WSVM method and existing methodologies such as cluster algorithms, SVM. If the value of MSE is less it shows that proposed WSVM have high edge detection results than existing methods .The PSNR value of proposed WSVM is high than the existing edge detection algorithms such as clustering, SVM. The values of PSNR and MSE are tabulated in Table 1.
TABLE 1 : PERFORMANCE COMPARISON RESULTS
Methodology MSE PSNR Number of edges detected
K-means 0.6412 40.258 842
SVM 0.5874 51.458 989
WSVM 0.4523 62.356 2045
Figure 4: Comparison results for number of edges detection
Figure 4 shows that the graphical representation results for number of edges correctly detected among existing k means clustering, SVM classification and proposed WSVM classification methods. The number of edges detected value is high for proposed WSVM edge detection method than existing edge detection algorithms such as K means clustering and SVM.
Figure 5: Detection Accuracy Comparison
Figure 5 shows that the graphical representation results of detection accuracy comparison among edge detection methods such as, K means clustering, SVM and WSVM. The proposed WSVM algorithms have high edge detection accuracy than SVM ,K means clustering algorithm.
vi. CONCLUSION
parameters like MSE, PSNR ,the value of MSE is low and PSNR is high for proposed WSVM when compared to existing K means clustering ,SVM classification .
vii. REFERENCES
[1] Tapas Kumar, G. Sahoo “A Novel Method of Edge Detection using Cellular Automata” International Journal of Computer Applications (0975 – 8887), Volume 9– No.4, November 2010. [2] Renyan Zhang, Guoliang Zhao and Li Su, 2005. A New Edge
Detection Method in Image Processing. In: IEEE Proceedings of the ISCIT’05 Oct 12-14, 1: pp.445-448.
[3] M. Davoodianidaliki , A. Abedini , M. Shankayi “Adaptive Edge Detection Using Adjusted Ant Colony Optimization” International Archives of the Photogrammetry, Remote Sensing and Spatial Information Sciences, Volume XL-1/W3, 2013. [4] Sobel., E., 1970. Camera Models and Machine Perception. PhD
thesis. Stanford University, Stanford, California.
[5] Roberts, L. G., 1965. Machine perception of three-dimensional solids,” Optical and Electro-Optical Information Processing, MIT Press Cambridge, Massachusetts, pp. 159-197.
[6] Bijuphukan Bhagabati and Chumi Das “Edge Detection of Digital Images Using Fuzzy Rule Based” International Journal of Advanced Research in Computer Science and Software Engineering, Volume 2, Issue 6, June 2012
[7] Hitesh Kapoor and Mr. Parikshit Singla “Magnified Edge Detection using Fuzzy-Canny Logic” International Journal of
Advanced Research in Computer Science and Software Engineering,Volume 2, Issue 5, May 2012
[8] Akansha Mehrotra , Krishna Kant Singh, and M.J.Nigam “A Novel Algorithm for Impulse Noise Removal and Edge Detection” International Journal of Computer Applications (0975 – 8887),Volume 38– No.7, January 2012.
[9] Suryakant , Renu Dhir “Novel Edge Detection Using Adaptive Neuro-Fuzzy Inference System” International Journal of Advanced Research in Computer Science and Software Engineering, Volume 2, Issue 5, May 2012
[10] Xulei Yang, Qing Song And Yue Wang “A Weighted Support Vector Machine For Data Classification”International Journal of Pattern Recognition and Artificial Intelligence Vol. 21, No. 5 (2007) 961–976.
[11]W. Dai and K. Wang, "An image edge detection algorithm based on local entropy," in Proceedings of the IEEE International Conference on Integration Technology (ICIT'07), pp. 418{420, 2007.
[12]Poonamdeep Kaur , Raman Maini “Performance Evaluation of Various Thresholding Methods using Canny Edge Detector” International Journal of Computer Applications (0975 – 8887), Volume 71– No.9, May 2013.