Volume 4, No. 10, Sep-Oct 2013
International Journal of Advanced Research in Computer Science
RESEARCH PAPER
Available Online at www.ijarcs.info
ISSN No. 0976-5697
Detection of Regulatory Motif in Eukaryotes by Self Organizing Map Neural Networks
G.S.Pugalendhi
Computer Science and Engineering
Maharaja Institute of Technology Coimbatore, India pugal_lendhi@yahoo.co.in
Abstract: Transcriptional control is governed by the actions of a large number of proteins, called transcription factor. Gene is regulated by the binding of transcription factor on the regulatory motifs known as Transcriptional factor binding sites. Genes are regulated by activity of short DNA sequences (regulatory motif) of size 6-12 that resides in close proximity to the co-regulated genes in the genome. Many diseases are caused by defects in gene regulation, rendering the identification of regulatory sequences is an important task. Many of the Current motif finding systems uses clustering based algorithms. This assumption has some limitations because sequence signals have distinct properties and varies in count. This project aims at identifying old and new regulatory motifs in DNA Sequences using Self-Organizing Map (SOM) and Neural Networks. This system is based on a novel intra-node soft competitive procedure to achieve maximum discrimination of motifs from background signals in datasets. The intra-node competition is based on an adaptive weighting technique on two different signal models to better represent these two classes of signals. System is developed as a Motif analysis tool using that researchers will find motif sequences for several real and artificial dataset.
Keywords: A - Adenine, G - Guanine, C - Cytosine, T - Thymine, Regulatory Motif, Self Organizing Neural Network, Position Specific Scoring Matrix, Hybrid Analysis Model
I. INTRODUCTION
The proposed project is performed in the Bioinformatics platform. Bioinformatics is the application of computer technology to the management of biological information. Computers are used to gather, store, analyze and integrate biological and genetic information which can then be applied to gene-based drug discovery and development. The need for Bioinformatics capabilities has been precipitated by the explosion of publicly available genomic information resulting from the Human Genome Project.
In genetics, a sequence motif is a nucleotide or amino-acid sequence pattern that is widespread and has, or is conjectured to have, a biological significance. For proteins, a sequence motif is distinguished from a structural motif, a motif formed by the three dimensional arrangement of amino acids, which may not be adjacent. [1]. The main reason for the detection of regulatory motif is that the motif is responsible for the irregularities or special behavior of a body. So if we are able to find the position and the weight of the regulatory motif it is easy to detect the particular character of the body. When a sequence motif appears in the exon of a gene, it may encode the "structural motif" of a protein; that is a stereotypical element of the overall structure of the protein. Nevertheless, motifs need not be associated with a distinctive secondary structure. [6] "Non coding" sequences are not translated into proteins, and nucleic acids with such motifs need not deviate from the typical shape (e.g. the "B-form" DNA double helix).
Outside of gene exons, there exist regulatory sequence motifs and motifs within the "junk", such as satellite DNA. Some of these are believed to affect the shape of nucleic acids (see for example RNA self-splicing), but this is only sometimes the case. For example, many DNA binding proteins that have affinity for specific DNA binding sites bind DNA in only its double-helical form. They are able to recognize motifs through contact with the double helix's
major or minor groove. Short coding motifs, which appear to lack secondary structure, include those that label proteins for delivery to particular parts of a cell, or mark them for phosphorylation. Within a sequence or database of sequences, researchers search and find motifs using computer-based techniques of sequence analysis, such as BLAST. Such techniques belong to the discipline of bioinformatics. [6][7]
Motifs and consensus sequences the notation [XYZ] means X or Y or Z, but does not indicate the likelihood of any particular match. For this reason, two or more patterns are often associated with a single motif: the defining pattern, and various typical patterns. For example, the defining sequence for the IQ motif may be taken to be: [FILV] Qxxx [RK] Gxxx. Usually, however, the first letter is I, and both [RK] choices resolve to R. Since the last choice is so wide, the pattern IQxxxRGxxxR is sometimes equated with the IQ motif itself, but a more accurate description would be a consensus sequence for the IQ motif. Discovery through evolutionary conservation Motifs have been discovered by studying similar genes in different species. For example, by aligning the amino acid sequences specified by the GCM (glial cells missing) gene in man, mouse and D.
II. PROPOSEDSCHEME
A. Self Organizing Map Neural Network:
A self – organizing map (SOM) or self – organizing feature map (SOFM) is a type of artificial neural network (ANN) that is trained using unsupervised learning to produce a low – dimensional (typically two – dimensional), discretized representation of the input space of the training samples, called a map[21]. Self – organizing maps are different from other artificial neural networks in the sense that they use a neighborhood function to preserve the topological properties of the input space.[8]
Figure: 1
Figure 1. A self-organizing map showing two boxes show clustering and distances while the remaining ones show the component planes. Red means a yes vote while blue means a no vote in the component planes (except the party component where red is
The main objective the Self Organizing map is to transform an incoming arbitrary signal direction into one or two dimensional discrete map. [15][13]
This makes SOMs useful for dimensional views of high-dimensional data, akin to as an artificial neural network by the called a Kohonen map or network.[1][2].
Like most artificial neural networks, SOMs operate in the following modes: Initialization, Competition, Cooperation and Adaptation. "In the Initialization all the connection weights are initialized with small random values. In the competition the particular DNA with smallest value of discriminant function is declared the winner. In the cooperation the winning DNA have cooperation with the neighbor DNA. In the Adaptation, the DNA is enhanced[23].
A self-organizing map consists of components called nodes or neurons. Associated with each node is a weight
vector of the same dimension as the input data vectors and a position in the map space. The usual arrangement of nodes is a two-dimensional regular spacing in a describes a mapping from a higher dimensional input space to a lower dimensional map space. The procedure for placing a vector from data space onto the map is to find the node with the closest (smallest distance metric) weight vector to the data space vector[23]. While it is typical to consider this type of network structure as related to attached, this type of architecture is fundamentally different in arrangement and motivation. Useful extensions include usin using large numbers of nodes. It is also common to use the
The U-Matrix value of a particular node is the average distance between the node and its closest neighbors.[4][22] In a square grid, for instance, we might consider the closest 4 or 8 nodes (the nodes in a hexagonal grid. Large SOMs display properties which are emergent. In maps consisting of thousands of nodes, it is possible to perform cluster operations on the map itself.[5]
The Detection of Regulatory Motif in Eukaryotes by Self Organizing Map Neural Networks makes use of the Self Organizing Map Neural Network for the purpose of maximum discrimination of the input that are present in the input space.[4][13][15][22]
The Self Organizing Map undergoes training in the detection of Regulatory Motif in Eukaryotes by Self Organizing Map Neural Networks.[13][15]
The Architectural setup of Self Organizing Map Neural Network is the lattice size (U = R × C)is arbitrarily chosen. The default size is 15 × 15s. Each node’s model, Θi, is initialized with random values.[15]
The training is performed by following the steps given below. They are,
a. Let the BMU index for a k-mer K is q(K). b. for epoch=1 to max_epoch do
c. for each K Î Xdo
d. Compute Θi (K),∀i = 1, …,U. e. Find the BMU of K as q K i K i
Interpretation
Figure.2 One-dimensional SOM versus principal component analysis (PCA) for data approximation. SOM is a red component is presented by a blue line. Data points are the small grey circles. For PCA, the 6.86%[9]
The Self Organizing Map can be interpreted in two ways.[15] Because while performing the training phase of the detection of Regulatory Motif in Eukaryotes by Self Organizing Map Neural Networks, the weights of the whole nearby nodes or neurons start moving in the same direction so that the adjacent neurons or nodes are formed.[15] This may be visualized by a between weight vectors of neighboring cells) of the SOM [3] [4]. The other way is to think of neuronal weights as pointers to the input space. They form a discrete approximation of the distribution of training samples. More neurons point to regions with high training sample concentration and fewer where the samples are scarce.SOM may be considered a nonlinear generalization of both artificial and real geophysical data, that SOM has many advantage over the conventional feature extraction methods such as Empirical Orthogonal Functions (EOF) or PCA. [11] [12] [19]
During the training phase itself the similar neurons or nodes are grouped together while the different neurons or nodes are placed apart. Moreover the weights of the similar neurons or nodes can be used as the pointers of the input. These input values are discrete in number. So the training takes place frequently where the similar neuron or nodes are arranged and the training takes place at very scarce amount where the dissimilar neuron or nodes are arranged.[14].
Moreover Self Organizing Map is not a solution to an optimization problem. [15]
So the training helps to separate the Adenaine, Thymine, Guanine, Cytosine separately and the weights of the Adenaine, Thymine, Guanine and Cytosine can be calculated.
B. Position Scoring Specific Matrix:
The Position Specific Scoring Matrix can be used for the representation of the Regulatory Motifs in the Bioinformatics.[1]
Position-specific scoring matrices (PSSM) offer a flexible way to represent the specificity of transcription factor/DNA interactions. PSSM can be built on the basis of a set of known binding sites for the factor of interest.
The Position Specific Scoring Matrix is used to match the weight of the DNA Sequence separately with the weight of the Adenaine, Thymine, Guanine and Cytosine. The Position Specific Scoring Matrix can able to match the DNA Sequence of fixed length only. The Position Specific Scoring Matrix can be calculated using the following formula:S = ( Sj )N j=1 is defined as ∑Nj=1msj,j, where ‘j’ represents position in the substring, Sj is the symbol at position ‘j’ in the substring, and ‘mαj’ is the score in row ‘α’, column ‘j’ of the matrix.
The Following is the Position of the Adenaine, Thymine, Guanine and Cytosine in the Detection of Regulatory Motif in Eukaryotes by Self Organizing Map Neural Network whose DNA Sequences are taken from the TRANSFAC database for the transcription factor AP-1: [15]
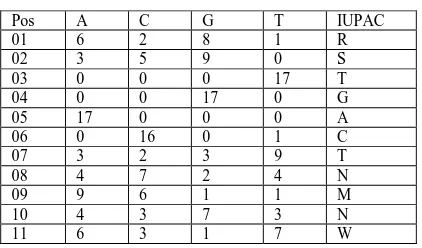
Table 1. Position Weight Matrix
Pos A C G T IUPAC
The first column specifies the position, the second column contains the number of occurrences of A at that position, the third column contains the number of occurrences of C at that position, the fourth column contains the number of occurrences of G at that position, the fifth column contains the number of occurrences of T at that position, and the last column contains the IUPAC notation for that position. Note that the sums of occurrences for A, C, G, and T for each row should be equal because the PFM is derived from aggregating several consensus sequences.[20] While Comparing the existing project with this project the Position Specific Scoring Matrix is more efficient because it does not involve any unwanted data for finding the position of the regulatory motif and it searches for the regulatory motif globally.
C. Hybrid Analysis Model:
The Hybrid Analysis Model is used in the Bioinformatics for finding the interaction of proteins in the DNA Sequences.[1][2] [3] by the binding the proteins of the DNA Molecule.
The Hybrid Analysis Model is used to find the exact position of the transcription factor binding site while the other techniques find only the position of the components of the DNA Sequences.[17]
The transcription factor is the Small DNA Sequences which are found to be different from other DNA Sequences. In a human body, the entire body has same type of DNA Sequences. Only if there is any irregularities in the body, we can able to find the change in the DNA Sequences and the changed DNA sequences are said to be transcription factor. The position where the transcription factor is attached is called transcription factor binding site.[16][18][19]
The transcriptional control is governed by the large number of proteins called transcription factor. And the Gene is regulated by the binding of the transcription factor on the DNA Sequences known as Transcription factor binding site.[16]
This hybrid node model components perform soft-competition through an adaptive weighting scheme within a node to represent the mixture of signals in it. Then hypothesized that, the fitness of each model’s components (i.e., PSSM and MC) with respect to the sequences in a node, is a fuzzy indication of its signal class composition.[17][18]
can be found directly if the position of the Adenaine, Thymine, Guanine and Cytosine is found.[16]
III. SIMULATIONRESULT
The Proposed project finds the position and weight of the Adenaine, Guanine, Thymine and Cytosine. The time complexity is very less compared to that of the existing project.
The Position Scoring can be illustrated by the following Graph in fig.3
Figure 3. Position Scoring Map on A-Adenaine
The Proposed project finds the position and weight of the Adenaine, Guanine, Thymine and Cytosine. So that the transcription factor binding site and the transcription factor can be identified using these positions.[16] The time complexity is very less when compared to that of the existing project.
The differences between the time complexity and the efficiency of the existing project and the proposed project is shown in the Fig.1
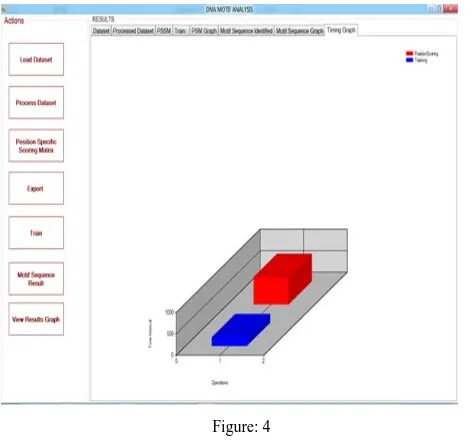
Figure: 4
In the Fig.1 the Blue Color Bar shows the Time Complexity of the the proposed project Detection of Regulatory Motif of Eukaryotes by Self Organising Map and the Red Color Bar shows the Time Complexity of the
existing project Motif Discovery by Cluster Refinement Algorithm. Comparing the Two bar diagrams we can able to find that the time complexity of the proposed project is very less and the efficiency is very high.
IV. CONCLUSION
Motif discovery in DNA datasets is a challenging problem domain because of our lack of understanding of the nature of the data, and the mechanisms to which proteins recognize and interact with its binding sites are still perplexing to biologist. Hence, predicting binding sites by using computational algorithms is still far from satisfaction.
In this paper, we have proposed a SOM based Extraction Algorithm (SOMEA) for simultaneous identification of multiple-motifs in DNA dataset. We have made two main contributions in this work. Firstly, it is shown that, the use of node model that considers the distinct properties of the motif and background signals is helpful in mining DNA motifs.
V. REFERENCES
[1] Kohonen, Teuvo; Honkela, Timo (2007). “Kohonen
Network” Scholarpdia
[2] Kohonen, Teuvo (1982), “Self – Organized Formation of Topologically Correct Feature Maps”
[3] Ultsch, Alfred; Siemon, H Peter (1990). “Kohonen’s Self Organizing Feature Maps for Exploratory Data Analysis”. In Widrow, Bernard; Angeniol, Bernard. Proceedings of the International Neural Network Conference (INNC – 90). Paris,France, July 9 – 13, 1990 1, Dordrecht.
[4] Kohonen T: Self – Organizing maps. 3rd edition Springer series in information sciences. 30 Springer; 2001.
[5] Ultsch, Alfred (2007). “Emergence in Self – Organizing Feature Maps” In Ritter, H : Haschke, R.Proceedings of the 6th International Workshop on Self – Organizing Maps (WSOM ’07).
[6] Moses A, Chiang D, Kellis M.Lander E, Eisen M: Position Specific variation in the rate of evolution in transcription factor binding sites. BMC Evolutionary Biology 3:19.
[7] Pavesi G, Mauri G, Pesole G: An algorithm for finding
signals of unknown length in DNA sequences. Bioinformatics 2001.
[8] Roth FP, Hughes JD, Estep PW, Church GM:Finding DNA
regulatory motifs within unaligned noncoding sequences clustered by whole – genome MRNA quantitation. Nat Biotechnol 1998.
[9] Illustration is prepared using free software : Mirkes, Evgeny M.; Principal Component Analysis and Self – Organizing Maps:applet, University of Leicester, 2011.
[10] Ultsch, Alfred (2003); U*-Matriz: A tool to visualize clusters in high dimensional data, Department of Computer Science, University of Marburg, Technical Report Nr.36:1-12.
(LNCSE), Vol.58, Berlin, Germany : pringer, 2007, ISBN 978-3-540-73749-0.
[12] Liu, Yonggang; and Weisberg, Robert H.(2005); Patterns of Ocean Current Variability on the West Florida Shelf Using the Self – Organizing Map, Journal of Geophysical Research, 110. C06003.
[13] Liu, Yonggang; Weisberg, Robert H; and Mooers
Christopher N.K. (2006); Performance Evaluation of the Self _ Organizing Map for Feature Extraction, Journal of Geophysical Research, 111, C05018, doi;10.1029/2005jc003117.
[14] Heskes, Tom; Energy Functions for Self – Organizing Maps, in Oja, Erkkil; and Kaski, Samuel (Eds.), Kohonen Maps, Elsevier, 1999.
[15] Kaski, Samuel (1997) “Data Exploration Using Self –
Organizing Map”. Acta Polytechnica Scandinavica Mathematics, Computing and Management in Engineering Series No.82 (Espoo, Finland: Finnish Academy of Technology). ISBN 952 – 5148 – 13 – 0.
[16] Ben – Gal I, Shani A, Gohr A, Grau J, Aryiv S, Shmilovice A, Posch S, Grosse I (2005). Identification of Transcription factor Binding Sites with Variable – Order Bayesian
Networks”. Bioinformatics 21(11):26572666.doi:10.1093/bioinformatics/bti410.PMID
15797905.
[17] Young K(1998). “Yeast two – hybrid:so many interactions, (in) so little time.” Biol Repord 58 (2): 302 – 11 doi:10, 1095/biolreprod58.2.302.PMID 9475380
[18] Joung J, Ramm E, Pabo C (2000). “A bacterial two hybrid selection system for studying protein – DNA and protein – protein interactions”. Proc. Natl. Acad. Sci. U.S.A. 97(13):7382 – Natl. Acad. Sci U.S.A. 97(13): 7382 – 20.
Bibcode : 2000PNAS…97.782J. doi:10.1073/PNAS.110149297. PMC 16554 PMID
10852947,
[19] Hurt J, Thibodeau S, Hirsh A, Pabo C, Joung J 2003).
“Highly specific zinc finger proteins obtained by directed domain shuffling and cell – based selection”. Proc. Natl. Acad. Sci. U.S.A.
[20] Bailey TL, Elkan C: Unsupervised learning of multiple
motifs in biopolymers using expectation maximization. Machine Learning 1995, 21:51-80.
[21] Ferran EA, Ferrara P: Clustering proteins into families using artificial neural networks. Comput. Appl. Biosci 1992, 8:39-44.
[22] Giuliano F, Arrigo P, Scalia F, Cardo PP, Damiani G:
Potent6ioally functional regions of nucleic acids recognized by a Kohonen’s Self – Organizing map. Comput. Appl. Biosci 1993, 9(6):687-693.