pISSN 2320-1770 | eISSN 2320-1789
Research Article
Comparison of mathematical indices of insulin resistance for clinical
application in the four phenotypes of polycystic ovarian syndrome
Amita Ray
1*, Arun G.
2, Sujaya V. Rao
3INTRODUCTION
The diagnostic criteria for PCOS has seen a lot of changes since Stein and Levinthal described this syndrome.1-3 Though not required for diagnosis, insulin resistance (IR) plays a crucial role in PCOS and its sequel.4,5 Whether PCOS is as a result of IR or results in IR is a controversial point. There may be an opinion that
all women with PCOS are insulin resistant but there are large differences in the levels of this resistance.4-6
PCOS is known for its reproductive manifestations in the form of disturbances in ovulation and reduction in fertility, however it is the metabolic disturbances in the form of impaired glucose tolerance and diabetes that lead to life threatening complications.7-9 These metabolic disturbances are a direct result of IR and therefore it is
1Department of Obstetrics and Gynecology, 2Department of Community Medicine, DM Wayanad Institute of Medical
Sciences, Wayanad, Kerala, India
3Department of Obstetrics and Gynecology, Father Muller Medical College, Mangalore, Karnataka India
Received: 04 August 2016
Accepted: 12 August 2016
*Correspondence:
Dr.Amita Ray,
E-mail: [email protected]
Copyright: © the author(s), publisher and licensee Medip Academy. This is an open-access article distributed under the terms of the Creative Commons Attribution Non-Commercial License, which permits unrestricted non-commercial use, distribution, and reproduction in any medium, provided the original work is properly cited.
ABSTRACT
Background: Insulin resistance may not be essential for the diagnosis, but does play a crucial role in PCOS and contributes to significant morbidity and long term life threatening sequelae. The extent of this resistance differs in different phenotypes and is difficult to assess in clinical settings. In this study we used mathematical indices to assess insulin resistance across the whole PCOS spectrum and used cut off values to find whether all PCOS phenotypes were Insulin resistant.
Methods: 60 newly diagnosed PCOS participants were included in the study analysis. Depending upon their presentation these participants were grouped into 4 phenotypes. The two mathematical indices HOMA and QUICKI were calculated for each participant .The mean value of HOMA and QUICKI were calculated for each group and compared using ANOVA. A cut off value of >2.6 for HOMA and <0.33 for QUICKI was used to determine Insulin resistance.
Results: There was a significant difference in the degree of insulin resistance among the different phenotypes of PCOS. Not all PCOS women can be called insulin resistant when using certain cut off values for QUICKI and HOMA. The PCOM+MI+HA phenotype appears to be more resistant than all other phenotypes.
Conclusions: Insulin resistance is a not present universally and varies among all phenotypes of PCOS. In clinical setting simple mathematical indices could be used to identify these individuals and initiate appropriate therapy in order to prevent long term metabolic sequelae. Cut off values for both the indices need to take into account all factors that influence insulin sensitivity.
important clinically and epidemiologically to evaluate IR simply and accurately in individual PCOS and know which form/phenotype of PCOS has a greater predisposition for this. It would help the clinician to plan interventions and prevent long term effects.7,8
Insulin resistance (IR) has been broadly defined as “a state in which a greater than normal amount of insulin is required to elicit a quantitatively normal response”.11
Assessment of IR (or, conversely, insulin sensitivity) clinically can be done by several tests,
1. Determination of insulin levels, either at baseline (fasting) or after oral glucose tolerance testing(OGTT).12
2. Assessment of sequential plasma glucose levels after the IV administration of insulin (ITT).12 3. Estimation of an index of insulin sensitivity (Si) by
applying the minimal model technique to data obtained from the frequently sampled IV glucose tolerance test (FSIVGTT).13
4. Measurement of in vivo insulin mediated glucose disposal (M) by the euglycemic-hyperinsulinemic clamp procedure.14
The last one is considered the gold standard. However all these tests are tedious and require several samples of blood.
In comparison Homeostasis Model Assessment (HOMA) and Quantitative Insulin Sensitivity Check Index (QUICKI ) two mathematical indices derived from fasting insulin and glucose levels are easier to calculate ,need only one blood sample from which these two parameters can be assessed and quite adequately reflect insulin sensitivity.15 Both postulate that elevated fasting glucose levels reflect a compensatory mechanism that maintain fasting insulin levels when there is a reduced insulin secretory capacity, and also that fasting insulin levels are elevated in direct proportion to diminished insulin sensitivity. The parameters have already been assessed by various workers and correlated with the Euglycemic-Hyperinsulinemic Clamp Studies that is considered the gold standard method for the assessment of IR though not suitable for routine clinical work.15,16
QUICKI has been found to have a better correlation. Whereas HOMA and QUICKI have a negative correlation between each other.15,16
Objectives
We conducted this study to see how these indices differ in the different PCOS phenotypes and whether it is worthwhile calculating these mathematical indices in young PCOS to determine their insulin resistance and thereby their predisposition towards metabolic sequelae in later life.
We also compared insulin resistance in PCOS when defined by Rotterdam versus Androgen Excess Society (AES) criteria.
Using a cut off value for the two indices we tried to identify actual IR in the four phenotypes and also the difference in IR when PCOS was defined as per Rotterdam criteria versus PCOS defined as per AES criteria.
METHODS
The cases included in this study were collected from three medical colleges and all of them were medical undergraduates from these colleges .Institutional Review Board approval was sought and obtained from all three. All students gave informed consent. 90 cases met the Rotterdam criteria of polycystic ovarian syndrome. The cases were all newly diagnosed ones .We did not include those which had already been diagnosed and were taking treatment. The cases were between the ages of 18-25 yrs. The data was collected over a period of 2 years. Each included case met the polycystic ovarian syndrome diagnosis as recommended by Rotterdam criteria and secondary causes such as non-classical 21-hydroxylase deficiencies, hyper-prolactinemia and androgen secreting neoplasm were excluded.
Detailed history was taken and examination was conducted for features of hirsuitism, acne, acanthosis nigricans and androgenic alopecia .Body Mass Index (BMI) was also calculated.
The cases were divided into four groups as per the 4 phenotypes of PCOS as follows
Group 1- Menstrual irregularity (MI)+ polycystic ovarian morphology (PCOM)
Group 2- Polycystic ovarian morphology (PCOM)+hyperandrogenism (HA)
Group 3- Menstrual irregularity (MI)+hyperandrogenism (HA)
Group 4- Polycystic ovarian morphology (PCOM)+ Menstrual irregularity (MI) + hyperandrogenism (HA)
The features for allotting the phenotypes were taken as follows;
Menstrual Irregularity (MI) was defined as menstrual cycle interval more than 35 days or less than 8 bleeding episodes in one year.
Polycystic Ovarian Morphology (PCOM) was defined by Ultrasound when more than 12 follicles between 2-9 mm were present in either or both ovaries or ovarian volume of either ovary was more than 10 cc.
Investigations
Blood samples for baseline measurements were collected after an overnight fast on day 2 or day 3 of the menstrual cycle or randomly in the case of amenorrhea. All these patients were tested for fasting sugar and fasting insulin levels. In addition thyroid profile, prolactin levels and 17-OH Progesterone derivatives were done as a part of exclusion. Oral glucose tolerance test (OGTT) was done if fasting glucose level exceeded 110 mg/dL to exclude diabetes mellitus or impaired glucose tolerance.
For measuring insulin resistance/insulin sensitivity we used the mathematical indices HOMA and QUICKI.
HOMA was calculated using the formula- HOMA = fasting insulin (µu/mL) x fasting glucose (mmol/L)/22.5.
QUICKI was calculated by the formula- QUICKI = 1/[Log (fasting) insulin + Log (fasting) glucose]
We used a cut off value of >2.6 for HOMA, this would mean any participant having a value above would be considered as IR. The cut off value for QUICKI was <0.33, this would mean any participant having a value below would be considered IR.
Statistical analysis: The demographic variables have been represented using mean±SD.
The comparison of HOMA and QUICKI among the phenotypes has been done using ANOVA test followed by Tukey’s post hoc test where ever it was necessary.
For the AES vs rotterdam comparison the HOMA values has been compared using Independent sample test and the comparison between QUICKI values has been made using Man Whitney U test.
The number of people who were identified as IR either by HOMA or QUICKI cut offs were expressed as percentages.
Statistical analysis has been performed using R Software.
RESULTS
A total of 90 students met the Rotterdam diagnostic criteria of PCOS from all three centres. The PCOM+MI (n=31) phenotype was the commonest. The least numbers were of the MI+HA phenotype (n=15). 60 subjects were
randomly included for the analysis (15 from each phenotype). The randomisation was done to make the number of subjects in each phenotype equal and make the comparison meaningful.
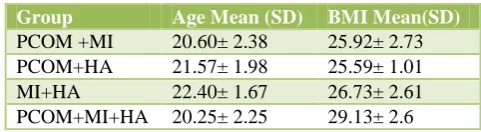
The age of the participants ranged from 18-25 years. There was no significant difference in the age and the BMI of the four phenotypes (Table 1).
Table 1: Mean age and BMI of the four PCOS phenotypes.
Group Age Mean (SD) BMI Mean(SD)
PCOM +MI 20.60± 2.38 25.92± 2.73 PCOM+HA 21.57± 1.98 25.59± 1.01 MI+HA 22.40± 1.67 26.73± 2.61 PCOM+MI+HA 20.25± 2.25 29.13± 2.6
There is a significant difference among the HOMA values in all the four groups* (ANOVA P value <0.001) and on post hoc analysis we found a significant difference between group 1 as compared to group 2 (p value < 0.0125 )and a significant difference between the group 3 and group 4 (p value< 0.0125) (Table 2).
Table 2: Comparison of HOMA values in the four phenotypes.
Group Mean SD P value
PCOM+MI 2.36 0.019
<0.001 PCOM+HA 3.06 0.25
MI+HA 4.16 0.026 PCOM+MI+HA 5.19 0.057
There is a significant difference among the QUICKI values in all the four groups* (ANOVA P value<0.001) and on post hoc analysis we found a significant difference between Group 1 as compared to group 2 (P value<0.0125) and a significant difference between the group 3 and group 4 (P value< 0.0125) (Table 3).
Table 3: Comparison of QUICKI in the four groups.
Group Mean SD P value
PCOM+MI 0.3397 0.0119
<0.001 PCOM+HA 0.3111 0.0118
MI+HA 0.2894 0.0082 PCOM+MI+HA 0.2500 0.0106
The HOMA value for the AES patients is significantly (p<0.001) higher than that of Rotterdam group. The QUICKI value of AES participants is significantly (p<0.001) lesser than that of the Rotterdam Group (Table 4).
participants in were IR. In rest of the two phenotypes all participants were IR (Table 5).
Table 4: Comparison of HOMA and QUICKI in the Rotterdam and AES.
*Independent sample t test, ** Man Whitney U test
Table 5: Insulin resistance as per a HOMA cut off of >2.6.
When taking the QUICKI cut off of < 0.33 we found that all the participants in the latter three phenotypes were IR. The PCOM + MI category had 34% IR participants (Table 6).
Table 6: Insulin resistance as per a QUICKI cut off of <0.33. heterogeneous manifestations. Though the concept of insulin resistance is easy to understand, who is insulin resistant and to what extent, is difficult to assess and measure in a clinical setting. Insulin resistance is an important component of PCOS. It has been suggested that all women with PCOS should be considered as insulin resistant. But this recommendation does not account for the wide variations in insulin resistance among women with PCOS. Thus it is important to try to assess whether the whole spectrum (all phenotypes) of PCOS exhibit insulin resistance and to what extent, as insulin resistance is what leads to long term, life threatening sequelae. Counseling, therapeutic regimens, life style changes and other measures could then be tailored and monitored depending on this assessment.
In our study we used two mathematical indices to assess differences in insulin resistance in the various phenotypes
of PCOS according to the Rotterdam criteria and also to compare the same between PCOS as diagnosed by Rotterdam versus those diagnosed by AES criteria. These indices are easy to calculate, require a single blood sample and therefore are suitable for clinical practice even in resource poor settings. These two indices are also well correlated to the gold standard (euglycemic- hyperinsulenemic clamp) for measurement of insulin resistance.14
As with several other studies we too found a negative co-relation between the two mathematical indices HOMA and QUICKI.15-17
We found a considerable difference in the levels of insulin resistance, as estimated by the two indices, among the different phenotypes of PCOS.
The phenotype of PCOM+MI+HA showed the least insulin sensitivity\maximum insulin resistance when compared to the other phenotypes. The mean HOMA value was the highest and the mean QUICKI value was lowest in this group. We do not know of any study which has done such a comparison.
When we compared the indices in the PCOS Rotterdam versus the PCOS AES group we found the latter group to be more insulin resistant than the former The Androgen Excess Society has specified that PCOS be first considered as a disorder of hyperandrogenism.2 It is an established fact that hyperandrogenism induces insulin resistance.18-21
By the above criteria the clinical implications that can be drawn are that the particular phenotype of PCOM+MI+HA are more insulin resistant and therefore susceptible to long term metabolic sequelae. Same would apply for the PCOS which are diagnosed as per the AES criteria than those that fall into the Rotterdam criteria. These groups would therefore be benefitted by measures to increase insulin sensitivity and would need to be monitored more frequently for long term effects.
There may be some factors to take into account before coming to the above conclusions. There are many factors that influence insulin sensitivity as age, gender, genetics, ethinicity, BMI and metabolic syndrome.5-7 There is no gender or ethinicity variation and not much age variation in our study group but it has not taken into consideration BMI and metabolic syndrome, both of which are associated with PCOS. Future studies could take into account the role of these two when assessing IR in PCOS using the two mathematical indices.
We used a cut off values of these two indices to see whether all PCOS were Insulin resistant.22
phenotypes universally exhibited insulin resistance but none of the PCOM+MI phenotypes had insulin resistance
Using a QUICKI cut off of <0.33 to mean insulin resistance we found more cases to be so .All cases in the later three phenotypes and about 34% in the PCOM+MI were insulin resistant.
As with the previous conclusions the above conclusion too has not taken into account the other factors that affect insulin resistance (mainly BMI and metabolic syndrome)
There are several studies which have tried to find cut off values for both HOMA and QUICKI to detect Insulin Resistance for different clinical conditions, (mainly type 2 diabetes) and in different populations.22-24 We used the cut off values of HOMA and QUICKI as per a study that was similar in ethnicity and geographical location to our study. This was a pilot study done to test the surrogate markers of Insulin resistance in type 2 diabetics.22
Our study has tried to use the easily obtainable mathematical indices of insulin resistance to measure the same in various phenotypes of PCOS and thus tailor treatment in a clinical setting. It has concluded that there are differences in insulin sensitivities. Further studies with a larger number of participants would consolidate or refute our findings.
Increasing the number of participants and comparing with healthy controls could help find cut off values for these indices for different populations serving as benchmarks to start interventions targeted at increasing insulin sensitivity. Also further research would be conducted with the aim to find out whether QUICKI identifies more PCOS subjects as IR as compared to HOMA. In this context our study had very limited number of participants to make a meaningful conclusion. with data of the participants from his college.
Funding: No funding sources Conflict of interest: None declared
Ethical approval: The study was approved by the Institutional Ethics Committee
REFERENCES
1. Belosi C, Selvaggi L, Apa R, Guido M, Romualdi D, Fulghesu AM, et al. Is the PCOS diagnosis solved by ESHRE/ASRM 2003 consensus or could it include
ultrasound examination of the ovarian stroma? Hum Reprod. 2006;21(12):3108-15.
2. Azziz R, Carmina E, Dewailly D, Diamanti-Kandarakis E, Escobar- Morreale HF, Futterweit W, et al. The Androgen Excess and PCOS Society criteria for the polycystic ovary syndrome: the complete task force report. Fertil Steril. 2009;91(2):456-88.
3. Fauser CJM, Tarlatzis BC, Rebar RW. Consensus on women’s health aspects of polycystic ovary syndrome (PCOS): the Amsterdam ESHRE/ASRM-sponsored 3rd PCOS consensus workshop group,” Fertility and Sterility. 2012;97(1):25-38.
4. Rojas J, Chávez M, Olivar L, Rojas M, Morillo J, Mejías J, Calvo M, Bermúdez V. Polycystic ovary syndrome, insulin resistance, and obesity: navigating the pathophysiologic labyrinth. Intern J Reprod Med. 2014;2014:1-17.
5. Toprak S, Yonem A, Cakir B. Insulin resistance in non-obese patients with polycystic ovary syndrome. Hormone Res. 2001;55(2):65-70.
6. Carmina E, Lobo RA. Use of fasting blood to assess the prevalence of insulin resistance in women with polycystic ovary syndrome. Fertility and Sterility. 2004;82(3):661-5.
7. Diamanti-Kandarakis E , Dunaif A. Insulin resistance and the polycystic ovary syndrome revisited: an update on mechanisms and implications. Endocrine Reviews. 2012;33(6):981-1030.
8. Pauli JM, Raja-Khan N, Wu X, Legro RS. Current perspectives of insulin resistance and polycystic ovary syndrome. Diabetic Med. 2011;28(12):1445-54.
9. Wild RA, Carmina E, Diamanti-Kandarakis E, Dokras A, Escobar-Morreale AF, Futterweit W, et al. Assessment of cardiovascular risk and prevention of cardiovascular disease in women with the polycystic ovary syndrome: a consensus statement by the androgen excess and polycystic ovary syndrome (AE-PCOS). Society J Clin Endocrinol Metab. 2010:95(5):2038-49.
10. Traub ML. Assessing and treating insulin resistance in women with polycystic ovarian syndrome. World J Diabetes. 2011;2(3):33-40.
11. Mantzoros CS, Flier JS. Insulin resistance: the clinical spectrum. In: Mazzaferi E, ed. Advances in endocrinology and metabolism. St. Louis: Mosby-Year Book; 1995;6:193-232.
12. Vidal-Puig A, Moller DE. Insulin resistance: Classification, prevalence, clinical manifestations, and diagnosis. In: Azziz R, Nestler JE Dewailly D, eds. Androgen excess disorders in women. Philadelphia: Lippincott Raven;1977:227-236. 13. Bergman RN. Towards physiological understanding
of glucose tolerance: minimal model approach Diabetes. 1989;38:1512-7.
euglycemic glucose clamp. J Clin Invest. 1987;79:790-800.
15. Katz A, Nambi SS, Mather K, Baron AD, Follmann DA, Sullivan G, et al. Quantitative insulin sensitivity check index: a simple, accurate method for assessing insulin sensitivity in humans. The J Clin Endocrinol Metabol. 2000;85(7):2402-10.
16. Hisayo Y, Emoto M, Fujiwara S, Motoyama K, Morioka T, Komatsu M, et al. Quantitative insulin sensitivity check index and the reciprocal index of homeostasis model assessment in normal range weight and moderately obese type 2 diabetic patients. Diabetes Care. 2003;26:2426-32.
17. Bhattacharya SM. Mathematical indices of insulin resistance and body mass index in polycystic ovarian syndrome J Obstet Gynecol India. 2005;55(2):159-62.
18. Ek I, Arner P, Rydén M. A unique defect in the regulation of visceral fat cell lipolysis in the polycystic ovary syndrome as an early link to insulin resistance. Diabetes. 2002;51:484-92.
19. Rincon J, Holmäng A, Wahlström EO. Mechanisms behind insulin resistance in rat skeletal muscle after oophorectomy and additional testosterone treatment. Diabetes. 1996;45:615-121.
20. Zang H, Carlström K, Arner P, Hirschberg AL. Effects of treatment with testosterone alone or in
combination with estrogen on insulin sensitivity in postmenopausal women. Fertil Steril. 2006;86:136-44.
21. Zang H, Rydén M, Wåhlen K, Dahlman-Wrigth K, Arner P, Hirschberg AL. Effects of testosterone and estrogen treatment on lipolysis signaling pathways in subcutaneous adipose tissue of postmenopausal women. Fertil Steril. 2007;88:100-6.
22. Hettihawa LM, Palangasinghe S, Jayasinghe SS, Gunasekara SW, Weerarathna TP. Comparison of insulin resistance by indirect methods-HOMA, QUICKI and McAuley-with fasting insulin in patients with type 2 diabetes in Galle, Sri Lanka: A pilot study. Online J Health Allied Scs. 2006;1:2-6. 23. Lee S, Choi S, Kim H J, Chung Y C, Lee K W, Lee
H C, Huh K B, et al. Cut off values of surrogate measures of insulin resistance for metabolic syndrome in Korean non-diabetic adults. J Korean Med Sci. 2006;21:695-700.
24. Gayoso-Diz P, Otero-González A, Rodriguez-Alvarez MX, Gude F, García F. Insulin resistance (HOMA-IR) cut-off values and the metabolic syndrome in a general adult population: effect of gender and age: EPIRCE cross-sectional study BMC. Endocrine Disorders. 2013;13:47.