2832
A Statistical Feature Extraction Approach to Detect
Executed Movement from EEG signals
Shah Chintan Pankajbhai
1, Dr. V. A. Shah
2,
Assistant Professor, Biomedical Engineering Department, GEC, Gandhinagar, Gujarat, India1 Professor and Head, Instrumentation and Control Engg. Department, DD University, Nadiad, Gujarat, India2
Email: [email protected]1, [email protected]
Abstract- Executed movement detection from Electroencephalogram (EEG) signal is comparative very difficult task than analyzing any other physiological signal. Normally movements in motor region is differentiated on basis of frequency present in the measured EEG signals. Using filtering of EEG signal in beta band we can determine movement. But applications like Brain Computer Interface requires exact information about hand or leg movement performed by subject. The frequency analysis only predict whether movement is present or not but cannot predict which limb is acting. In this paper we have addressed above phenomenon using statistical feature extraction method which differentiates between limb movements. We have utilized 1st and 2nd order derivatives in conjunction with Principal Component Analysis (PCA) to extract features. This features are than classified by Linear Discriminant Analysis (LDA) and Artificial Neural Network (ANN). We have also compared frequency domain features against Statistical features yielded by our method.
Index Terms- Electroencephalogram, Brain Computer Analysis, Executed Movement, Principal Component Analysis, Linear Discriminant Analysis, Statistical features, Frequency domain features
1. INTRODUCTION
EEG signal analysis is complicated task due to so many reasons like Number of channels are high, Nonlinearity embedded in signals, superimposition of electrical activity of surrounded area on scalp surface, electrode position can vary subject to subject basis. Due to these multiple problems movement detection in any noisy environment becomes difficult. But luckily we can map brain activity because different brain parts are responsible for different activity. In general motor activity is taking place at sensory-motor region of brain located at central region. On scalp surface central region is activated during motor activity of limbs. But due to superimposition of electrical activity of surrounding brain parts and nonlinearity present in signal detection task becomes difficult. Several methods used to detect movement from EEG data using Frequency domain features as well Statistical domain features.
Turky Alotaiby et. al. have compared different channel reduction algorithm to find optimal channel for movement detection[1]. They have used all different methods like time-domain analysis, power spectral estimation and wavelet to remove insignificant channel. They have also done performance evaluation of selected channels using filtering, wrapper, hybrid and human-based technique [2]. Dragoljub Gajic et. al. have used wavelets and statistical pattern recognition to detect epileptic
seizures [3]. In their approach they have used wavelet method to determine coefficient of high frequencies and lower frequencies. This coefficients are then fed to statistical method like PCA to reduce dimensions. This wavelet-statistical features than classified by using Quadratic Discriminative function. Arnaud Delorme et. al. have used higher order statistics and different algorithms of Independent Component Analysis (ICA) to remove artifacts from EEG data[4].
2833 performed comparison of different statistical classifier
using power spectrum features[10] [11]. They have estimated power spectrum density of channels located in central region of brain using hanning window method. Juan-AntonioMartinez et. al. have used statistical and Neuro-fuzzy technique for feature selection[12]. They have used electrodes in central region of scalp. Based on frequency different statistical features were selected and their score were evaluated to determine optimal feature set for classification. With this method S-dFasArt test also performed and common feature set with statistical method were selected.
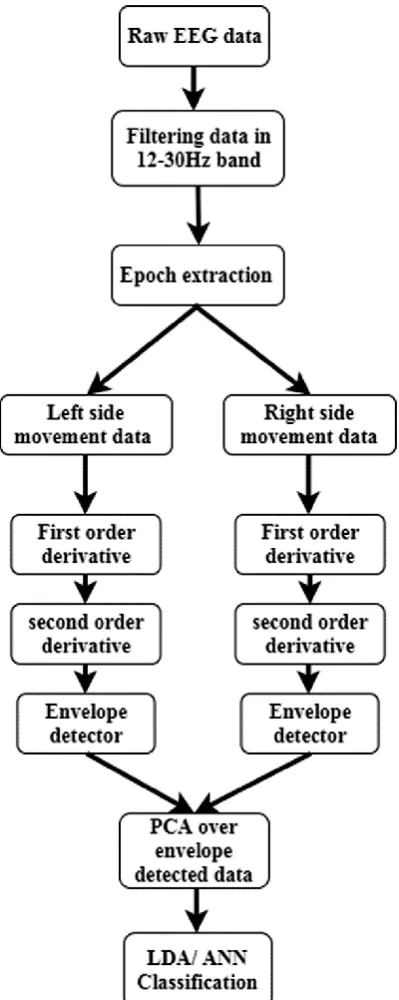
As discussed here frequency filtering only provides information about motor activity presence any brain part but to classify it, we require statistical method to differentiate between different motor activities. We have used filtering of data in beta and theta region These features are further passed through envelope detector to normalize its variation. These envelopes are passed to PCA for further reduction of Feature set. Finally these features are passed to classification methods ANN and LDA. The details of database used are discussed in next chapter.
2. DATABASE ITS AND PREPROCESSING
The database used here is publically available on physionet website. We have used EEG Motor Movement/ Imaginary Database (EEGMMIDB). This database is developed and contributed by Gerwin Schalk and his team. The database contains recording of total 109 normal subjects with actual and imagined movement. The signals were recorded by 10/10 system with 64 total EEG channels. All the subjects have performed total six movements as follows:
Eyes open
Eyes close
Left hand/ right hand actual movement
Left hand/ right hand imagined movement
Both fists/ both feet actual movement
Both fists/both feet imagined movement Above all movements are recorded in two sets with numerical encoding in dataset. The signals are recorded in accordance to queuing process where
subject alternatively asked to rest and perform any above activity. The queuing process displayed on screen with instructions and subject performs task until instruction disappears on screen. The database is encoded by event marked with T0, T1 and T2. T0 means resting state with no movement, T1 means either left hand movement actual/ imagined or both fists movement actual/ imagined and T2 means either right hand movement actual/ imagined of both feet movement actual/ imagined. For our analysis we have considered all the 64 channels available in dataset.
Fig. 1 Electrode location used in database
In our analysis the data is pre-filtered with 12 - 30 Hz band in order to locate beta activity of brain parts. The sampling rate is 160Hz and activity performed for 3 seconds brief time window. This data are extracted based on event marker and epochs are generated based on activity performed. We have focused on left or right hand actual movement only.
3. Proposed Methodology
2834 Following figure shows proposed method. We have
also provided comparison between 1st order and 2nd order differentiation accuracy separately.
Fig. 2 Proposed Methodology
3.1.Derivation of EEG epochs data
2
2
( ) and
( )
f x
f x
t
t
(1)
Differentiation of each channel will provide us zero crossing which will be helpful in identifying Event
Related Synchronization (ERD). Second order derivative will provides sign changes in signals, which gives us direction. This could lead us to differentiate between left hand and right hand movement. We have used MATLAB to produce differentiation across all channels of seven subjects used for this experiment. The fig. 3 shows original signal with its 1st and 2nd derivative. Total samples per channel are 657 because epoch recorded for 4.1 second for each trial.
Fig. 3 Original data VS 1st derivative
As seen from figure it is clear that 1st derivative of signal gives maximum deflation during sharp changes in signal. Due to sharp changes present information may be over fitted so we require smoothening of this signal. In same manner following fig. 4 contains results of original signal with 2nd order derivative. In this graph also sharp changes are present. We have performed envelope detector as smoothing operator for this signal.
Fig.4 Original VS 2nd derivative
3.2.Envelope detector
2835 part[13]. So envelope detection process can be shown
as in following equation.
2 2
( )
( )
( )
e t
x t
x t
(2) Where e(t) is envelope of signal, x(t) is original signal and ̂(t) is Hilbert transform.Here Hilbert transform will provides imaginary part of signal. it can be defined by following equation.
1
( )
Where F(t) is Hilbert transform of input signal f(x). Using above equation we can find analytical signal from original signal. Its absolute value is envelope of any signal. Following results are obtained by using envelope detection process.Fig. 5 Original VS 1st Envelop
In Fig. 5 it is clear that smoothing process reduces sharp changes in the signal. We can see that the event is slightly delayed due to envelope process. Reason for such delay is due to reduction in frequency component.
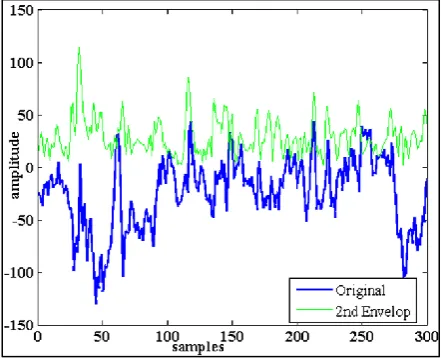
Fig. 6 Original VS 2nd envelop
In above figure it is clearly visible that during ERS we get spikes in smoothed data. This can form the basis for further analysis in statistical domain.
3.3.Principal Component Analysis
Principal Component Analysis (PCA) which is statistical process which can give weightage to features like signal repetition, spikes present and based on the change of this weightage it is possible to detect such events. PCA is statistical procedure which is divided into steps shown below.
Mean of all the signals (64-channels) and all subjects (7-subjects) to whiten the signals.
1 subtracting each subjects sample from mean. Signals are called as whitened signals.
i i their corresponding Eigen values. To find projection of data onto Eigen space. Multiply data matrix with sorted Eigen Vector to get Eigen space. Select feature vector from projected image according to highest weightage by Eigen value. For our experimental setup we get 34 features per subject.
3.4.Classification algorithms
2836 work we have implemented both methods in
MATLAB and results are discussed in next chapter.
4. Results and Discussion
4.1.Results
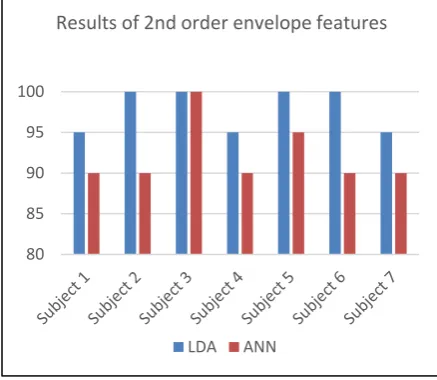
Using methodology discussed in section 3 we have generated following results. The charts are plotted according to features of 1st order envelop features and 2nd order envelop features separately. Following chart shows results of LDA and ANN with features of 2nd order envelope detector.
Table 1 Comparison of classification accuracy of LDA and ANN for 2nd order derivative feature set.
Table 2 Comparison of classification accuracy of LDA and ANN for 1st order derivative feature set.
From results of above two tables, 2nd order envelope features provides highest accuracy rates compared to 1st order envelope features. Another notable outcome classifier in neural network domain with more number of data set to achieve generalization. Another extension to this work could be reduction in number of EEG channels from total 64 to 5-6 channels so generalization to network becomes easier. Other higher order statistical features can be used in conjunction with PCA features to provide higher accuracy rate and improve robustness of algorithm.
REFERENCES
[1] T. Alotaiby, F. E. A. El-Samie, S. A. Alshebeili, and I. Ahmad, “A review of channel selection algorithms for EEG signal processing,” EURASIP J. Adv. Signal Process., vol. 2015, no. 1, 2015.
[2] L. Y. H Liu, “Toward integrating feature selection algorithms for classification and clustering.,” IEEE Trans. Knowl. Data Eng., vol. 17, no. 491–502, 2005.
[3] D. Gajic, Z. Djurovic, S. Di Gennaro, and F. Gustafsson, “Classification of Eeg Signals for Detection of Epileptic Seizures Based on Wavelets and Statistical Pattern Recognition,” Biomed. Eng. Appl. Basis Commun. vol. 26, no. 2, p. 1450021, 2014.
[4] A. Delorme, T. Sejnowski, and S. Makeig, “Enhanced detection of artifacts in EEG data using higher-order statistics and independent component analysis,” Neuroimage, vol. 34, no. 4, pp. 1443–1449, 2007.
[5] S. K. Bashar, A. B. Das, M. Imamul, and H. Bhuiyan, “Motor Imagery Movements Detection of EEG Signals using Statistical Features in the Dual Tree,” no. May, pp. 21–23, 2015.
[6] D. N. T. Bhattacharyya, Saugat, Anwesha Khasnobish, Amit Konar and and A. K. N. Wala, “Performance analysis of left or right hand movement classification from EEG signal by intelligent algorithms.,” Comput. Intell. Cogn. Algorithms, Mind, Brain (CCMB), IEEE Symp.,
80 85 90 95 100
Results of 2nd order envelope features
LDA ANN
Results of 1st order envelope features
2837 pp. 1–8, 2011.
[7] V. V Ramalingam, S. Mohan, B. R. J. Vadhanam, and V. Sugumaran, “Classification of EEG Signals for Prosthetic Limb Movements with ARMA Features Using C4 . 5 Decision Tree Algorithm,” vol. 9, no. December, 2016.
[8] T. Ghosh, P. Science, T. Biswas, and P. Science, “A Feature Extraction Scheme to Classify Motor Imagery Movements Based on Bi-spectrum Analysis of EEG,” IOSR J. VLSI Signal Process., vol. 6, no. 15, pp. 28–35, 2016.
[9] S. M. H. N. Kotoky, “Bispectrum Analysis of EEG for Motor Imagery Classification,” Proc.International Conf. Signal Process. Integr. Networks, pp. 581–586, 2014.
[10] O. Diana and A. Mihaela, “Comparison of Classifiers and Statistical Analysis for EEG Signals Used in Brain Computer Interface Motor Task Paradigm,” Int. J. Adv. Res. Artif. Intell., vol. 4, no. 1, pp. 8–12, 2015.
[11] P. C. A. Kachenoura, L. Albera, L. Senhadji, “ICA: A Potential Tool for BCI Systems”,” IEEE Signal Process. Mag. Inst. Electr. Electron. Eng., vol. 25, no. 1, pp. 57–68, 2008.
[12] J. A. Martinez-Leon, J. M. Cano-Izquierdo, and J. Ibarrola, “Feature selection applying statistical and neurofuzzy methods to EEG-based BCI,” Comput. Intell. Neurosci., vol. 2015, pp. 13–30, 2015.
[13] “WaveMetrics,”