DOI: http://dx.doi.org/10.26483/ijarcs.v9i2.5797
Volume 9, No. 2, March-April 2018
International Journal of Advanced Research in Computer Science
REVIEW ARTICLE
Available Online at www.ijarcs.info
ISSN No. 0976-5697
A COMPARATIVE STUDY ON PLANTS DISEASES DETECTION TECHNIQUES
USING IMAGES
Sanjana
Computer Engineering and Technology Guru Nanak Dev University
Amritsar, India
Chetan Marwaha
Computer Engineering and Technology Guru Nanak Dev University
Amritsar, India
Abstract: Food is basic necessity of any living being after air and water. Plants are the major part of food consumed by living being. But the presence of fungi, bacteria, viruses etc. cause diseases in fruits, vegetables and cereal crops which directly reduce the production of crops. Plant diseases can detect with the help of digital image processing which is not easily detected by human vision. This paper describes various techniques to analyse and detection of various diseases of fruits, vegetables and cereal crops.
Keywords: Digital image processing, Segmentation, Feature extraction, Classification.
I. INTRODUCTION
Plants are utile for every living being as most of the food human beings and animals get from the plants. The basic need food for every living being comes from plants in the form of fruits, vegetables, cereals and crops. Research by using computer technology in agriculture field increases the production and reduces the diseases in plants. If diagnosis of plant diseases detect at early stage, it can easily curable which increases the production.
The traditional way to detect fruits and vegetables diseases is human vision of experts. But this method is not economical and very time consuming. With this classical method, detection of diseases at initial stage is not possible . Computing devices and technologies are necessary for detection of initial symptoms of plants and vegetables diseases[1].
The main symptoms of diseases in plants are leaf rust, Chlorosis, fruit blotch, late blight etc. which have adverse impact on growth and production of plants. Farmers mainly used pesticides and insecticides to protect plants from bacteria, fungi, virus or pests. But overdose of these harmful chemicals have adverse affect on both plants and living beings[2]. Therefore it is necessary to use image processing techniques to detect and classified diseases of plants at initial stages.
[image:1.595.314.523.383.682.2]The objective of this paper to give a brief on basic steps of detection and identification of disease in plants using image processing. It is divided into some sections which are as follow. Section1 gives some introduction about plants diseases. Section 2 describes basic steps used by digital image processing in detection of diseases of plants. Section3 gives a brief literature review. Section4 shows a comparison table between techniques used in disease detection and classification of plants. Section5 gives results of existing literature in terms of Mean Square Error, Accuracy and Entropy. Section6 concludes this paper and tells about future scope.
II. STEPSFORDISEASEDETECTIONIN PLANTS
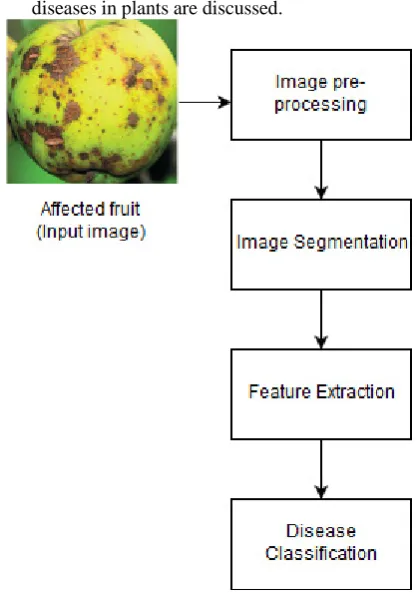
Some steps are used to detect and identify diseases in plants. In this section the main steps for detection of diseases in plants are discussed.
Figure 1. Basic Steps of Image Processing
A. Image Acquisition
B. Image Pre-processing
The next step after image acquisition is image preprocessing. In this step resizing of images, removal of noise, enhancement, smoothing is done. The main techniques used in this step are[21]:
1. Contrast Stretching: It is done when image is not easily interpretable. The different algorithm designed on the basis of a particular image. 2. Noise Filtering: This technique is used to
eliminates various forms of noise such as salt and pepper noise, periodic noise, Shot noise, Gaussian noise etc. Filters used to eliminates noise are mean filter, median filter, Gaussian filter etc.
3. Histogram Modification: Histogram Equalization is an example of this technique. By using this we can enhance the features of an image.
C. Image Segmentation
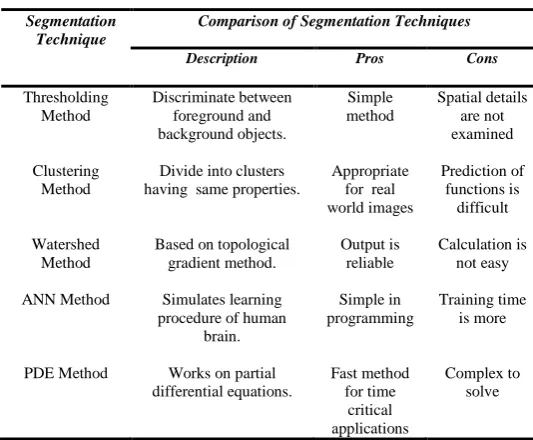
[image:2.595.312.581.274.492.2]It is a technique in which image is divided into regions or segments containing pixels having same properties. Segmentation has many techniques for dividing the image into segments such as Thresholding method, clustering method, watershed method etc.
Table I. Segmentation Techniques
Segmentation Technique
Comparison of Segmentation Techniques
Description Pros Cons
Thresholding Method Clustering Method Watershed Method ANN Method PDE Method Discriminate between foreground and background objects.
Divide into clusters having same properties.
Based on topological gradient method.
Simulates learning procedure of human
brain.
Works on partial differential equations.
Simple method
Appropriate for real world images Output is reliable Simple in programming Fast method for time critical applications Spatial details are not examined Prediction of functions is difficult Calculation is not easy Training time is more Complex to solve
D. Feature Extraction
This step is used to extract features such as color, shape, texture and structure from an image. The comparison between some techniques used for extraction of features are given as follow:
Table II. Feature Extraction Techniques
Feature Extraction Technique
Comparison of Techniques
Extracted feature Pros Cons
Global Color Histogram Color Color Color Computation is easy Gives spatial Gives no spatial information Computation Coherence Vector Local Binary Patterm Fourier Transform of Boundary Texture Shape information Computation is simple Easy to implement
cost is high
Illumination variations are difficult to identify Local space information is not provided
E. Disease Classification
In this step, diseases are classified on the basis of predefined dataset values. The main techniques used for classification are Support Vector Machine(SVM), Multiclass Support Vector Machine(MSVM), Artificial Neural Network(ANN) etc.
Table III. Classification Techniques
Classification Technique
Comparison of Classification Techniques
Description Pros Cons
Artificial Neural Network Suppport Vector Machine Decision Tree Probabilistic Neural Network Replicates some functions of human brain
which uses non-parametric approach.
Builds set of hyper planes in infinite dimensional space.
Non-parametric classifier using hierarchal method.
Feedforward neural network having input, hidden, summation and
output layer. Self -adaptive technique having high computation rate Computational complexity is less having high accuracy Computational time is less.
Gives accurate and fast result
Training time is high Algorithm is difficult to understand. Complex calculations More memory space requires
III. LITERATURE REVIEW
In paper[5] authors provided an approach to detect and classify three diseases of apples namely blotch, scab and rot. The features that used to classify disease of apple are color, shape and texture. The main steps proposed in this paper to detect the disease are as follow:(1) K-means clustering method is used to detect disease of apple.,(2) Color, shape and texture based features are applied over segmented image, (3) Multi-class support vector machine(MSVM) is used to classify a healthy apple or apple with infected part. The experiments point out in this paper that shape feature is not suited for classification purpose.
Authors in [6] proposed a web based system that is valuable for farmers to identify fruit diseases by uploading images to the system. In this system, first of all image is resized. Then features of images are extracted on the basis of color, morphology and CCV.To make clusters K-means clustering method is used. SVM is used to classify fruit as infected or not. In this paper morphology considered as best parameter for extraction of features.
[image:2.595.30.297.363.583.2]is used for texture analysis. It provides high accuracy and consumes less time.
In paper[8] authors provide an interface to illiterate farmers to identify diseases in fruits and crops, its causes and its symptoms. In this, first of all RGB image is converted to HSV. Threshold method is used to mask and removal of green pixels. Then segmentation is done with k-means clustering algorithm and texture analysis is done with the help of color co-occurrence matrix. These texture parameters are compared with image of healthy fruit.
In paper [9] authors proposed a tool to supervise the fruit diseases from plantation to harvesting. Color, texture and morphology are use as feature vectors. Among these morphology gives best result. Neural networks are used for classification of two grapes diseases named as Black Rot and Powdery Mildew and two apple diseases named as Apple Scab and rot. MATLAB has been used for implementation of neural networks.
In paper [10] authors worked with objective to detect and classify leaf diseases from images. The proposed framework mainly focus on diseases of grapefruit, lemon, lime and orange leaf such as citrus canker, Anthracnose, Citrus greening disease etc. Authors divided framework into four parts: (1) Image pre-processing which converts RGB to another color space. (2)Image enhancement segments the region by using k-means clustering. (3) Feature extraction on basis of texture using statistical GLCM and color using mean values.(4) Classification is done with help of SVM.
In [11] authors presented a software for identification of plant leaf diseases automatically. The system perform following steps to identify diseases:(1) Color transformation is applied on RGB image.(2) Threshold value is used to mask or remove green pixels and for segmentation k-means
clustering is used.(3) Then required features are extracted on basis of color and texture.(4) At the end classification is done to identify the disease.
Authors in paper[12] proposed a machine vision system for identification of plant diseases. Input is digital colored images of cotton crop. The input images undergoes image enhancement, segmentation and feature extraction. Then SVM classifier is used to identify a disease.
In [13] authors proposed a system that detect or identify plant leaf disease caused by micro-organisms such as fungi, bacteria and viruses. In proposed system, first of all, a color transformation structure is created for RGB images to convert it into HSI because it is used for color description. Green pixels are masked and removed with help of threshold method. Segmentation is done and SGDM matrices is used to extract features.
The objective of paper[14] to identify diseases of grape fruit named as Powdery Mildew and Downey Mildew. In this paper first of all authors created a database containing images then image enhancement takes place by transform image into HSI color space. Intensity of images are adjusted by applying threshold. Gabor filtering is used to extract features. For classification of diseases Artificial Neural Network is used.
Authors in [15] proposed a methodology or the detection of disease in pomegranate leaf. In this authors collect image samples by using digital camera. Then RGB is converted into gray scale image and apply median filter for removal of noise. Segmentation is done with the help of k-means clustering algorithm. The technique which is used to extract features and classify disease is GLCM.
[image:3.595.45.553.430.787.2]IV. REVIEW TABLE
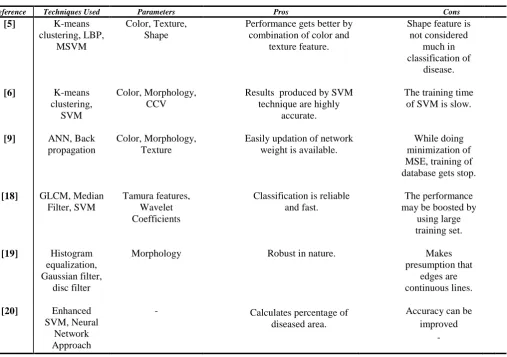
Table IV. Comparison of different papers
Reference Techniques Used Parameters Pros Cons
[5]
[6]
[9]
[18]
[19]
[20]
K-means clustering, LBP,
MSVM
K-means clustering,
SVM
ANN, Back propagation
GLCM, Median Filter, SVM
Histogram equalization, Gaussian filter,
disc filter
Enhanced SVM, Neural
Network Approach
Color, Texture, Shape
Color, Morphology, CCV
Color, Morphology, Texture
Tamura features, Wavelet Coefficients
Morphology
-
Performance gets better by combination of color and
texture feature.
Results produced by SVM technique are highly
accurate.
Easily updation of network weight is available.
Classification is reliable and fast.
Robust in nature.
Calculates percentage of diseased area.
Shape feature is not considered
much in classification of
disease.
The training time of SVM is slow.
While doing minimization of MSE, training of database gets stop.
The performance may be boosted by
using large training set.
Makes presumption that
edges are continuous lines.
Accuracy can be improved
[2]
[3]
BPNN, CCM, HSV
GLCM, CCV
Color, Texture, Shape
Color Features
Having potential to use in Agriculture robot.
Provides faster solution.
Recognition rate of classification may
be increase
V. RESULTS OF EXISTING LITERATURE
Result of existing literature in terms of accuracy MSE and entropy is given in this section. The formulas to obtain the results is given as under:
i. The mean square error is difference between the actual and approximate results presented as under
MSE=1
n∑(x−xi)2 Eq 1: Mean square error
ii. The accuracy is obtained by subtracting MSE from 1
Accuracy=1-MSE Eq 2: Accuracy from MSE
iii. The Entropy indicates degree of relationship between pixels and is given by
Entropy=∑PilogPj
Eq 3: Entropy in terms of probability
‘P’ indicates the probability that pixels are adjacent to each other.
[image:4.595.303.571.212.344.2]
Figure 2. ImageSet of Infected fruits
Result in terms of MSE,Accuracy and entropy for above imagesis given as
Table V Result in terms of MSE, Accuracy and Entropy
Image Set Comparison of Different Images
MSE Entropy Accuracy
Image1
Image2
Image3
Image4
Image5
15.675.
13.456
16.732
14.325
12.568
0.5896
0.5689
0.65325
0.62568
0.61021
84.325
86.544
83.675
85.675
87.432
[image:4.595.304.567.371.631.2]Plots of the obtained result is given as under
Figure 3. Plot of various parameters 0
10 20 30 40 50 60 70 80 90 100
Image1 Image2 Image3 Image4
[image:4.595.35.251.428.716.2]VI. CONCLUSION
This paper conferred literature survey of various papers using image processing techniques for detection and classification of diseases of plants. Every technique has some merits and demerits. No single technique is used for all applications, it is depend on user’s requirement which technique has followed for detection and classification of disease. User can hybrid two or more techniques to get results according to their requirement for better accuracy in less amount of time.
VII. REFERENCES
[1] Zalak R. Barot, Narendrasinh Limbad, “An Approach for Detection and Classification of Fruit Disease: A Survey,” International Journal of Science and Research, vol. 4 issue12, pp. 838-842, December 2015.
[2] Shivani K. Tichkule, Dhanashri. H. Gawali, “Plant Diseases Detection Using Image Processing Techniques”, Online International Conference on Green Engineering and Technologies, 2016.
[3] H. Al-Hiary, S. Bani-Ahmad, M. Reyalat, M. Braik and Z. ALRahamneh, “Fast and Accurate Detection and Classification of Plant Diseases particles,” International Journal of Computer Applications, vol. 17 , pp. 31–38, March 2011.
[4] Trimi Neha Tete, Sushma Kamlu “Plant Disease Detection Using Different Algorithms,” Proceedings of the Second International Conference on Research in Intelligent and Computing in Engineering pp. 103–106, 2017.
[5] Shiv Ram Dubey, Anand Singh Jalal, “Apple disease classification using colour, texture and shape features from images,” Signal, Image and Video Processing, Springer, vol 10 ,pp 819, 2015.
[6] Manisha Bhange, H.A.Hingoliwala, “Smart Farming: Pomegranate Disease Detection Using Image Processing,” Second International Symposium on Computer Vision and the Internet, pp. 280–288, 2015.
[7] Sandesh Raut , Amit Fulsunge, “Plant Disease Detection in Image Processing Using MATLAB,” International Journal of Innovative Research in Science, Engineering and Technology, vol.6, issue 6, pp.10373-10381, June 2017.
[8] Priya P., Dony A. D’souza,” Study of Feature Extraction Techniques fot the Detection of Diseases of Agricultural Products,”, International Journal Of Innovative Research In Electrical, Electronics, Instrumentation And Control Engineering, vol.3, issue 1, pp. 4-8, April 2015.
[9] Monika Jhuria, Ashwani Kumar, Rushikesg Borse“Image Processing for Smart Farming : Detection of Disease and Fruit Grading,” IEEE Second International Conference on Image Information Processing Science, pp. 521-526, 2013.
[10] Kiran R. Gavhale, Ujwalla Gawande, Kamal O. Hajari, “ Unhealthy Region of Citrus Leaf Detection Using Image Processing Techniques ,”International Conference for Convergence of Technology, IEEE, 2014.
[11] Amruta Ambatkar, AshwiniBhandekar, Avanti Tawale, Chetna Vairagade, Ketaki Kotamkar, Ketaki Kotamkar,”Leaf Disease Detection Using Image Processing,” International Conference on Recent Trends in Engineering Science and Technology, vol.5, issue1, pp.333-336, January 2017.
[12] A. Camargo, J.S. Smith,”Image pattern classification for the identification of disease causing agents in plants,” Computers and Electronics in Agriculture Elsevier,pp.121-125, 2009. [13] Sanjay B. Dhaygude,Nitin P.Kumbhar,”Agricultural plant Leaf
Disease Detection Using Iage Processing,” International Journal of Advanced Research in Electrical, Electronics and Instrumentation Engineering, vol.2, issue 1, pp.599-602, January 2013.
[14] Sushil R. Kamlapurkar, “Detection of Plant Leaf Disease Using Image Processing Approach,” International Journal of Scientific and Research Publications, vol.6, issue 2,pp.73-76, February 2016.
[15] Sowmya GM, Chandan V, Sampath Kini,”Disease Detection in Pomegranate Leaf Using Image Processing Technique,” International Journal of Science, Engineering and Technology Research, vol.6, issue3, pp.396-400, March 2017.
[16] Iqbaldeep Kaur, Gifty Aggarwal and Amit Verma, “Detection and Classification of Disease Affected Region of Plant Leaves using Image Processing Technique,” Indian Journal of Science and Technology,vol.9, December 2016.
[17] Feng Qin, Dongxia Liu, Bingda Sun, Liu Ruan, Zhanhong Ma, Haiguang Wang,”Identification of Alfalfa Leaf Diseases Using Image Recognition Technology,”PLOS ONE, December2016. [18] Najiya Nasreen P., Chempak Kumar A., Asjad Nabeel
P.,”Automatic Classification of Monocots and Dicots using SVM Classifier,” IEEE pp.28-31, 2016.
[19] Wan Mohd Fadzil W.M.N, Shah Rizam M.S.B, R. Jailani, Nooritawati M.T,”Orchid Leaf Disease Detection using Border Segmentation Techniques,” Conference on Systems, Process and Control IEEE, pp.168-173, December 2014.
[20] Rajleen Kaur, Sandeep Singh Kang, “An Enhancement in Classifer Support Vector Machine to Improve Plant Disease Detection,” International Conference on MOOCs, Innovation and Technology in Education IEEE 2015.