DOI: http://dx.doi.org/10.26483/ijarcs.v9i2.5900
Volume 9, No. 2, March-April 2018
International Journal of Advanced Research in Computer Science
RESEARCH PAPER
Available Online at www.ijarcs.info
ISSN No. 0976-5697
COMPREHENSIVE ANALYSIS OF DATA MINING CLASSIFIERS USING WEKA
Hemlata
Department of Computer Science & Applications Maharshi Dayanand University
Rohtak, Haryana, India ORCID: 0000-0002-6105-7399
Abstract: Data Mining or knowledge extraction from a large amount of data i.e. Big Data is a crucial and important task now a days. Data Mining and its applications are the most promising and rapidly emerging technologies. A number of Open Source Big Data Mining tools are available. Users or researchers must have the knowledge of the characteristics, advantages, capabilities of the tools. This paper gives an experimental evaluation of the algorithms of WEKA. The classification algorithms are analysed on the basis of accuracy and precision by taking the real dataset. The paper presents the comprehensive evaluation of different classifiers of WEKA. It will help the future researchers or data analysing business organisation to select the best available classifier while using WEKA.
Keywords: Data Mining, Big Data, Classifiers, Big Data Mining Tools, Weka
I.INTRODUCTION
There is a rapid development in Information Technology and Data Science industry in last few decades. As the size of data increases its retrieval is becoming complex. The extraction of meaningful data from the huge amount of data is a challenging task. The process of discovering knowledge or meaning from the unstructured and unformatted data is known as Data Mining.
Many Big Data Mining Tools are available but to select the best is very difficult. This paper gives a comprehensive analysis of the most important Big Data Mining Tool- WEKA. It presents the experimental evaluation of the data mining classifiers available in WEKA. The analysis is done by implementing the classification algorithm on real dataset and comparing the resuts. The comparison and analysis is done on the basis of precision, accuracy and confusion matrix.
II.DATAMINING
Data Mining means the practice of examining large pre-existing databases in order to generate new information. It is the procedure of pattern discovery from huge datasets. It is an essential process where intelligent methods are applied to extract data patterns. It is an interdisciplinary subfield of computer science [1]. Simply, the process of extracting meaningful and usable data from larger set of any raw data is known as data mining. It indicates the procedure of analysing data patterns in large batches of data using one or more software [2]. Data mining is also known as Knowledge Discovery in Data (KDD). It is the process of collecting, searching through, and analyzing a large amount of data in a
database, as to discover patterns or relationships. The nontrivial process of identifying valid, novel, potentially useful, and ultimately understandable patterns in data stored in structured databases is data mining [3]. It is the nontrivial extraction of implicit, previously known, and potentially useful information from data. Data Mining is the science of extracting useful information from large data sets or databases [4]. It uses computational techniques from statistics, machine learning, and pattern recognition. Data mining is the process of applying computer-based methodology for knowledge discovery from data [5]. The two components are:-
• Knowledge Discovery
Concrete information gleaned from known data. Data you may not have known, but which is supported by recorded facts [6].
• Knowledge Prediction
Uses known data to forecast future trends, events, etc. (i.e.: Stock market predictions).
Data mining is highly useful in the following domains [7] −
• Market Analysis and Management.
• Corporate Analysis & Risk Management.
• Fraud Detection
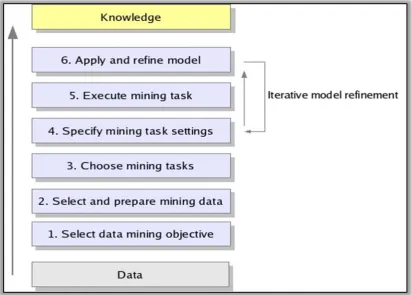
Figure 1 Data Mining Process
A. Techniques of Data Mining
Various techniques of Data Mining are:
1. Clustering
Clustering is the method of grouping similar objects. A cluster of similar data objects can be treated as one group. In cluster analysis, we first partition the set of data into groups based on similarity and then assign the labels to the groups. Clustering analysis can be applied in diverse fields such as data analysis, image processing, market research and pattern recognition [9]. It helps the marketing executives in discovering different groups in their customer base on the basis of customer’s purchasing patterns. Cluster analysis is a tool to gain insight into the distribution of data to observe characteristics of each cluster [10].
2. Association Rules Discovery
The process of identifying the similar patterns which frequently go together is known as association rules. The data objects with associated or similar characteristics are grouped under associated rules. Associations are used in retail sales to identify patterns that are frequently purchased together [11]. This process refers to the process of uncovering the relationship among data and determining association rules [12]. For example, a retailer generates an association rule that shows that 70% of time milk is sold with bread and only 30% of times biscuits are sold with bread.
3. Regression
Regression methods are used to predict the value of the response variable from one or more predictor variables where the variables are numeric[13]. Different forms of Regression are Linear, Multiple, Weighted, Polynomial, Nonparametric, Robust.
4. Sequential Pattern Discovery
Sequential pattern discovery or Sequential pattern Mining is specialized data mining task to analyse sequential data and to discover sequential patterns. It is the process of discovering interesting sub-sequences in a set of sequences. The criteria of sub sequence can be its frequency of occurrence, length or profit. As the data can be encoded in sequences of symbols, sequential pattern mining can be applied in many fields such as e-learning, market basket analysis, bioinformatics, and many more[14]. It has been used to find sub-sequences that appear in a sequence database i.e. that are common to several sequences. These sub-sequences are called frequent sequential patterns.
The patterns which occur very frequently in the data are called frequent patterns [15]. Various kinds of frequent patterns –
• Frequent Item Set – The item sets which occur frequently together are called Frequent Item Set. For example, bread and butter.
• Frequent Subsequence − A sequence of patterns which appear frequently such as purchasing a smart phone is followed by a memory card.
• Frequent Sub Structure − Substructure means different structural forms, such as graphs or trees. The occurrence of these sub-structures combined with item-sets or sub-sequences is known as Frequent Sub Structure.
5. Collaborative Filtering
for information or patterns using various collaboration techniques [16]. Collaborative filtering can be used in very large database i.e. Big Data. It can be applied in many different types of data such as sensing and monitoring data, financial data, electronic data etc.
Collaborative filtering usually requires three inputs [17]:
• Users' active participation
• Method to represent users' interests
• Algorithms
6. Classification
Classification is the most important data mining technique which is based on machine learning. Classification is used to group the data item set in one of the predefined set of classes or groups. Classification method uses the mathematical and statistical techniques such as decision trees, linear programming, and neural network. In classification, a model is built that can learn how to classify the data items into groups [17]. Classification is a data mining function that assigns items in a collection to target categories or classes. The main objective of classification is to accurately predict the target class for each data [18]. For example, a classification model identifies loan applicants as low, medium, or high credit risks. Various methods used for data mining classification are:-
• Decision tree:
Decision trees are powerful and popular tools for classification and prediction. Decision tree is a predictive model that can be viewed as a tree. The goal of decision tree is to create a model that estimates the value of a target variable based on several input variables [19]. The nodes represent the input variables; whereas the edges to children represent the possible values of that input variable. Decision tree is a classifier model in the form of a tree structure having two types of nodes [20]:
o A leaf node – represents the value of the target attribute.
o A decision node – represents some tests to be carried on a single attribute value, with one branch and sub-tree for each possible outcome of the test.
• Rule-based methods:
Rule-based classifiers categorize the data with the use of a collection of “if . . . then . . .” rules. The predecessor of the rule is an expression made of the combination of attributes. The resultant rule is a positive or negative classification. For building a rule-based classifier we have to derive rules directly from the dataset [21]. Most important advantage of rule-based classifiers is that they are extremely expressive because they are symbolic. Rule-based classifiers or decision trees are easy to interpret, easy to generate and they can classify new instances efficiently.
• Memory based learning:
Memory-based learning method is a collection of learning algorithms which compare the objects of new problem with the objects of training. It does not perform explicit generalization [22]. It can also be referred to as instance-based learning method because it builds hypotheses directly from the training objects which mean that the hypothesis complexity can grow with the growth of data. The ability to adapt to its model to previously unseen data is the main advantage of memory-based learning over other methods of machine learning [23]. One example of memory
based learning algorithm is the k-nearest neighbour algorithm.
• Neural networks:
Artificial neural networks (ANNs) are based on biological neural networks i.e. the nervous system of our brain. They are used to approximate functions that depend on a large number of inputs [24]. Artificial neural networks are the systems of interconnected “neurons”. These neurons calculate values from inputs. These neural networks are competent in machine learning and pattern recognition [25]. An artificial neural network functions by creating connections between many elements each element represent a single neuron of a brain. These neurons are constructed and simulated by a computer system. Every neuron takes many signals as input and gives a single signal as output. This output is then sent to the next neuron. The neurons are strongly interconnected and organized into different layers. The input layer receives the input and the output layer produces the final output [26]. In general one or more hidden layers are sandwiched in between the two. This layer system makes it impossible to forecast or know the exact flow of data.
• Bayesian network:
The Naive Bayes Classifier technique is based on Bayesian theorem of probability. It is particularly used when the dimensionality of the inputs is high. The Bayesian Network Classifier is efficient in computing the most possible output based on the input. In this classifier it is possible to add new raw data at runtime and get a better probabilistic classifier [27]. When the class variable is given, Naive Bayes classifier considers that the presence of a particular attribute is not related to the presence of any other attribute.
Bayesian networks are directed acyclic graphs (DAG) whose nodes represent random variables. The nodes can be any observable quantities, variables, unknown parameters or hypotheses [28]. Edges are the conditional dependencies. Nodes which are not connected represent the independent variables. Each node is associated with a probability function that takes as input a particular set of values for the node's parent variables and gives the probability of the variable represented by the node.
• Support vector machines:
Support Vector Machines are learning models which are supervised and have learning algorithms to analyze data and patterns. SVMs are also known as support vector networks. The basic SVM is a binary linear classifier which accepts input data set and gives two possible outcomes [29]. Well-founded theoretical approach, quality of generalization and ease of training are the basis of SVM. The support vector machine is an algorithm to learn and classify rules of data. The SVM can be used to learn polynomial, radial basis function (RBF) and multi-layer perceptron (MLP) classifiers [30].
III.EXPERIMENTALANALYSIS
Analysis of Big Data Mining tool Weka is done by following steps:
• Real Dataset Taken
• Selection of Evaluation Technique A. Data Set Choosen
performance analysis of various data mining classifier algorithms of WEKA. The details of the dataset are given in table 1:
Table I. Data Set Used Dataset Name No. of
Instances
No. of Attribute
s
No. of Class Values
Pima_Diabetes 768 9 2
B. Evaluation Technique
The tool is analyzed on the basis of classification technique of data mining. Various classifiers of WEKA are used as basis of evaluation or analysis. The classifiers of WEKA used in the study are:
• J48
• Decision Table
• Naïve Bayes
• Random Tree
• Attribute Selected Classifier
• Rules ZeroR
• Ibk lazy
• Input Mapped Classifier
• SGD function
C. Experimental Setup
The experiments are conducted on a laptop with Windows 2007 with an Intel Core i3 M350 processor and 4 GB main memory. WEKA 3.8 is freely downloaded from internet as it is open source software.
The tests are conducted on two modes:
• 10-fold cross-validation.
• Evaluation on full training data.
D. Experimental Results
WEKA is an efficient data mining tool with a vast capacity of analysis. It has inbuilt capability of analyzing Big Data using following data mining techniques:
• Classification
• Clustering
• Association
In the present study only classification technique is used for analysis. Classification contains seven different types of classifiers:
• Bayes
• Functions
• Lazy
• Meta
• Misc
• Rules
• Trees
Each and every classifier is considered for analysis on the study. While implementing the classifiers on the real dataset two test modes are considered:
• 10-fold cross validation
• Full training set.
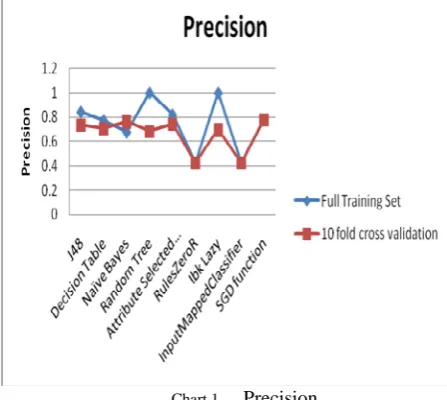
The classifiers are analysed on the basis of Precision. All the nine classifiers, mentioned above in evaluation technique, are implemented using the real dataset pima_diabetes. The precision of the classifiers is represented in chart 1:
Chart 1. Precision
The chart shows that the precision is more when the classifiers are executed in full training set. Random Tree and Ibk Lazy algorithm gives 100% precision while executed in full training set mode.
Chart 2. Accuracy
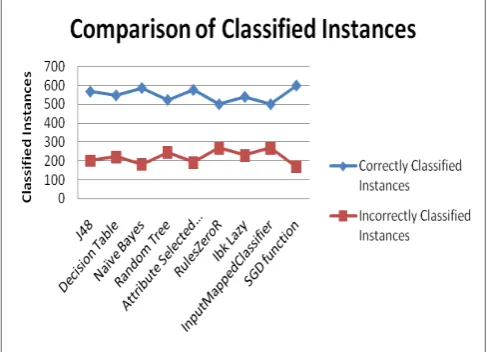
From the execution values it can be concluded that SGD Function gives the maximum correct classified instances. RulesZeroR and Input Mapped Classifier give the least correct classified instances. In general all the algorithms produce the correct classified instances in the range 500 to 600 out of 768 instances.
[image:5.595.36.280.56.232.2]Chart 3. Comparison of Classified Instances
Table II. Detailed Accuracy by Class
Algorithm TP Rate FP Rate Precision Recall F-Measure MCC ROC
Area PRC Area
J48 0.738 0.327 0.735 0.738 0.736 0.417 0.751 0.727
Decision Table 0.712 0.372 0.706 0.712 0.708 0.351 0.773 0.778
Naïve Bayes 0.763 0.307 0.759 0.763 0.76 0.468 0.819 0.815
Random Tree 0.681 0.375 0.684 0.681 0.682 0.303 0.653 0.636 Attribute Selected
Classifier 0.75 0.349 0.743 0.75 0.742 0.428 0.774 0.762
RulesZeroR 0.651 0.651 0.424 0.651 0.513 0 0.497 0.544
Ibk Lazy 0.702 0.378 0.696 0.702 0.698 0.331 0.65 0.64
InputMappedClassifier 0.651 0.651 0.424 0.651 0.513 0 0.497 0.544
SGD function 0.78 0.321 0.776 0.78 0.771 0.497 0.73 0.706
The detailed Accuracy by class for all the algorithms is depicted in table II. It shows that the highest True Positive Rate is given by SGD Function. Also the highest precision is also shown by SGD Function. SGD Function also gives the greatest Recall value, highest F-Measure and highest MCC. Hence, from the detailed accuracy it can be deduced that the best algorithm with maximum values is SGD Function.
IV.CONCLUSION
In the digital age, the vast data should be analyzed properly. There exist a number of Big Data Mining techniques and tools. In this paper, WEKA is taken for analysis. Various in built classification algorithms are analyzed. The analysis is based on accuracy and precision. The test mode used for analysis are- 10-fold cross validation and full training set. The experiments show that full training set test mode gives better precision and accuracy.
The experiments will help the researchers in choosing a better analytical algorithm for their data in future. Also it can guide the way of selecting the test mode and classifier while using WEKA. Many other parameters are left for future research such as more test modes can be considered, more datasets can be taken and other data mining tools can also be compared.
REFERENCES
[1] Hand David, Mannila Heikki, Smyth Padhraic.: “Principles of data mining”, Prentice hall India, pp.1, 2004.
[2] Witten, I.H., Frank, E.: “Data Mining: Practical machine
Learning tools and techniques”, 2nd addition,Morgan Kaufmann, San Francisco(2005).
[3] Chen, X., Ye, Y., Williams, G., & Xu, X. (2007). A survey of open source data mining systems Emerging Technologies in Knowledge Discovery and Data Mining (pp. 3-14): Springer. [4] Kumari, Subita, and Pankaj Gupta. "Proposed Architecture of
MongoDB-Hive Integration." International Journal of Applied Engineering Research 12.15 (2017): 5000-5004.
[5] Davenport, T. H., & Patil, D. (2012). Data scientist. Harvard Business Review, 90, 70-76.
[6] Nurdatillah Hasim, Norhaidah Abu Haris “A Study of
Open-Source Data Mining Tools for Forecasting”, in the proceedings of IMCOM’15, January 08 – 10, 2015, ACM 2015.
[7] Luís C. Borges, Viriato M. Marques and Jorge Bernardino,
“Comparison of Data Mining Techniques and Tools for Data Classification”, in the proceedings of C3S2E13, Jul 10-12 2013, Portugal, ACM, 2013.
[8] Hemlata, Dr. Preeti Gulia, “Comprehensive Study of Open-
Source Big Data Mining Tools”, International
Journal of Artificial Intelligence and Knowledge Discovery, e-ISSN: 2231- 0312, Vol. 6, Issue 1, January, 2016
Communication Technology, Electronics and Microelectronics (MIPRO), IEEE, 2014.
[10] Hemlata, Gulia, Preeti. "Novel Algorithm for PPDM of
Vertically Partitioned Data." International Journal of Applied Engineering Research 12.12 (2017): 3090-3096.
[11] Ahmad Al-Khoder, Hazar Harmouch, “Evaluating four of the
most popular Open Source and Free Data Mining Tools”, International Journal of Academic Scientific Research (272-6446), Volume 3, Issue 1, PP 13-23.
[12] Kumari, Subita, and Pankaj Gupta. "Implementation of
CouchDBViews." Big Data Analytics. Springer, Singapore, 2018. 241-251.
[13] Hemlata, Dr. Preeti Gulia “Techniques and Algorithms of
PPDM" International Journal for Scientific Research & Development Vol. 3, Issue 04, 2015 ISSN (online): 2321-0613. [14] Aggarwal C, Philip S Yu, "A General Survey of Privacy-Preserving Data Mining Models and Algorithms", Springer Magazine, XXII, 11-52, 2008.
[15] Min Chen, Shiwen Mao and Yunhao Liu (2014). Big Data: A
Survey, © Springer Science+Business Media New York 2014, published online: 22 january.
[16] Duren Che, Mejdl Safran and Zhiyong Peng (2013). From Big Data to Big Data Mining: Challenges, Issues and Opportunities, © Springer-Verlag Berlin Heidelberg.
[17] Hemlata, Gulia, P. (2018). DCI3 Model for Privacy Preserving in Big Data. In Big Data Analytics (pp. 351-362). Springer, Singapore.
[18] Wei Fan, Albert Bifet (2012). Mining Big Data: Current Status, and Forecast to the Future, SIGKDD Explorations, 14(2). [19] Xindong Wu, Xingquan Zhu, Gong-Qing Wu, Wei Ding (2014).
Data Mining with Big Data, IEEE Transactions On Knowledge And Data Engineering, 26(1).
[20] Manyika J, McKinsey Global Institute, Chui M, Brown B,
Bughin J, Dobbs R, Roxburgh C (2011). Byers AH Big data: the next frontier for innovation, competition and productivity. McKinsey Global Institute.
[21] Duren Che, Mejdl Safran and Zhiyong Peng (2013). From Big Data to Big Data Mining: Challenges, Issues and Opportunities, © Springer-Verlag Berlin Heidelberg..
[22] Wenliang Du, Zhijun Zhan, 2002, Building Decision Tree
Classifier on Private Data ‘ Proceedings of IEEE International Conference on Data Mining’, Maebashi City, Japan, Vol 14. [23] Sumana M, Hareesh K.S. and Shashidhara H.S., “An Approach
of Private Classification on Vertically Partitioned Data”, in the proceedings of International Conference and Workshop on Emerging Trends in Technology(ICWET 2010), February 26-27, ACM 2010.
[24] Sheng Zhong and Zhiqlang Yang, “Guided perturbation: towards private and accurate mining” The VLDB Journal(2008) 17:1165-1177, Springer-Verlag 2007.
[25] J. Vaidya, C. Clifton, “Privacy Preserving Association Rule Mining in Vertically Partitioned Data”, In Proceedings of the 8th ACM SIGKDD International Conference on Knowledge Discovery and Data Mining, 639–644, 2002.
[26] Weiwei Fang, Bingru Yang, Dingli Song, Zhigang Tang, “A
New Scheme on Privacy-preserving Distributed Decision-tree Mining”, in the proceedings of First International Workshop on Education Technology and Computer Science, IEEE 2009. [27] H.R.Jalla and P.N. Girija, “A Novel Approach for Horizontal
Privacy Preserving Data Mining” , Advances in Intelligent Systems and Computing, pg 101-111, Springer 2016.
[28] [10] Nasrin Irshad Hussain, Bharadwaj Choudhury and Sandip Rakshit, “A Novel Method for Preserving Privacy in Big-Data Mining”, International Journal of Computer Applications(0975-8887) Volume 103- No 16, October 2014.
[29] Hemlata Chahal, “ID3 Modification and Implementation in Data Mining” International Journal of Computer Applications (0975-8887) Volume 80- No7, October 2013.