501
Study of Traffic Flow at a Busy Intersection in
Kanchipuram, India
R.Sumathi
11Assistant Professor, Department of Civil and Structural Engineering, Sri ChandrasekharendraSaraswathiViswaMahaVidhalaya,
Enathur, Kanchipuram, Tamilnadu, India. Email:[email protected]
Abstract: Traffic flow analyses are used to achieve the safe, effective and efficient movement of peoples and goods on roadways within a scheduled time are directly linked with traffic characteristics. The parameters which are deciding the traffic flows are density, speed and volume.Nowadays the density and vehicle volume becomes very high due to increase in population, drastic changes in the economics of the middle class families and also people want the sophisticated life. To improve the road infrastructure for the future, the well planned and effective management is mandatory. In this study the traffic volume at junction, which is considered as a heavy traffic area was carried out manually and the footage from CCTV were taken and the suggestions were given to regularize the traffic. The results obtained clearly stated that two wheelers and Cars take major proportion in the traffic stream flow.
Keywords: Traffic volume; density; Traffic congestion
1. INTRODUCTION
Bright future of the city is mainly based on its transportation. Many cities are facing various problems due to rapid industrialization and urbanization [1, 10]. In the developing cities the numbers of private and public vehicles are to be increased but the available space for the road is not sufficient which leads to traffic congestion. One of the unbearable problem occurs in the urban areas are traffic congestion which affects the society and economy [2]. Congestion affects the free flow of vehicles which increases the journey time, accidents and makes the people getting annoyed. This traffic congestion creates a most challenging problem in all developed and developing towns or political and land acquisition problems [5, 8]. This difficulty should be overcome by increasing the road space or diverting the traffic by considering the distance and also convenience to the public. The current work focuses the traffic characteristics in the town of Kanchipuram at one selected priority city[6,11]. Traffic flow is studied by manual methods. For better understanding of the present status of traffic flow at the junction, traffic survey is conducted with the help of the data collection, an attempt had been made to understand the traffic patterns during different time periods. Traffic control at that junction is also dependent on the
traffic flow characteristics [7, 9]. Hence the results from the present study are helpful in controlling the traffic at the intersection and also in suggesting some of the remedial measures to improve the traffic safety in the region. Remedial measures such as widening the road, changing 4-lane to 6-lane or by providing more public transport can be recommended based on the outcomes of the work.
1.1 Scope of traffic volume studies
To identify the transport either from public or private influences the traffic system.
To know the seasonal, daily and hourly variations in the flow of vehicles is mainly used for the future expansion of roads.
To assess the quality of air in the particular area where the traffic is heavy.
2. STUDY AREA
The city of Kanchipuram (12.8342° N latitude, 79.7036° E longitude, 83.2 m (273 ft) above sea level) is located in the Indian State of Tamilnadu. The city covers an area of 11.605 km2. The land around Kanchipuram is flat and slopes towards the south and east.
As Kanchipuram falls as one of the seven Tirthas (pilgrimage sites) in India, it has tourist visitors from all over the country and even world. As Kanchipuram is known for its cultural heritage, tourism is greater here.
3. MATERIALS AND METHODS
For determining the study area, traffic survey was
done by obtaining CCTV Footages from
502
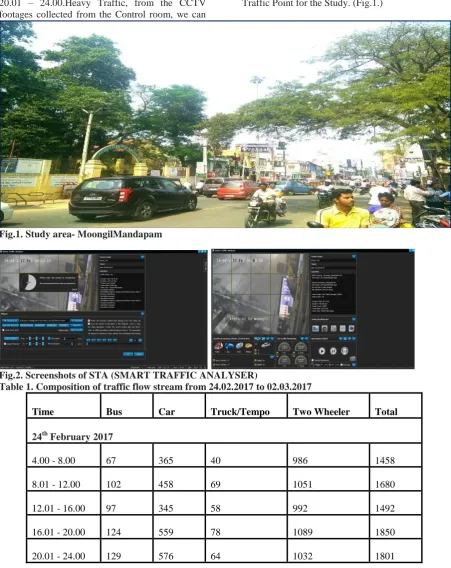
and the vehicles passing were noted down bysegregating them as Buses, Cars, Truck/Tempo, Two-wheelers by using the software Smart Traffic Analyser, (Fig.2).
CCTV Camera Footages of MoongilMandapam was obtained for one week that is from 24th February 2017 to 2nd March 2017 from morning 4.00 a.m to 12.00 a.m. (Table.1).The timing of footage for each day in week was classified as 4.00 – 8.00, 8.01 – 12.00, 12.01 – 16.00, 16.01 – 20.00, 20.01 – 24.00.Heavy Traffic, from the CCTV footages collected from the Control room, we can
say that the heaviest traffic area is
MoongilMandapam with around 6,50,000 vehicles including Buses, Cars, Trucks, Minibuses, Two-wheelers, Auto-rickshaws moving in a week from all directions. From the Data obtained, a total of 75,439 vehicles pass by one camera in a week in MoongilMandapam, this area being the junction for four roads, still more vehicles pass by. So we can say that MoongilMandapam holds most Traffic in Kanchipuram Town and hence it is taken as Heavy Traffic Point for the Study. (Fig.1.)
Fig.1. Study area- MoongilMandapam
Fig.2. Screenshots of STA (SMART TRAFFIC ANALYSER)
Table 1. Composition of traffic flow stream from 24.02.2017 to 02.03.2017
Time Bus Car Truck/Tempo Two Wheeler Total
24th February 2017
503
Total 519 2303 309 5150 8281
25th February 2017
4.00 - 8.00 64 357 43 999 1463
8.01 - 12.00 108 442 65 1109 1724
12.01 - 16.00 94 365 61 1033 1553
16.01 - 20.00 147 541 74 1078 1840
20.01 - 24.00 115 589 58 1156 1918
Total 528 2294 301 5375 8498
26th February 2017
4.00 - 8.00 63 364 54 987 1468
8.01 - 12.00 104 435 75 1125 1739
12.01 - 16.00 100 365 68 1047 1580
16.01 - 20.00 158 536 84 1185 1963
20.01 - 24.00 125 594 60 1598 2377
Total 550 2294 341 5942 9127
27th February 2017
4.00 - 8.00 72 389 60 997 1518
8.01 - 12.00 145 569 75 1689 2478
12.01 - 16.00 122 487 78 1165 1852
16.01 - 20.00 168 635 93 1285 2181
20.01 - 24.00 132 587 65 1635 2419
Total 639 2667 371 6771 10448
28th February 2017
4.00 - 8.00 74 395 63 845 1377
8.01 - 12.00 154 615 78 1745 2592
12.01 - 16.00 136 565 82 1365 2148
504
20.01 - 24.00 145 591 74 1784 2594
Total 698 2811 393 7017 10919
1st March 2017
4.00 - 8.00 85 345 54 749 1233
8.01 - 12.00 185 641 85 2846 3757
12.01 - 16.00 147 558 94 1623 2422
16.01 - 20.00 173 628 61 2574 3436
20.01 - 24.00 138 586 83 2145 2952
Total 728 2758 377 9937 13800
2nd March 2017
4.00 - 8.00 87 389 51 689 1216
8.01 - 12.00 245 784 84 2745 3858
12.01 - 16.00 214 641 94 1783 2732
16.01 - 20.00 229 662 65 2687 3643
20.01 - 24.00 185 587 90 2055 2917
Total 960 3063 384 9959 14366
0 200 400 600 800 1000 1200
4.00 - 8.00 8.01 - 12.00 12.01 - 16.00 16.01 - 20.00 20.01 - 24.00
24.02.2017
Bus
Car
Truck/Tempo
505
0 200 400 600 800 1000 1200
4.00 - 8.00 8.01 - 12.00 12.01 -16.00
16.01 -20.00
20.01 -24.00
25.02.2017
Bus
Car
Truck/Tempo
Two Wheeler
0 200 400 600 800 1000 1200 1400 1600
4.00 - 8.00 8.01 - 12.00 12.01 - 16.00 16.01 - 20.00 20.01 - 24.00
26.02.2017
Bus
Car
Truck/Tempo
506
0 200 400 600 800 1000 1200 1400 1600 1800
4.00 - 8.00 8.01 - 12.00 12.01 - 16.00 16.01 - 20.00 20.01 - 24.00
27.02.2017
Bus
Car
Truck/Tempo
Two Wheeler
0 500 1000 1500 2000
4.00 - 8.00 8.01 - 12.00 12.01 - 16.00 16.01 - 20.00 20.01 - 24.00
28.02.2017
Bus
Car
Truck/Tempo
Two Wheeler
0 500 1000 1500 2000 2500 3000
4.00 - 8.00 8.01 - 12.00 12.01 - 16.00 16.01 - 20.00 20.01 - 24.00
01.03.2017
Bus
Car
Truck/Tempo
507
4. RESULTS AND DISCUSSIONS
The results shown that the number of vehicles passed that junction during week days were higher than weekends. The density of traffic was high during peak hours in the morning and in the evening hours.(8.01 a.m. – 12.00p.m and 4.00p.m- 8.00 p.m.). In the composition of traffic stream flow the two wheelers are in higher density than other mode of vehicles.
5. CONCLUSION
Vehicle composition shows that two wheelers were in major proportion compared to other vehicles. The two wheelers occupied 60% in the total number of vehicles. The reason for this were most of the people are using two wheelers immaterial of their status and it occupied less space. It is very comfortable and convenient for the people during traffic jam. The results were clearly indicated that what we suggested will take some time to clear all the issues, the immediate way to solve the problem is to make alternate routes and divert the traffic Capturing Technique.Serbian Journal of Management, 3 (2), pp.145 – 156.
[2] Sitesh Kumar Singh; AnkitBansal;(2016) Multimodal Interpretation and Analysis of Traffic Survey Data.International Journal of Innovative
Research in Science, Engineering and Technology, 5(5), pp. 7040-7048
[3] Mohammad RafayetHossain; Md. ShakhawatHossenand Roxana Hafiz;(2013) Traffic Impact Analysis of RE-Shedulin Educational Institutes A Case Study of Dhanmondi Residential Area, Dhaka. International Journal of Sustainable Land Use and Urban Planning,1(2), pp. 1-15.
[4] Ramesh Kumar, G.B.; Priyarakshitha, K.R.; (2018), Traffic Congestion Study with A Reality Approach-A Review. International Journal of Pure and Applied Mathematics, 119 (17), pp. 1061-1069.
[5] Jung-Ah Ha;Ju-Sam Oh; (2014) Estimating Annual Average Daily Traffic Using Daily Adjustment Factor. Journal of Emerging Trends in Computing and Information Sciences,5(7), pp. 580-587
[6] Md. AhsanHabib; AnikaNowshinMowrin; BerjeesAnisaIkra; (2018) Analysis of Capacity Volume Study of Selected Highway of Bangladesh. IJARIIE, 4(3), pp.366-375
[7] Breeten Singh Konthoujam; Rajashekara, M. R.; (2015) A Study on Urban Road Widening Project based on Prediction of Level of Service (LOS) – A Case Study in Banerghatta Road Banagalore. International Journal of Engineering Research & Technology,4(6), pp. 1176-1179 [8] SougataMaji;(2017) Traffic Congestion And Possible Solutions A Case Study of Asansol. Journal of Research in Humanities and Social Science,5(9), pp. 42 -46.
[9] Mohanra, E. K.; Geetha, A.; Jeevitha, A.; Kokila, M.; Impacts of road safety initiatives, International Journal of Intellectual Advancements and Research in Engineering Computations, 5(1), pp. 940-945
[10] Milan Pandya; NikhilRaval;(2015) Development of Speed – Density Relationship for the Urban Area - A Case Study of Ahmedabad City. International Journal for Scientific Research & Development, 3(5), pp.41-43