Effect of Thermo Mechanical Analysis of
GMAW by Using SA 387(Grade 12) Pressure
Vessel Material
1
G.Vijayakumar, 2G. Mahadevan 3T. Senthil Kumar, 4B. Kumaragurubaran
1
P.G Scholar M.E. (Manufacturing Engineering), Department of Mechanical Engineering, University College of
Engineering, BIT Campus, Anna University, Trichy, Tamil Nadu, India.
2
Assistant Professor , Department of Mechanical Engineering, University College of Engineering, BIT Campus, Anna
University, Trichy, Tamil Nadu, India
3
Dean & Head, Department of Mechanical Engineering, University College of Engineering, BIT Campus, Anna
University Trichy, Tamil Nadu, India.
4
Assistant Professor , Department of Mechanical Engineering, University College of Engineering, BIT Campus, Anna
University, Trichy, Tamil Nadu, India.
ABSTRACT: In this competitive world, the customers perceive the most reliable high quality with low cost product. Gas metal arc welding famously abbreviated MIG is one of the most important metals joining process in manufacturing industries. The selection of improper MIG welding process parameter increases the power consumption, material consumption, man power and cost of the product decreasing the weld quality. This project work was part of the program for the development of SA 387 steels has to be increase mechanical properties and minimization of metallurgical defects to increasing weldment quality. The quality of weld in MIG mainly influenced by independent variables such as welding current, speed of electrode and electrode stick out. The planned experiments were conducted in the MIG welding machine.. Image J software were used to find out the depth of penetration depending upon the temperature variation. Experimentally found the input parameter value AMPS 160 VOLT-22 ROOT GAP 1.5 was the best value and it did not create any major changes and failures in the testing process and it was comparatively moderate toughness value than other value and it also induces high tensile strength. According to the Taguchi design the optimized parameter value for 10 mm plate of SA387 steel is AMPS 180 VOLT-22ROOT GAP- 1.5.
KEYWORDS: Depth of penetration, Hardness, optimization, orthogonal array, S/N ratio.
1. INTRODUCTION
welding the molten metal drop detachment form an electrode have complex interactions between different physical phenomena. Some of the researchers have studied the electromagnetic effects and some studied the thermal effects and the fluid dynamics. It is an arc welding process where heat is generated for arc between the workpiece and a consumable electrode. A bare solid wire called electrode is continuously fed to the weld zone, it becomes filler metal as it is consumed. Gas metal-arc welding overcomes the restrictions of using electrode of limited length and overcomes the inability to weld in various positions, which is a limitation of submerged-arc welding. In gas metal arc welding, the variations of power supplies, shielding gases and electrodes have significant effects, resulting in different process variations. All important metals used in different commercial applications such as aluminum, copper, stainless steel and carbon steel can be joined by this MIG welding process by choosing appropriate electrode, shielding gas and different welding conditions. It has been very important to know the performance of a welding process over a wide range of input process parameters. MIG welding is such a welding process which is extensively used in the industries for its high precision and accuracy capability. But performance of the welding depends largely upon the parameters like voltage, current and also on type of work-piece materials, electrode material combinations. A large amount of research works have been noticed to find out the most suitable combination of input process parameters for a desired output. In our present study workpiece of mild steel material of grade High Carbon High Chromium steel has been used tolerances.
II. PROBLEM IDENTIFICATION
In many cases the welder needs only to know the techniques of actual welding and does not need to be concerned about the type or grade of steel being welded. This is because a large amount of steel used in fabricating a metal structure is low Carbon or plain carbon steel (also called mild steel). When welding these steels with any of the common arc welding processes like Stick Mig or Tig there are generally few precautions necessary to prevent changing the properties of the steel.
Steels that have higher amounts of Carbon or other alloys added may require special procedures such as preheating and slow cooling, to prevent cracking or changing the strength characteristics of the steel. The welder may be involved in following a specific welding procedure to ensure weld metal and base metal has the desired strength characteristics.
III. TESTING MATERIAL
SA387 GR 12 CLASS 2 Engineered for use in elevated temperature service, ASME SA387 Grade 12 is a chrome molybdenum carbon alloy steel for use in weldable pressure vessels and industrial boilers. The material benefits from added chromium which provides excellent corrosion and oxidation resistance making it ideal for sour service applications in the oil and gas industry
3.7.1 CHEMICAL COMPOSITION
ELEMENT COMPOSITION,wt%
Carbon 0.15
Silicon 0.15
Manganese 0.3 to 0.6
Chromium 1.9 to 2.6
Molybdenum 0.87 to 1.13
Iron Balance
3.1APPLICATTION
Boilers and pressure vessels,
Heat exchangers
Flanges, fittings and valves
Ducting and pipe supports
IV. FINITE ELEMENT ANALYSIS
ANSYS, Inc, founded in 1970 as Swanson Analysis Systems, Inc, develops and globally markets engineering simulation software and technologies widely used by Engineers and designers across a broad spectrum of industries including aerospace, automotive, manufacturing, electronics and biomedical. It also focuses on the development of open and flexible solution that enable users to analyze decisions directly on the desktop, providing a common platform for fact, efficient and cost-conscious produce development, from decision concept to final stage testing and validation.
4.1 COMPARISION OF THERMAL FLUX AND THERMAL GRADIENT
The below table shown in thermal flux and Thermal gradient at various Heat in put
HEAT IN PUT KJ/mm
THERMAL FLUX THERMAL
GRADIENT K/m
MAX 1.232 24603 439.345
MIN .026441 0.472 X 103
MAX 1.344 25857 461.732
MIN .027788 0.496 X 103
MAX 1.456 27110.7 484.119
MIN 0.29135 0.520 X 103
MAX 1.689 27737.5 495.312
MIN 0.29814 0.532 X 103
MAX 1.843 28634.3 506.506
MIN 0.30483 0.544 X 103
MAX 1.996 29618 528.893
MIN 0.3183 0.568 X 103
MAX 2.112 311825.01 556.877
MIN 0.335104 0.598 X 103
MAX 2.304 32752.2 584.86
MIN 0.33514 0.598 X 103
MAX 2.496 34139.3 612.844
MIN 0.036882 0.659 X 10³
4.2 ANSYS CONCLUSION
In this project work finally concluded that the changes in value of heat inputs will lead to affect the thermal distribution on the welded structures. From the above experimentation, due to higher heat input, the thermal flux is also increased (i.e.) Maximum thermal stress is acting on that point that was indicated as SMX.
V. ROCKWELL HARDNESS TEST
1. Rockwell Hardness systems use a direct readout machine determining the hardness number based upon the depth of penetration of either a diamond point or a steel ball. Deep penetration indicated a material having a low Rockwell Hardness number.
2. However, a low penetration indicates a material having a high Rockwell Hardness number. The Rockwell Hardness number is based upon the difference in the depth to which a penetrator is driven by a definite light or “minor” load and a definite heavy or “Major” load.
3. The ball penetrators are chucks that are made to hold 1/16” or 1/8” diameter hardened steel balls. Also available are ¼” and ½” ball penetrators for the testing of softer materials.
4. There are two types of anvils that are used on the Rockwell hardness testers. The flat faceplate models are used for flat specimens. The “V” type anvils hold round specimens firmly.
5. Test blocks or calibration blocks are flat steel or brass blocks, which have been tested and marked with the scale and Rockwell number. They should be used to check the accuracy and calibration of the tester frequently.
Using the “B” Scale;
a. Major load: 100 Kg, Minor load: 10 Kg
5.1 ROCKWELL HARDNESS VALUE(HRB VALUE)
5.1.1 IMPACT TEST
Izod impact strength testing is an ASTM standard method of determining impact strength. A notched sample is generally used to determine impact strength. Impact is a very important phenomenon in governing the life of a structure. In the case of aircraft, impact can take place by the bird hitting the plane while it is cruising, during take - off and landing there is impact by the debris present on the runwayAn arm held at a specific height (constant potential energy) is released. The arm hits the sample and breaks it. From the energy absorbed by the sample, its impact strength is determined.The North American standard for Izod Impact testing is ASTM D256. The results are expressed in energy lost per unit of thickness (such as ft-lb/in or J/cm) at the notch. Alternatively, the results may be reported as energy lost per unit cross-sectional area at the notch (J/m² or ft-lb/in²). In Europe, ISO 180 methods are used and results are based only on the cross-sectional area at the notch (J/m²).
5.1.2 IMPACT STRENGTH
In our Project Impact Strength determined through impact testing machine by charpy method. Specification of the machine and Size of the specimen
Materials TEST PLATE
Average in Joules
SA 387 S1 36
S2 47
S3 18
S4 54
S5 138
S6 28
S7 70
SAMPLES S1 S2 S3 S4 S5 S6 S7 S8 S9
Energy Range = 0 – 300 J Least Count (1 Division) = 1J
Specimen size = 10 X 10 X 55 mm
Notch = U NOTCH
Notch Depth = 5mm Table5. Impact strength Result
VI. DEPTH OF PNETRATION
Inadequate weld bead dimensions such as shallow depth of penetration may contribute to failure of a welded structure since penetration determines the stress carrying capacity of a welded joint .To avoid such occurrences the input or welding process variables which influence the weld bead penetration must therefore be properly selected and optimized to obtain an acceptable weld bead penetration and hence a high quality joint . To predict the effect of welding process variables on weld bead geometry and hence quality researchers have employed different techniques
LENGTH OF BEAD WIDTH, DEPTH OF PENETRATION OF WELDED PLATES
SAMPLES Area Mean Min Max Angle Length
T1
BW 0.366 111.753 59.355 163.022 -1.478 15.053
DOP 0.168 83.246 16 122.568 90.807 6.894
T2
BW 0.229 131.64 96.804 150.199 0.591 9.418
DOP 0.132 51.546 1.333 87.333 90 5.437
T3
BW 0.227 107.278 22.444 201.667 -178.807 9.322
DOP 0.18 43.232 1.583 162.425 90.754 7.379
T4
BW 0.286 50.14 19.333 151.837 -0.947 11.749
DOP 0.186 44.905 12 87.667 90 7.67
T5
BW 0.305 109.715 31.333 132.031 -1.332 12.527
DOP 0.153 54.327 17 96.333 90 6.31
T6
BW 0.314 113.587 36.13 150.519 -0.431 12.912
DOP 0.165 40.846 15.333 86 90 6.796
T7
BW 0.236 76.567 18 103.347 -0.573 9.709
DOP 0.165 44.974 10 129 90 6.796
T8
BW 0.272 104.131 10.783 161.391 -0.996 11.166
DOP 0.156 46.603 7.576 142 90.868 6.408
T9
BW 0.316 112.762 31.761 165.609 -0.428 13.009
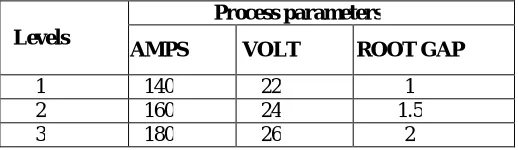
VII. DESIGN OF EXPERIMENT
Process parameters and their levels
Table 4.1 Process parameters and their levels
7.1 ANORTHOGONAL ARRAY L9 FORMATION TRIAL
NO. DESIGNATION AMPS VOLT
ROOT GAP
1 A1B1C1 140 22 1.0
2 A1B2C2 140 24 1.5
3 A1B3C3 140 26 2.0
4 A2B1C2 160 22 1.5
5 A2B2C3 160 24 2.0
6 A2B3C1 160 26 1.0
7 A3B1C3 180 22 2.0
8 A3B2C1 180 24 1.0
9 A3B3C2 180 26 1.5
7.2 EXPERIMENTAL DATA
IMPACT STRENGTH (ANALYSIS OF RESULT) IMPACT STRENGTH AND S/N RATIOS VALUES FOR THE EXPERIMENTS
Levels
Process parameters
AMPS VOLT ROOT GAP
1 140 22 1
2 160 24 1.5
3 180 26 2
TRIAL NO.
DESIGNATION AMPS VOLT ROOT GAP
IS SNRA1
1 A1B1C1 140 22 1.0 36 31.1261
2 A1B2C2 140 24 1.5 47 33.4420
3 A1B3C3 140 26 2.0 18 25.1055
4 A2B1C2 160 22 1.5 22 26.8485
Taguchi Analysis: IS versus AMPS, VOLT, RG
Response Table for Signal to Noise Ratios Larger is better
General Linear Model: IMPACT versus AMPS, VOLT, RGAP
6 A2B3C1 160 26 1.0 54 34.6479
7 A3B1C3 180 22 2.0 70 36.9020
8 A3B2C1 180 24 1.0 32 30.1030
9 A3B3C2 180 26 1.5 22 26.8485
Level AMPS VOLT ROOT GAP
1 29.89 31.63 31.96
2 34.76 35.45 29.95
3 31.28 28.87 34.93
Delta 4.87 6.58 5.89
Rank 3 1 2
Factor TYPE LEVELS VALUES
AMPS FIXED 3 140,160,180
VOLT FIXED 3 22,24,26
7.3 ANALYSIS OF VARIANCE FOR IMPACT, USING ADJUSTED SS FOR TESTS
S = 37.8609 R-Sq = 74.56% R-Sq(adj) = 0.00%
VIII. RESULT &CONCLUSION
GMAW welding can be used successfully to join SA387. The processed joints exhibited better mechanical and metallurgical characteristics. The joints exhibited 90-95% of parent material’s Hardness value. The specimen failures were associated depending upon the improper changes of heat value . According to experimental investigation found out the input parameter value AMPS 160 VOLT-22 ROOT GAP is1.5 is the best value and it does not create any major changes and failures in the testing process. The toughness value of the GMAW welded SA387 steel was comparatively moderate value (AMPS 160 VOLT-22 ROOT GAP- 1.5) than other value. It also induces high tenstile strength. According to the Taguchi design and optimized parameter is value for the 10 mm plate of sa387 steel is AMPS 180 VOLT-22 ROOT GAP- 1.5.
REFERENCES
1.Izzatul Aini Ibrahim1, Syarul Asraf Mohamat1, Amalina Amir1, Abdul Ghalib The Effect of Gas Metal Arc Welding (GMAW) processes on different welding parameters, Procedia Engineering 41 ( 2012 ) 1502 – 1506
2.D.S. Yawas, S.Y. Aku, S.O. Aluko Fatigue behavior of welded austenitic stainless steel in different Environments, Results in Physics 4 (2014) 127–134
3.M.N.Chougule1*, S.C.Somase2 experimental and analytical study of thermally induced residual stresses for stainless steel grade using gmaw process, 5th International & 26th All India Manufacturing Technology, Design and Research Conference (AIMTDR 2014) December 12th -14th, 2014, IIT Guwahati, Assam, India
4. LI YAJIANG*, WANG JUAN, CHEN MAOAI and SHEN XIAOQIN Finite element analysis of residual stress in the welded zone of a high strength steel, Bull. Mater. Sci., Vol. 27, No. 2, April 2004, pp. 127–132. © Indian Academy of Sciences.
5. Q.Wang*, D.L.Sun, Y.Na, Y.Zhou, X.L.Han J. Wang Effects of TIG Welding Parameters on Morphology and Mechanical Properties of Welded Joint of Ni-base Superalloy Procedia Engineering 10 (2011) 37–41
6. G. MAGUDEESWARAN a,*, Sreehari R. NAIR a, L. SUNDAR b, N. HARIKANNAN a Optimization of process parameters of the activated tungsten inert gas welding for aspect ratio of UNS S32205 duplex stainless steel welds, Defence Technology xx (2014) 1e10
7. Fanrong Kong, Junjie Ma, Radovan Kovacevic∗Numerical and experimental study of thermally induced residual stress in the hybrid laser–GMA
welding process, Journal of Materials Processing Technology 211 (2011) 1102–1111
8 N. Akkuş1,a, E. Toptas2,b, O. Topal3,c Thermomechanical Analysis of Arc Welded Joint by Finite Element Method International Congress on Advances in Welding Science and Technology for Construction, Energy and Transportation Systems (AWST - 2011)
9. J. Dutta* and Narendranath S EXPERIMENTAL AND ANALYTICAL INVESTIGATION OF THERMAL PARAMETERS DEVELOPED IN HIGH CARBON STEEL JOINTS FORMED BY GTA WELDING Journal of Mechanical Engineering, Vol. ME 44, No. 2, December 2014 Transaction of the Mechanical Engineering Division, The Institution of Engineers, Bangladesh
10. R. Ahmad ⇑, M.A. Bakar Effect of a post-weld heat treatment on the echanical and microstructure properties of AA6061 joints welded by the gas
SOURCE DF SEQ
SS
ADJ SS
ADJ
SS F P
% of contribution
AMPS 2 2378 2378 1189 0.83 0.547 21
VOLT 2 2690 2690 1345 0.94 0.516 23
RGAP 2 3334 3334 1667 1.16 0.462 29
ERROR 2 2867 2867 2867 1.433 27