Analysis of Cellular Signal Strength with the
GPS-based location for Mapping Signal
Strength and Dead Zones of Cellular
Networks
Siddhartha Jain
U.G. Student, Department of Electronics and Communication Engineering, Swami Keshvanand Institute of Technology
Management &Gramothan, Jaipur, Rajasthan, India
ABSTRACT:A mobile phone signal (also known as reception and service) is the signal strength (measured in dBm) received by a mobile phone from a cellular network . Depending on various factors, such as proximity to a tower, any obstructions such as buildings or trees, etc., this signal strength will vary. Generally, a strong mobile phone signal is more likely in an urban area, though these areas can also have some "dead zones" where no reception can be obtained. In this paper technique presented is for detecting and storing cellular signal strength with locationcoordinates (using mobile phones) for showing the signal strength and dead zones of the different cellular operator over the map in order to give an insight to mobile phone users for selecting a cellular network according to their traveling route.
I. INTRODUCTION
Cell phones are the most used communication tool today. They are also becoming increasingly connected to the Internet, which allows people to do various works but there are some limitations for its use as a communication tool. A major limitation of Mobile phones is Cellular network coverage. All types of Cellular networks suffer from problems of network coverage and dead zones.
This system will help end users of a cellular network by having an insight about network coverage in any area they are about to travel in. It will also help them in planning any cellular network dependent work in advance during traveling.
System depicted in this paper is divided into 2 parts 1.) Storing Cellular network strength along with GPS location coordinates and Timestamp 2.) Analyzing generated data with Map-reduce (Hadoop) for displaying end results, the reason for selecting Hadoop as an analytic tool is because amount data will be large.
Cellular network strength with GPS location isto find out with help oflightweight android application specially developed for thissystem. Theapplication will generate data only if thereis a change in network strength thenthis application generates a text consisting information about current network strength, location coordinates along with a timestamp of that event this text then get append in a file located in internal memory. After 24 hours this file is transferred to the cloud storage and same cycle of data generation and storing will be executed repeatedly. This application is installed in several mobiles having different cellular operators for gathering data related to their cell strength. Generated data files from all these mobiles are transferred to the cloud storage.
strength over the same area with change in time during a day. Along with it, this analysis is also giving the location of dead zones for different cellular networks.
This paper is organized as follows. Section II represents the flow diagram of the system. Section III presents experimental results. Finally, Section IV presents the conclusion.
II. RELATED WORK
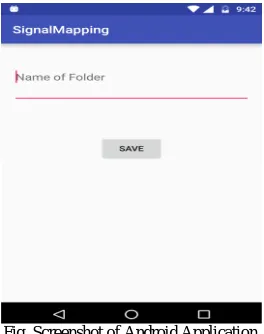
Android Application developed for this system is lightweight with minimal UI overhead so that it do not consume much battery of cell phone. The application consists of one text field and one button. Text Field is for entering file name and button is for saving file that will contain all the generated data.
Fig. Screenshot of Android Application
Data generated by Application is in consistent .txt format. So that there is no data loss during data analysis.
III.PROPOSED METHOD
This system works on a simple method of generating and storing data, followed by analyzing stored data and at last giving result backed with visualization so that end users can understand it.
Data is generated and stored through the android application developed for this system. This application is installed on mobilethen it is started and kept in the background so that any other application can also run if required. Once the application starts running, mobile is moved through different locations whenever it detects a change in cellular signal strength during this movement it generates data consisting information about signal strength, location, bit error rate and signal to noise ratio. This data is then stored in the internal storage of the phone.
After a fix period of time this file is transferred on cloud storage where it is analysed. This analyses includes aggregation of data on basis of location followed by finding out signal strength on that location. With these locations,continuous variations of signal strength is obtained. After processing all location coordinates JSON file is generated in which all the data is stored. This JSON file is then uploaded on webserver.
Fig.Visualization of Data
IV.EXPERIMENTAL RESULTS
Images show the result of Signal Strength Mapping performed inside SKIT M&G campus.
In this experiment, 2 Cellular operator’s signal strength was measured over the same area.
In the Images:
Red Circles represent points where there is a change in signal strength and radius of the red circle is directly proportional to signal strength.
Readings along lines (VIEW1. Road wise Strength), represents Signal strength over that road, this reading is average of signal strength over that road
Area inside rectangle (VIEW2. Overall Signal Strength), represents area over which total signal strength is measured,
Total signal strength = Average of allRoads Signal Strength laying in given area and Average of Variation in Signal Strength off road
Following figure show signal strength mapping results for cellular operator 1 Cellular Operator 1
.
View1. View2.
Fig1.
Fig.1 Signal strength mapping over experimental area with GPS based location(View 1) Road wise signal strength mapping for cellular operator 1. (View 2) Total signal strength mapping for cellular operator 1 over same area as in View1.
View 1. View2.
Fig2.
Fig.2 Signal strength mapping over experimental area with GPS based location (View 1) Road wise signal strength mapping for cellular operator 2. (View 2) Total signal strength mapping for cellular operator 2 over same area as in View1.
From these experimental results, it can be inferred that Cellular operator 1 is having better network coverage as compared to cellular network 2 in the given area and none of the 2 operators had any dead zone in given area.
Graph above represents variation in signal strength of Operator 1 and Operator 2 with respect to common coordinates Coordinates selected are uniformly selected common coordinates for both cellular operators. Coordinates are
represented in format of (longitude, latitude) while altitude for all coordinates are same.
Similarly, signal strength for different cellular operators can be found out over the region of any size.
0 5 10 15 20 25
Si
gn
al
S
tr
e
n
gt
h
(
d
B
m
)
Signal Strength vs Coordinates
Operator 1
V.CONCLUSION
We have implemented a systemforAnalysing Cellular Signal Strength with GPS-based location for Mapping Signal Strength and Dead Zones.Our system successfully maps the signal strength for any cellular network over any given area. Which help in giving the end user an insight about signal strength for a cellular network operator over any area they are traveling to.
REFERENCES
[1] Wang C, Performance “Analysis of Cellular Mobile Communication System for Data Transmission” , IEEE Transaction on Vehicular Technology,Vol.44 ,No.1,1995
[2] H. Hahn, and L. Kibora, “The Domestication of The Mobile Phone”, Journal of modern African Studies, 6 (46), 2008, 87-109. [3] J.H. Reed, K.J. Krizman, B. D. Woerner and T. S. Rappaport, “An Overview of the Challenges and Progress in Meeting the E-911 Requirement for Location Service,” IEEE Communications Magazine, 30-37, April 1998.
[4]T. A. Herring, "The Global Positioning System," Sci. Amer., Feb. 1996, pp. 44–50
[5] Location services Android Developer https://developer.android.com/guide/topics/location/index.html
[6] Signal strengths Android Developer https://developer.android.com/reference/android/telephony/SignalStrength.html [7] Google Map API for Web https://developers.google.com/maps/web/
[8] Apache Hadoop https://hadoop.apache.org/docs/r1.2.1/mapred_tutorial.html
[9]Mladen A. Vouk, “Cloud Computing – Issues, Research and Implementations”,Journal of Computing and Information Technology - CIT 16, 2008, 4, 235–246 doi:10.2498/cit.1001391
[10] Terrill L. Frantz, Kathleen M. Carley , “A Formal Characterization of Cellular Networks”,CASOS Technical Report September,CMU-ISRI-05- 109,2005
[11] Van Minh Nguyen, Fran¸coisBaccelli, Laurent Thomas, Chung Shue Chen. “Best Signal Quality in Cellular Networks: Asymptotic Properties and Applications to Mobility Management in Small Cell Networks”,EURASIP Journal on Wireless Communications and Networking,
SpringerOpen, 2010, 2010 (1), pp.14. .
[12] KathrynZickuhr, “Location-Based Services”, Pew Internet Project, September 2012