ABSTRACT
XIE, YUXIN. Molecular Understanding of the Lower Critical Solution Temperature Phase Behavior of Stimuli-responsive Macromolecules. (Under the direction of Dr. Yaroslava G. Yingling).
Stimuli-responsive polymers undergo large reversible changes in their properties (either physical and/or chemical) as a consequence of small environmental change, which makes them attractive in many industrial and biomedical applications. Investigating the nature of the thermosensitivity of polymers and biopolymers is important for the design of new soft materials with controllable functionality and novel properties. For example, poly(N -isopropylacrylamide) (PNIPAM) is the most commonly studied thermoresponsive polymer, which demixes upon heating above a lower critical solution temperature (LCST) in an aqueous environment. The elastin-like polypeptide (ELP), an example of a biopolymer, is composed of repeating peptide sequences and also undergoes temperature-induced coacervation upon heating above the cloud point temperature. However, an understanding of the mechanism behind such stimuli-responsive behavior of polymers and biopolymers is still far from complete.
Computational techniques, such as molecular dynamics (MD), can provide an advantage over experimental observations in elucidating the all-atom behavior of polymers as a function of stimuli. These computational techniques are commonly used to conduct research using various biomacromolecules including nucleic acids and protein. Herein, this thesis examines: (1) the comparison of LCST behavior of ELPs versus PNIPAM and (2) the effect of sequence composition on the LCST behavior of ELPs.
biopolymer. The effect of temperatures, chain length and the local structure of proximal water were evaluated. Our simulations suggest that the local structure of proximal water and the extent of hydration near both hydrophilic and hydrophobic groups of Val-Pro-Gly-Val-Gly (VPGVG)n ELPs changes significantly as the temperature is raised above their LCST. In contrast, the structure of proximal water near the hydrophilic groups remains unaltered both below and above the LCST of PNIPAM. However, the extent of solvation of hydrophobic groups of PNIPAM decreases significantly above its LCST as compared to below its LCST. The LCST behavior of (VPGVG)n ELPs is a collective phenomenon that originates from the correlated gradual changes in single polypeptide structure and the abrupt change in properties of hydration water around the peptide. By comparison, more prominent localized dehydration of amide groups on the sidechain of PNIPAM was observed.
Molecular Understanding of the Lower Critical Solution Temperature Phase Behavior of Stimuli-responsive Macromolecules
by Yuxin Xie
A dissertation submitted to the Graduate Faculty of North Carolina State University
in partial fulfillment of the requirements for the degree
of Doctor of Philosophy
Physics
Raleigh, North Carolina 2019
APPROVED BY:
Dr. Yaroslava G. Yingling Dr. Jan Genzer
Committee Chair
ii DEDICATION To my parents.
iii BIOGRAPHY
iv
ACKNOWLEDGMENTS
I would like to express my sincerest gratitude to my supervisor, Dr. Yaroslava G. Yingling, who has guided and supported me throughout my Ph.D. work. I am very grateful that there has always been a hand to grab as I walk through this academic path.
I would like to thank my dissertation committee. Dr. Christopher Roland, Dr. Melissa Pasquinelli, and Dr. Jan Genzer have each provided helpful feedback and have been great mentors who have prepared me to get to this milestone in my academic life.
I must acknowledge all of my labmates for their help, advice and insight throughout my stay in the lab. I also would like to express my gratitude to all of my friends whose friendships have made my stay in Raleigh enjoyable.
v
TABLE OF CONTENTS
LIST OF FIGURES ... viii
LIST OF TABLES ... xiv
Chapter 1 Introduction...1
1.1 Background ...1
1.2 Selections of Material ...4
1.2.1 Elastin-like peptide (ELP) ...4
1.2.2 Poly(N-isopropylacrylamide) (PNIPAM) ...5
1.3 Methods ...6
1.3.1 Molecular dynamics ...6
Chapter 2 A comparison between the Lower Critical Solution Temperature behavior of polymers and biomacromolecules ...11
2.1 Introduction ...12
2.2 Computational Methods ...16
2.2.1 Force-field ...16
2.2.2 Initial structure generation: ...17
(a) Single PNIPAM Chain. ... 17
(b) Single ELP Chain. ... 18
2.2.3 MD simulation details: ...18
2.2.4 Analysis methods: ...19
vi
2.3.1 Temperature dependence of Radius of Gyration (Rg) of Macromolecules ...21
2.3.2 Solvation Shell ...23
(a) Analysis of hydrogen bond:... 23
(b) Water distribution:... 26
(c) Solvent accessible surface area (SASA): ... 29
2.3.3 Analysis of Hydrogen Bonds between Polymer and Polymer ...31
2.4 Conclusions ...34
2.5 Supporting information ...46
Content List: ...46
Chapter 3 Lower Critical Solution Temperature behaviors of Elastin-like Polypeptides: the effect of sequence composition ...61
3.1 Introduction ...62
3.2 Materials and Computational Methods ...65
3.2.1 Analysis method...66
3.3 Results and Discussion ...68
3.3.1 Solvation shell ...68
(a) Radius of gyration (Rg) and solvent-accessible surface area (SASA): ... 68
(b) Radial distribution function and hydration water (NW) ... 69
3.3.2 Dehydration process ...71
3.3.3 Hydrophobicity change ...73
vii
3.5 Supporting information ...83
Chapter 4 Conclusions and Future plan ...92
4.1 Summary ...92
4.2 Future Plan ...94
4.2.1 Precise and quantitative measurement of the LCST of thermo-responsive biomacromolecules...94
4.2.2 Sequence-level design of thermo-responsive biomacromolecules ...94
viii LIST OF FIGURES
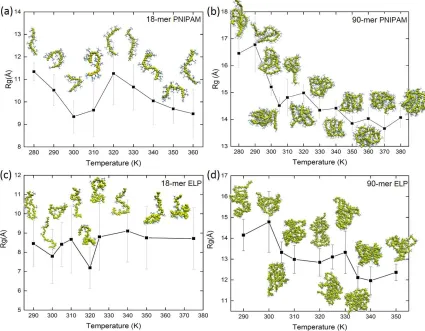
Figure 2.1: (a) Single chain of PNIPAM and (b) β-spiral model of (VPGVG)18 ELPs, where the turn motif is colored in green and the coil motif is colored in gray. Details of schematic structures are showed in supporting information. ...37 Figure 2.2: The radius of gyration as a function of temperature. Snapshots showing
configurations of PNIPAM (a) 18-mer and (b) 90-mer and ELPs (c) 18-mer and (d) 90-mer at all simulated temperatures. ...38 Figure 2.3: Number of hydrogen bonds between polymer and water (npw) and number of
water molecules (Nw) within first hydration shell of hydrophilic group of polymers at all simulated temperatures. Figure (a) and (b) show the npw and Nw correlation of 18-mer and 90-mer of PNIPAM, respectively. Figure (c) and (d) give the relationship of npw and Nw for 18-mer (GVG(VPGVG)3 ) and 90-mer ((VPGVG)18) of ELP, respectively. ...39 Figure 2.4: Dehydration ratio, ratio between polymer-polymer hydrogen bonds (npp) and
total hydrogen bonds (npw + npp). Figure (a) and (b) show the dehydration ratio of 18-mer and 90-mer of PNIPAM, respectively. Figure (c) and (d) show the dehydration ratio of 18-mer (GVG(VPGVG)3 ) and 90-mer ((VPGVG)18) of ELP, respectively. ...40 Figure 2.5: Radial distribution function (RDF) for carbon atoms on backbone and
ix
present in backbone of ELP with oxygen of water, respectively. These carbon atoms are shown in the inset. ...41 Figure 2.6: Solvent accessible surface area (SASA) for hydrophilic (in red curve) and
hydrophobic (in black curve) groups at different temperatures. SASA of hydrophilic and hydrophobic groups of PNIPAM (a) 18-mer and (b) 90-mer. SASA of hydrophilic and hydrophobic groups of ELP (c) 18-mer (GVG(VPGVG)3) and (d) 90-mer ((VPGVG)18). Contribution of SASA of hydrophobic groups of PNIPAM (e) 18-mer and (f) 90-mer, overall SASA of hydrophobic groups are shown in black curves. Right Y-axis of (e) and (f) and red dash curves indicate the SASA from backbone of PNIPAM. And the blue curves are SASA from isopropyl moieties in the side chain. ...43 Figure 2.7: Hydrogen bonds between hydrophilic groups (C=O and >N-H) within
polymer and polymer are calculated in (a) and (b) as a function of temperature for 18-mer PNIPAM and 90-mer PNIPAM, respectively. (c) and (d) show number of intra-peptide hydrogen bonds per residues as a function of temperature for 18-mer and 90-mer ELP, GVG(VPGVG)3 and (VPGVG)18, respectively. ...44 Figure 2.8: Number of hydrogen bonds between polymer and water (npw) and number of
x
Figure 2.S1. Schematic of (a) PNIPAM and (b) (VPGVG)n ELPs. ...47 Figure 2.S2. Partial charges calculated from different methods or different force field.
Previous experimental and computations studies show a clear difference in the Rg of PNIPAM chains as they undergo LCST transition.28, 77, 84, 125 Hence, to choose the optimum set of partial charges we have calculated the radius of gyration (Rg) of 90-mer of PNIPAM. The Rg can be used to analyze the structural evaluation of polymer chains. ...48 Figure 2.S3 (A). Rg for 90-mer of PNIPAM for last 40 ns. The difference in the average
Rg values calculated at 290 K and 350 K for systems (a), (b), (c), and (d) are 6.3 Å, 2.3 Å, 1.4 Å, and 0.6 Å as shown in Figure 2.S3 (B), respectively. Therefore based on the difference in the Rg values calculated below and above the LCST of PNIPAM, namely at 290 K and 350 K, we chose a simulation trajectory where partial charges on PNIPAM were calculated by using method (I) Restrained Electrostatic Potential (RESP) method. ...49 Figure 2.S4. Time autocorrelation function of polymer backbone C1- C2 bond vectors:
(a) and (c) unit vector along backbone C1- C2 bond; (b) and (d) unit vector out of plane. ...54 Figure 2.S5. Radial Distribution Function between hydrophilic group of ELP or
PNIPAM to oxygen of water. (a)RDF for 18-mer PNIPAM; (b) RDF for mer PNIPAM; (c) RDF for 18-mer ELP (GVG(VPGVG)3); (d) RDF for 90-mer ELP ((VPGVG)18). ...55 Figure 2.S6. Radial Distribution Function between carbon atoms on backbone/sidechain
xi
of insert Figure to oxygen of water for mer PNIPAM; (b) RDF for 18-mer PNIPAM; (c) RDF between highlighted carbon atoms of insert Figure to oxygen of water for 90-mer PNIPAM; (d) RDF for 90-mer PNIPAM. ...56 Figure 2.S7. Radial Distribution Function between carbon atoms on backbone of ELP to
oxygen of water. (a)RDF between highlighted carbon atoms of insert Figure to oxygen of water for 18-mer ELP (GVG(VPGVG)3); (b) RDF for 18-mer ELP (GVG(VPGVG)3); (c) RDF between highlighted carbon atoms of insert Figure to oxygen of water for 90-mer ELP ((VPGVG)18); (d) RDF for 90-mer ELP ((VPGVG)18). ...57 Figure 2.S8. Radial Distribution Function between isopropyl group of ELP or PNIPAM
to oxygen of water. (a)RDF for 18-mer PNIPAM; (b) RDF for 90-mer PNIPAM; (c) RDF for 18-mer ELP (GVG(VPGVG)3); (d) RDF for 90-mer ELP ((VPGVG)18). ...58 Figure 2.S9. Hydrogen bonding time probability distribution as function of
residue-distance (∆N) for 90-mer PNIPAM and 90-mer ELPs respectively. (a)Curves for 90-mer PNIPAM between T = 290K ~ 305 K, (b) Curves for 90-mer PNIPAM between T = 310 K ~ 380 K, (c) Curves for 90-mer ELPs between T = 290 K ~ 320 K, (d) Curves for 90-mer ELPs between T = 325 K ~ 350 K. ...59 Figure 3.1. Idealized β-spiral structure for peptides (center). Final simulation snapshots
xii
Figure 3.2. Correlation between radius of gyration and solvent accessible surface area (SASA) of all sequences at different temperatures. Points are grouped into separate clusters in sequence poly(valine)90, poly(PV)45 and poly(VPGV)23 suggesting transition temperature (Tt) is between 300 and 305 K. Clusters below Tt are colored blue, clusters above Tt are colored red. ...78 Figure 3.3. Number of water molecules within second solvation shell (NW) of (a)
backbone and (b) sidechain groups of all sequences at different temperatures. ...79 Figure 3.4. Ratio for dehydration (npp/(npw + npp)). Figure (a) ~ (g) show the dehydration
ratios for poly(valine)90, poly(PV)45, poly(VPGV)23, poly(VPGVG)18, poly(PGV)30, poly(GVPG)23 and poly(PGVG)23. ...80 Figure 3.5. Ratio between change in interaction energy (∆E) and change in temperature
(∆T) as a function of valine concentration of sequence composition. Black curve is the change in interaction energy between polypeptides and water molecules. Red curve is the change in electrostatic interaction energy between polypeptides and water molecules. Blue curve is the change in Van Der Waals interaction energy between polypeptides and water molecules. ...81 Figure 3.6. Potential inverse transition temperature range as a function of valine content
in sequence compositions. P90 stands for the poly(proline)90, which show no clear transition. GVPG23, PGVG23 stands for poly(GVPG)23 and poly(PGVG)23, which show gradual transition as a function of temperature. ...82 Figure 3.S1. The evolution of single chain radius of gyration over a temperature range
xiii
gradual decrease. Rg of poly(proline)90 shows a relatively constant value as temperature increases. ...84 Figure 3.S2. Solvent accessible surface area (SASA) for (a) entire sequences and (b)
sidechain groups of all sequences at different temperatures. ...85 Figure 3.S3. Radial distribution function between all peptide atoms and water oxygen
atoms followed by RDFs for backbone and sidechain peptide atoms with water oxygen atoms. (a) poly(valine)90, (b) poly(PV)45, (c) poly(VPGV)23, (d) poly(VPGVG)18, (e) poly(PGV)30, (f) poly(GVPG)23, (g) poly(PGVG)23 and (h) poly(proline)90. ...88 Figure 3.S4. Interaction energy calculated via the NAMD Energy plugin and NAMD
code, normalized by the total heavy atom mass (in units of amu). Total interaction energy (a) is decomposed into (b) electrostatic interaction and (c) van der Waals interaction contributions. ...89 Figure 3.S5. Secondary structure propensities for all sequences at (a) 280 K and (b) 380
xiv LIST OF TABLES
Table 2.1. Number of Water Molecules in First Hydration Shell at both 290 and 340 K .... 42
Table 2.S1. Partial charges (e) for PNIPAM and (VPGVG)n ELPs obtained from AMBER force-field ... 51
Table 2.S2. Radius of Gyration (Rg) (Å) for PNIPAM and ELPs ... 60
Table 3.S1. Secondary structures propensities at T = 280 K ... 91
1
Chapter 1 Introduction
1.1 Background
coil-2
globule transition of polymer in solutions always tends to decrease polymer-solvent
interactions and increase polymer-polymer interactions as the solvents’ thermodynamic
quality drops. However, the theoretical understanding of nature of this thermosensitivity is
still far from complete. The quantitative detection of LCST phase phenomena is complex and cannot be fully described through the macroscopic phase transition upon heating.
Elastin-like polypeptides (ELPs) are naturally occurring polymers and known to manifest an inverse temperature transition or lower critical solution temperature (LCST) transition phase behavior in aqueous solutions. Namely, they undergo a first-order phase separation, one polypeptide-rich and one water-rich phase, above a transition temperature. 11-12 This coacervation-based LCST transition was inspired by the self-assembly of tropoelastins upon increasing the temperature. The LCST of ELPs can be tuned via pH,13 salt-ion concentration,14 sequence hydrophobicity,15-16 length,17 and molecular weight.17-19 Investigating the stimuli-responsive character of ELPs is important for the controllable functionalized soft-materials applications, including drug delivery, protein purification, bio-sensing, and tissue engineering.20-23 Despite this massive applicability in recent years, a detailed understanding of the mechanism of the LCST phase transition of ELPs is still far from complete.24-26 Further exploration of LCST transition behavior in ELPs could aid the development of new thermo-responsive soft materials.
3
around 32°C, and its thermosensitivity is independent of molar mass or concentration of the polymer. Its phase transition is believed to be determined by the equilibrium of noncovalent forces such as hydrogen bonding, hydrophobic interaction, van der Waals, and electrostatic forces.27 A variety of techniques, including turbidimetry,8 calorimetry,28-30 NMR,31-32 and light scattering, 33-35 have been carried out to investigate the LCST phase separation of PNIPAM. PNIPAM could also work as a prototype for copolymers facilitated by controlled radical polymerization. Through the free radical polymerization in solution, copolymers could be prepared from N-substituted acrylamides with varying hydrophilicity and become attractive in developing new thermoresponsive hydrogels.36 For example, the tunable LCST of thermoresponsive copolymers can help in the progression of drug delivery.37-39
4
1.2 Selections of Material
1.2.1 Elastin-like peptide (ELP)
Stimuli-responsive ELPs, which are characterized by their biocompatibility, rubber-like elasticity, biodegradability, and non-toxicity, are promising for understanding the origin and design of elastin-inspired LCST biopolymers. As a type of natural elastomeric protein, elastin provides attractive material design features for its extensibility and elasticity in vertebrate tissues applications. Sandberg et al.40 first reported and studied the repetitive-elastin, including tetra-mer VPGG, penta-mer VPGVG, and the hexa-mer VAPGVG. Tropoelastin, the soluble precursor of elastin, has well-characterized alternating hydrophobic and hydrophilic domains. The hydrophobic domains are rich in valine, proline, alanine, and glycine and can form β turns. The hydrophilic domains are rich in lysine and alanine which can form α helices.41-42
5
phase behavior.15-16 Chilkoti et al. proposed the sequence heuristics that designed protein could exhibit tunable lower or upper critical solution temperature (LCST and UCST) transitions in physiological solutions.44 They also characterized the thermally responsive behavior of ELPs by inserting alanine residues along VPGVG and obtained nine different alanine and substitution mutants of poly(VPGVG).26 Both these works exhibit thermally responsive behaviors in ELPs, which can be easily and quantitatively tuned by molecular weight and concentration of ELPs.
1.2.2 Poly(N-isopropylacrylamide) (PNIPAM)
The most commonly studied water-soluble thermoresponsive polymer, Poly(N-isopropylacrylamide) (PNIPAM), demixes upon heating to a lower critical solution temperature (LCST) in the aqueous solution. Because its LCST occurs close to human body temperature, tuning the LCST makes this water-soluble polymer ideal for biotechnology and medicine applications. The LCST of PNIPAM, TLCST ≃ 32°C, was widely cited from the pioneering work by Heskins and Guillet7, who first investigated the phase diagram of PNIPAM solution in detail. The size-dependent coil-globule transition of PNIPAM generally occurs together with the chain demixing and is believed to be the result of breakage of amide-water hydrogen bonds. Another theory suggests that the entropic gain in cage-like water structures near hydrophobic groups above LCST also account for the LCST phase separation.45
6
remain to form hydrogen bonds with water, even in the globule state. Their coil-globule transition is attributed to the partial dehydration of the polymer chain and the formation of the intra- and interchain hydrogen bonding between amide groups in PNIPAM solutions. Therefore, the coil-globule transition in PNIPAM aqueous solutions is that the polymer chain dehydrated above its LCST, and the hydrophobic interaction between isopropyl groups induces the collapse of the chain. The findings mentioned above suggest that hydration and dehydration should be the major forces responsible for the sharp demixing transition. In the past decades, several effects on the LCST of PNIPAM have been studied. The LCST of PNIPAM is proven to be affected by sequence tacticity, salt-ions, chain length, and copolymerization, etc.2, 47-48 However, the fundamental issues regarding the solvation dynamics and local structures of solvents are not fully understood.
1.3 Methods
1.3.1 Molecular dynamics
7
some electronic-scale resolution while maintaining the relatively simple program and amount of calculations. This dissertation will mainly use all-atom molecular dynamics (MD) simulation technology for two advantages. Firstly, the phase transition we studied require a detailed description of large-scale and time-dependent dynamic behavior. Secondly, MD simulation could describe the behavior of the polymer and biomolecular systems with a time scale up to the microseconds.49-50 The interatomic interactions are described by Newton’s equations of motion:
𝐹⃗𝑖 = −∇⃗⃗⃗𝑖𝑈(𝑟⃗1, 𝑟⃗2, 𝑟⃗3, … , 𝑟⃗𝑁)
With these forces, new coordinates 𝑟⃗𝑖(𝑡) and velocities 𝑉⃗⃗𝑖(𝑡) of molecules will be updated over a very short timestep. Hence, the MD systems will be heavily dependent on the potential energy U, namely force field, which is a combination of mathematical formula and associated parameters that are used to describe the energy of the biomacromolecules. The force field functional forms can be classified into two groups:
𝑈𝑡𝑜𝑡𝑎𝑙 = 𝑈𝑏𝑜𝑛𝑑𝑒𝑑+ 𝑈𝑛𝑜𝑛−𝑏𝑜𝑛𝑑𝑒𝑑
8
A general example of functional form for the AMBER force field is
𝑈 = ∑ 𝑘𝑏(𝑙 − 𝑙0)2+ 𝑏𝑜𝑛𝑑𝑠
∑ 𝑘𝑎(𝜃 − 𝜃0)2+ 𝑎𝑛𝑔𝑙𝑒𝑠
∑ ∑1
2𝑉𝑛[1 + cos(𝑛𝑤 − 𝛾)]
𝑛
(bonded)
𝑡𝑜𝑟𝑠𝑖𝑜𝑛𝑠
+ ∑ ∑ 𝑓𝑖𝑗{𝜀𝑖𝑗[(𝑟𝑟0𝑖𝑗 𝑖𝑗)
12− 2(𝑟0𝑖𝑗 𝑟𝑖𝑗)
6] + 𝑞𝑖𝑞𝑗 4𝜋𝜖0𝑟𝑖𝑗} 𝑁
𝑖=𝑗+1 𝑁−1
𝑗=1 (Non –bonded)
A variety of biomacromolecules potential functions have been systematically evaluated and compared with experimental data in the system of interest.56-58 Although the latest version of the biomacromolecules force field could accurately describe many of the thermodynamic properties of a protein, extra modifications to existing force fields are still necessary to enhance consistency with experimental data.
There are two most commonly used thermodynamic ensembles in MD simulation, the isothermal-isobaric (or NPT) ensemble, which is comparable to the experimental conditions, and canonical (or NVT) ensemble. Both ensembles need to keep the number of atoms and temperature as constant during simulation. The NPT ensemble maintains a constant pressure, and the NVT ensemble has a constant volume. Thermostat is the algorithm that was used to control the temperature, which exchanges kinetic energy with a reservoir. For pressure control, barostat was used to exchange work. Periodic boundary conditions (PBCs) were used to simulate an infinite system, which allows atoms to interact with the images of itself to ensure uniformity in solvent density.
9
order to describe different properties of water, including SPC,59 SPC/E,60 TIP3P,61 TIP4P,61 and OPC62. In describing the explicit solvent system, the accuracy of the calculated physical properties are also heavily dependent on the choice of the water model. For example, the SPC/E model is a polarized water model with a polarization correction in its potential energy function. With this energy correction, the SPC/E model surpasses the SPC model in performing density and diffusion coefficient of water.60, 63 As compared to that classical three-site model TIP3P, the four-site model TIP4P introduces a massless dummy site where the negative charge is placed and exhibits better performance in some aspects.64 However, the introduction of the dummy site in the four-site model usually brings a higher computation cost. Furthermore, all current water models available can exhibit different water properties which depend on the different degrees of accuracy. In this dissertation, TIP3P and OPC water models are most commonly used in terms of the trade-off between accuracy and computation cost.
In order to solve or integrate Newton’s equation of motion, several algorithms are developed, such as the Verlet algorithm, Leap Frog algorithm, and Velocity Verlet algorithm.65 Among those algorithms, Verlet algorithm is a foundation of them whose solution is based on a third-order Taylor series expansion on position 𝑟(𝑡), position 𝑟(𝑡), and accelerations at time 𝑡 and the position from time 𝑡 − ∆𝑡 to derive new positions at the time 𝑡 + ∆𝑡.
𝑟(𝑡 + ∆𝑡) = 2𝑟(𝑡) − 𝑟(𝑡 − ∆𝑡) + 𝑎(𝑡)∆𝑡2 + 𝑂(∆𝑡4)
There are two common problems are related to this version of the Verlet algorithm: (1) velocities are not directly generated during integration and (2) the velocity at time
10
difficulties, some variants of the Verlet integration have been developed in the leap-frog algorithm where velocities are handled more effectively.
11
Chapter 2 A comparison between the Lower
Critical Solution Temperature behavior of
polymers and biomacromolecules
Yuxin Xie,Nan K. Li,Sanket A. Deshmukh, Abhishek Singhand Yaroslava G. Yingling
12
contrast, for the long chain of PNIPAM, the structure of proximal water near its hydrophilic groups remains unaltered both below and above its LCST. However, the extent of solvation of hydrophobic groups of long-chain PNIPAM decreases significantly above its LCST as compared to below its LCST. Our simulations show an abrupt change in localized dehydration along chain, which reveals partial dehydration of polymer chain and the glouble-like structures of both long-chain (VPGVG)n ELPs and PNIPAM above their LCST are stabilized by increasing formation of intra-chain hydrogen bonding between amide groups along backbone of ELPs or on the side-chain of PNIPAMs. Our study is the first systematic computational study to probe the origin of the LCST of ELPs and PNIPAM at atomic level.
2.1 Introduction
13
PNIPAM and ELPs could better help us understanding the thermal properties of polymers and biomacromolecules.
14
investigating nature of these behaviors in polymers and biomacromolecules is important for the design of new soft-materials with controllable functionality that can be used in a variety of applications including tissue engineering, electrophoresis, and drug delivery.36, 95-97
In the following paragraphs we discuss the similarities and differences in the structural properties of PNIPAM and (VPGVG)n ELPs and the factors which affect their LCST. In PNIPAM, the hydrophilic entities are located on the side-chain and are mainly consisting of C=O and N-H groups. The hydrophobic groups including –CH2- and isopropyl groups are located on backbone and side chain of PNIPAM, respectively (See Figure 2.S1, supporting information). The addition of salt-ions, methanol, ionic liquids etc. to the solution of PNIPAM alters the interactions between solvent molecules and between solvent and PNIPAM, which leads to the change in its LCST.2, 35, 69, 77, 98 Experimentally, however, the LCST of PNIPAM is known to be independent of its molecular weight.8 The LCST of PNIPAM can also be modified by co-polymerizing PNIPAM chain with hydrophobic and/or hydrophilic co-monomers.48, 99-100 For example, co-polymerization of PNIPAM with hydrophilic monomers increases its LCST, whereas, introduction of hydrophobic monomers decreases LCST of PNIPAM.29
15
residues, like valines, and differences in overall compaction due to the change in rotational degrees of freedom within the sequence in (VPGVG)18 and (VGPVG)18.102
Despite similarities, there are many differences in structural properties of PNIPAM and (VPGVG)n ELPs. Aforementioned, hydrophilic groups are located on the side-chain for PNIPAM and on the backbone for ELP. Futscher et al. also show the role of PNIPAM backbone with respect to the hydration and partial dehydration behaviors in comparison to its monomer and suggest a major driving force responsible for the sharp demixing transition.94 ELPs are biopolymers, with sequence directionality and ability to form various secondary structures. After undergoing LCST (VPGVG)n ELPs are known to form β-turns and β-sheets, which results in a ordered hydrogen bond network in the backbone of ELPs.19, 76, 84 In contrast, PNIPAM does not have propensity to form any secondary structure. Unlike PNIPAM the LCST of ELPs strongly depends on their chain length.17 In addition, the LCST of (VPGVG)n ELPs is also observed to be more sensitive to salt-ion concentration as compared with that of PNIPAM.101 The effect of these various structural similarities and dissimilarities, in (VPGVG)n ELPs and PNIPAM, on the molecular origin and observed differences of their LCST behavior are not yet completely understood. Also, the correlation between the LCST of (VPGVG)n ELPs and its molecular weight is unclear.17-18 There is no systematic study that probes the differences in temperature-induced transitions of PNIPAM and ELPs.
16
temperature transition in both (VPGVG)n ELPs and PNIPAM. Moreover, experimentally the dynamic structure of solvent near these polymer chains is also difficult to analyze irrespective of the conformation of polymer chain.
In the present study, we employ molecular dynamics (MD) simulation to examine and compare the LCST inverse temperature transitions behaviors of single PNIPAM chains versus single (VPGVG)n ELP chains with 18 and 90 monomers (18-mer and 90-mer), in the temperature range of ~280 K to ~380 K. We performed systematic and careful examinations of structural and dynamical properties of macromolecules and water from the simulation trajectories by comparing temperature induced changes in radius of gyration (Rg), water radial distribution function (RDF) in the vicinity of the macromolecules, solvent accessible surface areas (SASA) and dehydration ratio based on hydrogen bonding analysis. To the best of our knowledge this is the first MD study that systematically probes and compares the structures of PNIPAM and (VPGVG)n ELPs as they undergo inverse temperature transition.
2.2 Computational Methods
2.2.1 Force-field
17
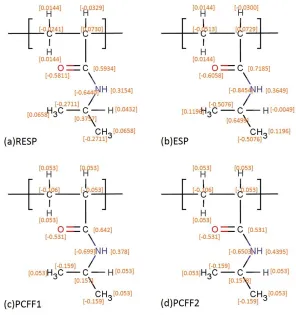
obtained from (a) The Restrained Electrostatic Potential (RESP) method109, (b) Electrostatic Potential (ESP) method109, (C) polymer consistent force-field (PCFF) parameters from reference87 and (d) Original PCFF force-field110 (See supporting information Figure 2.S2). Based on the initial analysis of Rg of PNIPAM chains conducted at 290 K and 350 K, we chose partial charges calculated by (a) The Restrained Electrostatic Potential (RESP) method (See supporting information Figure 2.S3). Figure 2.1 show the structures of PNIMA and (VPGVG)18 ELPs. For more details, the schematic and partial charges, for both PNIPAM and ELPs employed in the present study, are shown in Figure 2.S1 and Table 2.S1 of supporting information, respectively.
2.2.2 Initial structure generation:
Here we discuss the details of initial structure generation and simulation parameters for both PNIPAM and (VPGVG)n ELPs.
(a) Single PNIPAM Chain.
18
ensembles was ran for 5,000 steps. The equilibrated chains of PNIPAM were placed in a cubic simulation box and were solvated with TIP3P water molecules. The size of box was chosen to be large enough so that no polymer-polymer interactions through periodic boundary conditions can occur. For short chain PNIPAM (18-mer), simulations were performed at 280 K, 290 K, 300 K, 310 K, 320 K, 330 K, 340 K, 350 K and 360 K. Simulations with long chain (90-mer) PNIPAM, were performed at 280 K, 290 K, 300 K, 305 K, 310 K, 320 K, 330 K, 340 K, 350 K, 360 K, 370 K and 380 K.
(b) Single ELP Chain.
Urry’s β-spiral model1, 4, 113 was used as the initial configuration for (VPGVG)n ELPs of desired chain lengths and was solvated with TIP3P water model.108 For short ELP chain, temperatures at 290 K, 300 K, 305 K, 310 K, 320 K, 325 K, 340 K, 350 K and 375 K were chosen for MD simulations. For 90-mer ELP chain, simulations were performed at temperatures of 290 K, 300 K, 305 K, 310 K, 320 K, 325 K, 330 K, 335 K, 340 K and 350 K. Note, these temperature were chosen based on the experimental study of LCST phase transition of (VPGVG)n ELPs in aqueous solution.
2.2.3 MD simulation details:
19
at a 9 Å cutoff along with a 0.00001 tolerance for Ewald convergence.114 The Berendsen thermostat was used to maintain the temperature.115 The SHAKE algorithm was used to constrain bonds involving hydrogen atoms.116 MD simulation were conducted for ~100 ns with a 2 fs time step at assigned temperature to study the inverse temperature transitions in PNIPAM chains. Note, analysis of time autocorrelation function of polymer backbone suggested relaxation time of less than 40ns (See Figure 2.S4(a), (b), (c) and (d)). Thus 100 ns of production run assured the convergence of our simulations, only the last 40 ns of the trajectories from the each case were considered for statistical analysis. Similar simulation protocol has been utilized for (VPGVG)n ELPs and details of the simulations procedures are described in our previous study.19
2.2.4 Analysis methods:
The changes in Radius of Gyration (Rg) over time are employed to analyze the structural evolution of polymer chains. The Rg is a measure of the size of a group of polymer chain and it was calculated using following equation:
𝑅𝑔2 =
1
𝑀∑ 𝑚𝑖 𝑖(𝑟𝑖 − 𝑟𝑐𝑚)2
(1) Where, M is the mass of group, rcm is the center of mass position of the group, and the sum is over all the atoms in the groups.
20
the backbone and carbonyl group of PNIPAM with ow were calculated. For (VPGVG)n ELPs, RDFs were calculated for the alpha carbon and carbon atoms from C=O group in the backbone with ow.
Besides to the change in Rg of polymer chains, the LCST is also associated with the dehydration of polymer chains.117-118 Experimentally, both PNIPAM and (VPGVG)n ELPs show dehydration when temperature rises from below to above their LCST.70, 92, 117-120 This dehydration not only change the structure of water molecules near polymer but can also, significantly, modify the hydrogen bond network between polymer and water and between polymer and polymer. Therefore, we studied the hydrogen bonding characteristics between PNIPAM/(VPGVG)n ELPs and water. For two atoms to be hydrogen bonded following geometric criteria must be fulfilled:
R≤3.5 Å
Ɵ≥135°
21
simulations. We also examine the dehydration behavior of both ELPs and PNIPAMs through defining dehydration ratio which is the ratio of the number of intra-chain hydrogen bond (npp) to total hydrogen bonding (npp + npw) that forms between polymer and polymer, polymer and water (npw).
The solvent accessible surface area (SASA) is strongly related to the hydrophobic interactions in both biomolecule and synthetic polymer systems.121-123 The folding of the polypeptides is driven by the hydrophobic interactions that essentially minimize the SASA of the nonpolar solutes to water.19 Similarly, in thermo-sensitive polymers such as PNIPAM, since the driving force for the LCST transition of polymer chains is to minimize the hydrophobic surface in contact with water one would expect the decrease in the SASA.122 Solvent accessible surface area calculation were conducted using the LCPO algorithm proposed by Weiser et al.124 More specifically, we have calculated SASA for both hydrophilic and hydrophobic groups of PNIPAM and ELPs.
2.3 Results and discussion
2.3.1 Temperature dependence of Radius of Gyration (Rg) of Macromolecules
22
shown in Figures 2.2 (c) and (d), respectively. Table 2.S2 lists the mean values of Rg for PNIPAM and (VPGVG)n ELPs at all simulated temperatures. We find that the mean value of Rg for 18-mer PNIPAM decreases from 11.30.4 Å to 9.61.1 Å when temperature is raised from 280 K to 310 K. As show in Figure 2.2 (a), snapshot of polymer exhibit more than one fold in conformation for 18-mer PNIPAM at ~310 K. Similar folding of 18-mer of PNIPAM at multiple sites above its LCST has been reported in previous study by Tucker et. al.47 Interestingly, as we increase the temperature above 310 K, Rg value of PNIPAM 18-mer increases due to the thermal fluctuations. In the case of short (VPGVG)n ELPs the value of Rg oscillates around the mean value of their Rg at all studied temperatures. For example, the mean value of Rg of (VPGVG)n ELPs at ~290 K is 8.41.1 Å and it fluctuates between 7.81.4 Å to 8.71.6 Å when temperature is raised from ~300 K to ~375 K. Snapshots of 18-mer of ELPs suggest a coil-like or a rod-like geometry at all simulated temperatures. This implies that the shorter chains of (VPGVG)n ELPs does not exhibit LCST transition in the simulated temperature range in present study.
23
from ~300 K to ~330 K the value of Rg fluctuates between ~13 Å to ~14 Å. When temperature is raised above ~335 K the value of Rg drops to 12.10.5 Å. This implies that the LCST of 90-mer of ELP might be between 330 K and 340 K.
2.3.2 Solvation Shell
(a) Analysis of hydrogen bond:
Previous experimental and simulation studies suggest that the LCST transition can significantly alter the hydrogen-bonding behavior between polymer and water. To investigate the effect of LCST on the structure of hydration water and establish hydrogen bonding network between polymer and water, we analyzed simulation trajectories for both PNIPAM and (VPGVG)n ELPs at all studied temperatures using the geometric criteria defined in section 2.2.4 Analysis methods. In particular, we examine the relationship between hydrogen bonds between polymer and water (npw) and the number of water molecules (Nw) present in the first hydration shell. The correlation between Nw and npw for 18-mer and 90-mer of PNIPAM and water molecules is shown in Figures 2.3 (a) and (b), respectively. The relationship between Nw and npw for 18-mer and 90-mer (VPGVG)n ELPs and water molecules is shown in Figures 2.3 (c) and (d), respectively.
24
number of water molecules present near hydrophilic groups of 30-mer of PNIPAM were similar both below and above the LCST of PNIPAM.87 However, as can be seen in Figure 2.3 (b) when temperature is raised to above ~340 K a distinct cluster with reduced number of Nw and npw was observed. This suggests that the increase of temperature to above ~340 K disrupts the structure of water near hydrophilic groups of PNIPAM.
In the case of 90-mer of (VPGVG)n ELPs two distinct clusters one above and one below ~330 K were observed (See Figure 2.3 (d)). In particular, below ~330 K the values of Nw and npw were 124 8.6 and 132 9.7, respectively. On the other hand above ~330 K both Nw and npw decrease to 105 7.8 and 112 8.5, respectively. In our previous study the LCST of 90-mer of ELP was observed at 332.5 2.5 K.19 In addition, our study of 50-mer, 90-mer, and 150-mer of (VPGVG)n ELPs showed similar abrupt change in Nw and npw below the LCST as compared to above their respective LCST.18 Such an abrupt change in Nw and npw indicates that the interactions between the hydrophilic groups in the backbone of (VPGVG)n ELPs and water are strongly dependent on the temperature. This might lead to significantly different structure of water near the backbone of (VPGVG)n ELPs below its LCST as compared to above its LCST.
25
not shielded from the bulk water. This might facilitate the reduction of number water molecules near (VPGVG)n ELPs above the LCST as compared to below its LCST. This reduction of water molecules can further assist (VPGVG)n ELPs to form stronger hydrogen bonding network among themselves above their LCST.
The relationship between Nw and npw of short chains of both PNIPAM and ELP, as shown in Figures 2.3 (a) and (c), do not exhibit distinct clusters. In the case of short PNIPAM chain, Nw decreases from 372 to 293 and npw decreases from 3010 to 237, when temperature is increased from ~280 K to ~360 K. Similar to 90-mer PNIPAM the decrease in both Nw and npw is observed above ~340 K. This further supports the notion that interactions between PNIPAM and water is disrupted above ~340 K.
The Nw for 18-mer of (VPGVG)n ELPs decreases from 33.83.5 to 29.54 and the npw decreases from 39.63.8 to 344.5, when temperature is increased from ~290 K to ~375 K. However, similar to those of 90-mer of (VPGVG)n ELPs abrupt changes in Nw and npw below the LCST as compared to above their LCST were not observed. This suggests that the structural arrangement of water molecules near the backbone of 18-mer of (VPGVG)n ELPs does not change significantly with the increasing in temperature.
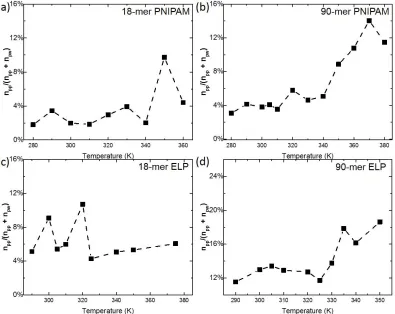
26
PNIPAM and ELP. As function of temperature, both dehydration ratio (black curves) of 18-mer ELP and 19-18-mer PNIPAM just fluctuate around its average ratio (roughly 4% for 18-18-mer PNIPAM, 6% for 18-mer ELP) in Figures 2.4 (a) and (c). This implies no significant change in dehydration. In Figures 2.4 (b) and (d), abrupt transition in dehydration during the coil-globule transition were observed. In 90-mer PNIPAM, dehydration ratio increases from 4% to roughly above 12%, accompanying with threefold intra-chain hydrogen bonding estimated to form in globule state during dehydration. In 90-mer ELPs, dehydration ratio significantly increases from 12% to above 17% around the LCST of 90-mer of (VPGVG)n ELPs at 332.5
2.5 K. Our dehydration ratio shows a partial dehydration during coil-globule transition for both 90-mer ELPs and PNIPAM, which agree well with the change of hydration states in Maeda et al.’s paper and almost step-like behavior of vibrational frequency and peak area in research of Futscher et al.46, 92-94
(b) Water distribution:
27
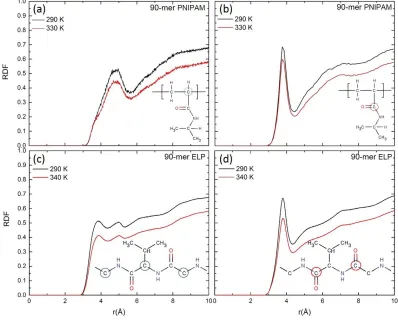
short chains of PNIPAM and (VPGVG)n ELPs both below and above the LCST. An increase in temperature leads to a gradual loss of local hydration layers, as indicated by the decrease in the heights of the RDF peaks at higher temperature. However, the difference in the peak height for 90-mer of PNIPAM is slightly prominent as compared to 18-mer of PNIPAM. Interestingly, in the case of 90-mer of (VPGVG)n ELPs a slight gap in the RDF peak intensities between the temperatures of ~330 K and ~335 K can be observed (See supporting information Figure 2.S5(d)). This gap corresponds to the same temperature window where change in the conformational properties of (VPGVG)n ELPs has occurred (See Figure 2.2 (d)). This observation suggests different structural arrangement of water molecules near 90-mer of (VPGVG)n ELPs at two temperatures (namely, ~290 K and ~340 K) and strongly supports the existence of LCST of 90-mer of (VPGVG)n ELPs between ~330 to ~335 K.19
Here we calculate and compare the RDFs for carbon atoms in backbone and carbonyl group of both 90-mer of PNIPAM and (VPGVG)n ELPs to oxygen atom of water. Note, RDFs calculated for carbon atoms in the backbone, carbonyl group of both PNIPAM and (VPGVG)n ELPs with oxygen of water and isopropyl groups in the sidechain with oxygen of water at all simulated temperatures are reported in Figures 2.S6, 2.S7 and 2.S8 of supporting information. Figures 2.5 (a) and (b) depict the RDFs of carbon atoms in the >CH- group in the backbone and carbonyl group of 90-mer of PNIPAM with the oxygen atom of water at ~290 K and ~330 K, respectively. Figures 2.5 (c) and (d) show the RDFs for alpha carbon and carbon atoms from C=O group in backbone of 90-mer of (VPGVG)n ELPs with oxygen atom of water at ~290 K and ~340 K, respectively.
28
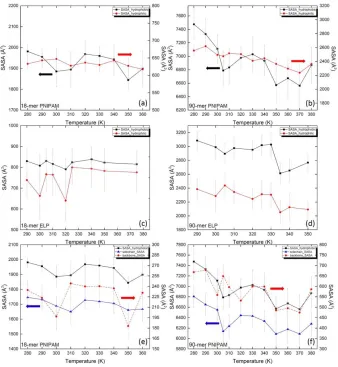
29 (c) Solvent accessible surface area (SASA):
30
of black curve of 90-mer of PNIPAM, the SASA of hydrophobic groups decreases from 7475
229 Å2 to 6833 247 Å2 when temperature is raised from below to above the LCST of PNIPAM, namely from ~280 K to ~310 K. The observed decrease in SASA of hydrophobic groups of both 18-mer and 90-mer PNIPAM above their LCST can be attributed to the dehydration of PNIPAM chain due to its LCST inverse temperature transition.
In Figures 2.6 (c) and (d) SASA for hydrophilic and hydrophobic groups of short and long chains of (VPGVG)n ELPs are shown at all simulated temperatures, respectively. We find that both black and red curves, SASA of hydrophobic and hydrophilic groups for short chains of (VPGVG)n ELPs, fluctuate around its mean value for the simulation temperatures from ~290 K to ~360 K. In contrast, in case of 90-mer (VPGVG)n ELPs, black and red curves fluctuate gradually when temperature is increased from ~290 K to ~330 K, respectively. As temperatures is raised to ~335 K, both SASA values drop significantly. The abrupt decrease in both SASA of hydrophilic and hydrophobic groups can be seen in the temperature range from ~330 K to ~335 K which coincides with the same temperature window where change in the hydrogen bond characteristics and conformation of 90-mer of (VPGVG)n ELPs has been observed (See Section 2.3.2 (a)). This finding further supports the notion that the LCST of 90-mer of (VPGVG)n ELPs is at 332.5 2.5 K.18
31
~305 K. This suggests that the dehydration of the isopropyl groups present in the side-chain of PNIPAM play an important role in determining the LCST transition in PNIPAM.
The analysis of SASA shown in Figure 2.6 indicates that the origin of the LCST transition in both (VPGVG)n ELPs and PNIPAM might be associated with decrease in SASA. In particular, the SASA of both hydrophilic and hydrophobic groups of 90-mer of (VPGVG)n ELPs decreases when temperature is raised above the LCST of (VPGVG)n ELPs (Temperature > ~330 K). However, in the case of 90-mer of PNIPAM a significant decrease in the SASA of only the hydrophobic groups present in the side-chain of PNIPAM, namely isopropyl group, is observed. This implies that the mechanism of the LCST transition in (VPGVG)n ELPs might be different than PNIPAM. Specifically, in the case of PNIPAM the dehydration of hydrophobic groups present in the side-chain of PNIPAM, namely isopropyl group, drives the LCST transition. On the other hand, the LCST transition in (VPGVG)n ELPs can be associated with the dehydration of both hydrophilic and hydrophobic groups. Moreover, decrease in the SASA near hydrophilic groups in the backbone of (VPGVG)n ELPs could facilitate the formation β-sheets,19 which is a well-organized hydrogen bonded network in the backbone of peptides.
2.3.3 Analysis of Hydrogen Bonds between Polymer and Polymer
32
number of hydrogen bonds between polymer and polymer increase above the LCST of PNIPAM (Temperature >> ~310 K). This could be due to the fact that the structure of water near hydrophilic groups of 18-mer and 90-mer of PNIPAM changes slightly as the temperature is raised above its LCST (See Section 2.3.2 (b) and Figure 2.S5). The increase in the extent of hydrogen bonds between polymer and polymer might assist the PNIPAM chain to stabilize its conformation above its LCST inverse temperature transition.
Figures 2.7 (c) and (d) show the number of hydrogen bonds between peptide and peptide per amino acid residues in both short and long chains of (VPGVG)n ELPs, respectively. In the case of short chains of (VPGVG)n ELPs as can be seen in Figure 2.7 (c) there is no significant change in the number of hydrogen bonds at all simulated temperatures. This could be because the extent of solvation does not change for short chains of (VPGVG)n ELPs at all simulated temperature(See section 2.3.2 (b) and 2.3.2 (c)), which prohibits the hydrogen bond formation between (VPGVG)n ELPs. In the case of 90-mer of (VPGVG)n ELPs significant increase in the intra-peptide hydrogen bonds can be observed at ~350 K. This suggests that due to structural rearrangement in the first and second hydration shell of the backbone of (VPGVG)n ELPs (See Section 2.3.2 (b)) above their LCST (T >= ~335 K) the number of peptide-peptide hydrogen bonds has increased. This increase in intra-peptide hydrogen bonds might stabilize the structure of (VPGVG)n ELPs above its LCST. Overall, the contribution of intra-peptide hydration and strength of intra-molecular peptide interaction become accentuated in a critical temperature window (i.e., at around ~330 K to ~335 K).
33
34
2.4 Conclusions
All-atom molecular dynamics (MD) simulations of elastin-like polypeptides (ELPs) and poly(N-isopropylacrylamide) (PNIPAM) in aqueous solutions were conducted to investigate the LCST transition and solvation dynamics. Single chains of ELPs with Val-Pro-Gly-Val-Gly (VPGVG) sequence and PNIPAM with 18 and 90 monomer units (18-mer and 90-mer) were studied at a range of temperatures from ~280 K to ~380 K. The analysis of simulation trajectories revealed that the value of radius of gyration (Rg) for (VPGVG)n ELPs with 18-mer fluctuates around the average value, suggesting lack of LCST inverse temperature transition in 18-mer of (VPGVG)n ELPs. The simulations of 18-mer of PNIPAM may imply presence of LCST transition through the decrease in the value of Rg and the presence of PNIPAM chains configurations with multiple folds when temperature is raised above ~305 K. In the case of 90-mer of PNIPAM a significant decrease in the Rg value was observed upon increasing temperature above their respective LCST. A gradual transition to a reduced radius of gyration was observed for 90-mer of (VPGVG)n ELPs, which is also described as smooth-shifts of structural transitions under single-molecule scale from Tarakanova et al.86 This decrease in the Rg suggests presence of compact structures of (VPGVG)n ELPs and PNIPAM above their LCST as compared to below their LCST.
35
LCST transition. However, in the case of 90-mer (VPGVG)n ELPs, two different clusters of npw and Nw can be observed below and above its LCST. This suggests that structure of water near the hydrophilic groups of 90-mer (VPGVG)n ELPs changes when the temperature is raised above their LCST. Abrupt transition in partial dehydration along polymer chain between amide groups were observed for both 90-mer PNIPAM and 90-mer (VPGVG)n ELPs. This localized transition during dehydration might not translated to the abrupt coil collapse which support a collective phenomenon that originates from the correlated gradual changes in a single polypeptide.
36
37
38
Figure 2. 2: The radius of gyration as a function of temperature. Snapshots showing
39
40
41
42
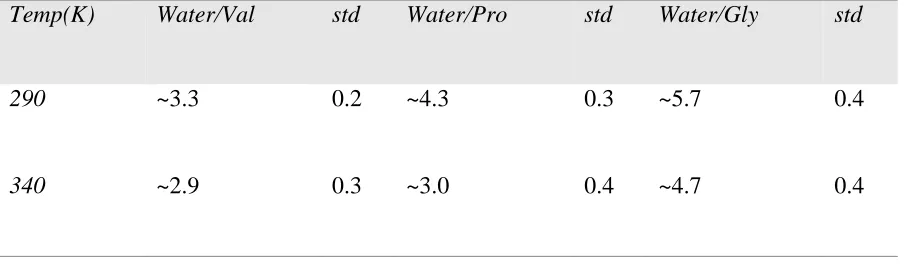
Table 2. 1. Number of Water Molecules in First Hydration Shell at both 290 and 340 K
Temp(K) Water/Val std Water/Pro std Water/Gly std
290 ~3.3 0.2 ~4.3 0.3 ~5.7 0.4
43
44
45
46
2.5 Supporting information
Content List:
A. Schematic of PNIPAM and (VPGVG)n ELP B. Calculations of Partial Charges on PNIPAM C. Polymer Relaxation Time
D. Radial Distribution Function of PNIPAM and (VPGVG)n ELPs E. Probability Distribution
47 A.
Figure 2.S1.Schematic of (a) PNIPAM and (b) (VPGVG)n ELPs.
B. Calculations of Partial Charges on PNIPAM:
48
Figure 2.S2. Partial charges calculated from different methods or different force field. Previous experimental and computations studies show a clear difference in the Rg of
49
50
51
Table 2.S1. Partial charges (e) for PNIPAM and (VPGVG)n ELPs obtained from AMBER force-field
Partial charges of PNIPAM
Atom C1 C2 H1 H2 C3 O N H3 C4 H4 C5 H5
Partial Charge s (e)
-0.0241
0.0730 0.0144 -0.0329
0.5934 -0.5811
-0.6440
0.3154 0.3757 0.0432 -0.2711
0.0 65 8 Partial charges of VPGVG
Atom C1 C2 O1 N1 H1 H2 C3 H3 C4 O2 N2 C5
Partial Charge s (e)
0.5973 -0.0252
-0.5679
-0.4157
0.0698 0.2719 -0.0875
0.0969 0.5896 -0.5748 -0.2548 -0.0 26 6
Atom C6 C7 C8 C9 C10 H4 H5 H6 H7 H8 H9
Partial Charge s (e)
-0.0070
0.0189 0.0192 0.2985 -0.3192
-0.0297
52 C. Polymer Relaxation Time:
To confirm the convergence of the polymer chains we analyzed the orientational relaxation of backbone carbon-carbon bonds.125 To calculate orientational relaxation a unit vector 𝒃̂𝒊 was assigned along each C-C bond in the backbone of PNIPAM (CH2-CH bond) and ELPs (Cα-Cα bond) as well as a second unit vector 𝒅̂𝑖 that is normal to each pair of adjacent skeletal bonds, originating at their common C atom. The vectors 𝒃̂𝒊and 𝒅̂𝑖 were calculated by using following equation:
𝒃̂𝒊 = 𝒓𝒊+𝟏 − 𝒓𝒊 |𝒓𝒊+𝟏 − 𝒓𝒊 |
Eq. S1
𝒅̂𝑖 =
𝒃
̂𝒊+𝟏× 𝒃̂𝒊 |𝒃̂𝒊+𝟏× 𝒃̂𝒊|
Eq. S2
Where 𝒅̂𝑖 = out-of-plane vector.126
The time evolution of these two types of vectors was followed by constructing time autocorrelation functions in terms of the first (𝑷𝟏) and second order (𝑷𝟐) Legendre polynomials of the first kind. The 𝑷𝟏 and 𝑷𝟐can be represented as:
𝑷𝟏(𝒕; 𝒖̂𝒊) = 𝒄𝒐𝒔 𝛽
Eq. S3
𝑷𝟐(𝒕; 𝒖̂𝒊) =
𝟏
53
Eq. S4
𝒄𝒐𝒔 𝛽 = 𝒖̂𝒊(𝒕) ∙ 𝒖̂𝒊(𝟎)
54
55 D. Radial Distribution Function (RDF):
Figure 2.S5, 2.S6, 2.S7, and 2.S8 show the RDF of PNIPAM and (VPGVG)n ELPs with water molecules at all simulated temperature.
56
57
58
59 E. Probability Distribution
60 F. Radius of gyration
Table 2.S2. Radius of Gyration (Rg) (Å) for PNIPAM and ELPs
Temper ature(K ) (Å)
28
61
Chapter 3 Lower Critical Solution
Temperature behaviors of Elastin-like
Polypeptides: the effect of sequence
composition
Yuxin Xie, Albert L. Kwansa and Yaroslava G. Yingling
62
from localized dehydration along amide groups. Thus, these localized dehydration transitions depend on sequence composition.
3.1 Introduction
Inverse temperature transition of polypeptides, like elastin-like polypeptides(ELP), can be induced by raising the temperature from below to above their lower critical solution temperature (LCST).67 In other words, polypeptides can form insoluble aggregates in aqueous solutions when the temperature is raised above their LCST and become soluble when the temperature is decreased below their LCST. Most of the polypeptides with various sequence compositions are known to exhibit a first-order transition temperature (Tt) or manifest LCST inverse temperature transition.3-4, 12, 69-70 There has been much interest in the LCST behavior of elastin-like polypeptides (ELP), whose LCST behaviors depend on properties such as chain length, sequence, concentration, pH, ionic strength in aqueous solutions, etc. The poly(VPGVG) is most widely studied polypeptides and has been generalized into the poly(VPGXG) by Urry, where (X) is a guest residue that can be any natural amino acid except proline. Since the systematic understanding of the physical origins of inverse temperature transition is still missing, a detailed comparison and exploration of inverse temperature transition in polypeptides could aid the understanding of the thermal responsive properties of soft-materials and the design of new soft-materials. Those new soft materials with controllable functionality; such knowledge can be used in a variety of applications including tissue engineering, electrophoresis, and drug delivery.36, 95-97
63
changing the salt concentration101, and LCST strongly depends on the molecular weight of the polypeptide.17-19 Moreover, changes in the position and sequence of amino acids in ELPs can also significantly alter their LCST.44, 76 For example, the LCST of (VPGVG)n ELPs was increased by substituting the hydrophobic valine in its fourth position with the hydrophobic alanine and glycine.16 Previously, we proposed that the LCST phase behavior of (VPGVG)n ELPs is a collective phenomenon that originates from the correlated gradual changes in a single polypeptide structure and the abrupt change in properties of water around the peptide. We also proposed that this is a result of a competition between peptide and peptide-water interactions.18-19 Furthermore, Tarakanova et al. show that the molecular collapse of a single ELP involves a gradual shift from extended to contracted structures as the temperature is raised above LCST.86 The phase transition of aqueous solutions of PIPA (poly(N-isopropylacrylamide)) has been explained by a coil-globule transition.127 Specifically, coil-globule transition of PIPA investigated by Fourier transform infrared (FTIR) spectroscopy was associated with the polymer’s hydration state. Approximately 13% of C=O groups were dehydrated and formed intra- or interchain hydrogen bonds with amide groups, while 87% of C=O groups formed hydrogen bonds with water even in the globular state.46 Thus, Maeda et al. proposed a model of partial dehydration of polymer chains and the formation of intra- and interchain hydrogen bonds between amide groups in PIPA solutions during coil-globule transitions. 38, 84-86
64
example, we could adjust the amino acid content of sequence in favor of a more hydrophobic system. Meanwhile, the understanding of how the amino acid content influences polypeptide properties and phase transition behaviors is still far from obvious. In order to encode lower or upper critical solution temperature (LCST or UCST) phase behavior in intrinsically disordered proteins, Chilkoti et al. proposed sequence heuristics for tunable LCST and UCST transitions of synthetic proteins in physiological solutions.44
65
3.2 Materials and Computational Methods
The AMBER 16106-107 simulation package was used to conduct all-atom MD simulations of a single polypeptide chain solvated in physiological solutions. The FF14SB force field106, 129 was utilized for peptides, and water was modeled with the OPC62 model. Urry’s β-spiral model,4, 13, 113 which was popular for previous studies on polypeptides,18-19, 130-131 was used as the initial conformation (Figure 3.1, middle) for all eight polypeptide sequences (Figure 3.1, top and bottom); each polypeptide was solvated in water with 0.5-M NaCl. Each solvated polypeptide system – poly(valine)90, poly(PV)45, poly(VPGV)23, poly(VPGVG)18, poly(PGV)30, poly(GVPG)23, poly(PGVG)23 and poly(proline)90 – was simulated at 290, 300, 310, 320, 330, 340, 350, 360 and 380 K. These temperatures were chosen based on an experimental study of LCST phase transitions of (VPGVG)n ELPs in aqueous solution.
66
production simulations were conducted for ~200 ns with a 2-fs time step at the assigned temperature to study the inverse temperature transitions in peptide chains. Only the last 100 ns of the trajectories from each case were considered for statistical analysis. A similar simulation protocol has been utilized for (VPGVG)n ELPs, and details of the simulations procedures are described in our previous study.19 The NAMD Energy plugin and NAMD 2.7 code was used to calculate interaction energy.132
3.2.1 Analysis method
Local ordering of water molecules located close to the peptide chains below and above the LCST were probed by radial distribution functions (RDFs). We have calculated the RDFs for backbone and sidechain atoms of the peptide with the oxygen atom of the water molecules. Further analysis on solvation shells are employed to count the number of water molecules within the second solvation shell. The second solvation shell distance was defined based on the second minimum from RDFs between peptides and water oxygen atoms. Radius of gyration (Rg) is a measurement of the compactness of macromolecules. In general, a smaller Rg value indicates a collapsed or globule-like structure of macromolecules. Previous simulation results show that single polypeptide could adopt a collapsed state at high temperature through a gradual decrease in Rg. Our temporal evolution data of Rg at various temperatures are displayed in Figure 3.S1.
67
the hydrogen bond network between peptides and water and between peptides and peptides. Therefore, we studied the hydrogen bonding characteristics between peptides and water. For two atoms to be hydrogen bonded, the following geometric criteria are often employed: R ≤
3.5 Å and Ɵ ≥ 135°, where R represents the distance between an acceptor heavy atom and a donor heavy atom and θ is the cutoff angle between an acceptor heavy atom, donor hydrogen atom, and donor heavy atom (O….H-O). In the present study, the distance between donor and acceptor atoms of polymer and water was defined based on the first peak in the RDF of peptide hydrophilic groups with water. Furthermore, we examined the dehydration behavior of all eight different peptide sequences by defining a dehydration ratio, which is the ratio of the number of intra-chain hydrogen bonds (npp) to total hydrogen bonds (npp + npw), where npw represents peptide-water hydrogen bonds.
68
3.3 Results and Discussion
3.3.1 Solvation shell
(a) Radius of gyration (Rg) and solvent-accessible surface area (SASA):
The coil-globule transition of a single chain was based on the analysis of the radius of gyration (Rg). The correlation between the Rg value and SASA helps to explore the relationship between compactness and the solvation structure of peptides as a function of temperature. SASA is an important element in the analysis of folding and peptide-peptide hydrophobic interactions. The concept of SASA not only provides a convenient way to define the peptide surface as a geometric measure but also works as a gain in hydrophobic interaction free energy that is accompanied by a reduction in SASA.133 Previous simulations suggest that the LCST behavior of (VPGVG)18 may be associated with an abrupt decrease in SASA19. Correlations between Rg and SASA of all sequences at different temperatures are shown in Figure 3.2. Overall, both the values of Rg and SASA, in the Rg–SASA space, decrease as temperature increases, which indicates more compact solvated structures. We also observed that, for some sequences, namely, poly(valine)90, poly(PV)45 and poly(VPGV)23, their data points grouped into two separate clusters suggesting induced transitions. Transition temperature (Tt) is found between two distinct temperature-based clusters in the Rg–SASA space, namely, between 300 and 305 K.