DOI: 10.1534/genetics.107.080630
Population Genetic Inference From Resequencing Data
Rong Jiang,* Simon Tavare´*
,†and Paul Marjoram
‡,1*Molecular and Computational Biology Program, University of Southern California, Los Angeles, California 90089-2910,‡Department of Preventive Medicine, Keck School of Medicine, University of Southern California, Los Angeles, California 90089
and†Department of Oncology, University of Cambridge, Cambridge CB2 0RE, United Kingdom Manuscript received August 15, 2007
Accepted for publication October 31, 2008
ABSTRACT
This article is concerned with statistical modeling of shotgun resequencing data and the use of such data for population genetic inference. We model data produced by sequencing-by-synthesis technologies such as the Solexa, 454, and polymerase colony (polony) systems, whose use is becoming increasingly widespread. We show how such data can be used to estimate evolutionary parameters (mutation and recombination rates), despite the fact that the data do not necessarily provide complete or aligned sequence information. We also present two refinements of our methods: one that is more robust to sequencing errors and another that can be used when no reference genome is available.
S
ANGER sequencing and fluorescence-based elec-trophoresis technologies are currently the stan-dard methods for DNA sequencing. However, there is widespread interest in improving the efficiency with which sequence information can be obtained. Conse-quently, many novel sequencing technologies are being developed. Shendure et al. (2005a) reviews low-costsequencing technologies, which can be classified into five groups: microelectrophoretic methods, sequencing by hybridization, cyclic-array sequencing on amplified molecules, cyclic-array sequencing on single molecules, and noncyclical, single-molecule, real-time methods.
Johnsonand Slatkin(2006) developed methods for
estimation of the mutation rate and the growth rate for Sanger shotgun sequencing data from metagenomic projects. In this article we develop tools that can be applied to the analysis of data resulting from resequenc-ing technology. Such methods are rapidly growresequenc-ing in popularity and raise a variety of interesting practical and theoretical questions (e.g., Korbelet al.2007; Brockman
et al.2008; Hillieret al.2008). In this article we show how
these data can be used to infer evolutionary parameters, such as mutation and recombination rates. We focus on three such systems: Solexa, 454, and polymerase colony (polony) sequencing (cf.Jarvie2005). These methods
are massively parallel and thereby offer the opportunity to improve, by several orders of magnitude, the speed with which sequence information is obtained. However, the technologies typically result in imperfect coverage of any given region of interest. While we develop inference methods for these three technologies in particular, our methods could easily be adapted to other similar
techniques. In essence these methods first break geno-mic DNA into fragments from which library molecules are constructed. These library molecules are then clon-ally amplified in a highly parallel array and used as templates for sequencing by synthesis. Differences be-tween the systems include the nature of the array surface and the type of sequencing chemistry that is used (Bentley 2006). These differences affect the details
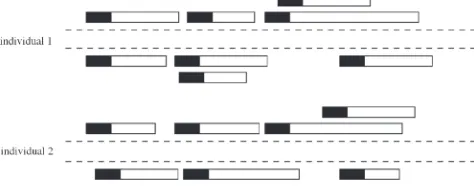
but not the spirit of the methods we introduce in this article. We now briefly summarize the three technologies (see also Figure 1). Each of them begins by randomly fragmenting the entire genome.
In the Solexa system (www.illumina.com) the frag-ments are then covalently attached to a planar surface and amplified in situ. Sequencing is performed in an iterative fashion using a mixture of four fluorescently labeled reversible chain terminators and DNA poly-merases. The resulting data consist of regions of 20–50 bases at one end, or at both ends, of the fragment.
In the 454 system (www.454.com) (Margulieset al.
2005) specialized common adapters are added to the fragments. The fragments are then captured on beads and clonally amplified in aqueous-oil emulsion. Beads are placed in individual microfabricated picoliter wells for pyrosequencing. The resulting data typically consist of sequence information for regions of200–300 bases at one end or at both ends of the fragment.
In polony sequencing (http://arep.med.harvard.edu/ Polonator/) molecules are immobilized with a polyacryl-amide gel on a microscope slide and amplified by forming polymerase colonies (Shendureet al.2005b). A four-color
sequencing-by-ligation scheme is used to generate reads and 13 bp at each end of a read are obtained.
We note that resequencing technology is a moving target in the sense that the details are evolving. For 1Corresponding author:Department of Preventive Medicine, Keck School
of Medicine, University of Southern California, 1540 Alcazar St., CHP-220, Los Angeles, CA 90089. E-mail: [email protected]
example, the number of bases in a typical read has changed over time. The methods in this article are robust to changes in parameters such as the exact number of bases per read or whether one or both ends of fragments are sequenced.
BACKGROUND
Each of the above technologies results in multiple short sequence fragments. We assume that the left ends of these fragments are sequenced and we refer to these sequenced portions as ‘‘reads’’ in this article. Finally, we initially assume that the reads have been uniquely mapped in the reference genome, regardless of the presence of poly-morphism (but we relax this assumption later).
We wish to use these reads to infer population genetic parameters. Specifically, we explore the following ques-tion: When using data from reads, what degree of genome coverage is needed to estimate accurately population genetic parameters? Since fragments are created by a physical shearing process, it is a reasonable first approximation to assume that their left endpoints are randomly positioned along the genome. Specifi-cally, we can view the start point of reads as occurring according to a Poisson process of rate l along the genome. If several copies of the region of interest are fragmented according to independent shearing pro-cesses, the resulting process of left-hand ends is still a Poisson process but with a different value ofl.
We now consider the estimation of genetic parame-ters from a random sample of diploid individuals who have been resequenced at a chromosomal segment of interest. It is well known that the number of segregating sites and the haplotype configuration at two-locus pairs in a sample are informative about the mutation para-meteru and recombination parameter r, respectively (Watterson1975; Hudsonand Kaplan1985; Hudson
2001). In the present context we encounter a missing data problem. At any particular location in the genome, we have sequence data only for those individuals in the sample that have reads covering that position. As a result, some segregating sites are not detected due to lack of coverage, and some two-locus genotype config-urations (which we use later as part of our method for
estimating recombination rate) are not available be-cause loci may not have complete sequence information for all individuals.
Hudson (2001) used two-locus sampling
distribu-tions to estimate recombination rates from SNP data. Hudson’s method involves calculating a composite prod-uct likelihood and can be applied to diploid samples. Each term of this product corresponds to the probabil-ity of the observed SNP genotype configuration at a particular pair of loci, the product being taken across all pairs of loci. However, we note one complicating factor related to diploids: given that we observe data from reads at a particular locus for an individual, we can-not tell (using current applications of the technolo-gies we study) whether one or both alleles have been sequenced.
We assume that the read length is constant and initially we assume that there are no sequencing errors. We focus primarily on results for single-end reads from the Solexa system and outline extensions to the other two systems in thediscussion.
RESULTS
We now present results for estimating the mutation parameter u and recombination parameter r for rese-quencing data from diploid individuals, assuming no sequencing errors. We then adapt our approach to deal with two types of sequencing errors. Finally, we address the issue of inference when there is no reference genome. For convenience, we list our notation in Table 1. Estimating u: We first derive a point estimator foru
and then give simulation results to assess its perfor-mance. The key to estimating u from read data is to calculate the probability of detecting a segregating site, which enables us to apply Watterson’s estimator. The probability of detecting a segregating site in a diploid sample of sizemis the same as that in the corresponding haploid sample of size 2m, because it requires only that we observe two different types at the locus. Using the Figure1.—Illustration of Solexa reads in diploid
individu-als. Rectangles denote fragments, with the solid portion indi-cating the region that is sequenced for that fragment.
TABLE 1
Notation for analysis of reads
Symbol Meaning
m No. of diploid individuals in the sample n 2m,i.e., no. of chromosomes
G Length of resequenced region in base pairs l Length of a read in base pairs
l Rate of Poisson process X¼ll Expected coverage per haploid
u Mutation parameter
r Recombination parameter
S No. of SNPs in the sample ST No. of SNPs detected by reads
notation in Table 1, we have the following (proofs are deferred to theappendix):
1. The probabilityq1that a random point, in a single
copy of a genome, is covered by at least one read is
q1¼1eX: ð1Þ
The expected total length of covered regions isGq1.
2. The probabilityq2(b) that a segregating site with b
mutants in a sample of size n ¼ 2m is detected by reads is
q2ðbÞ ¼ ð1 ð1q1ÞbÞ ð1 ð1q1ÞnbÞ; ð2Þ
for 1,b,n.
3. Under a constant population size coalescent model, the probabilityq3that a segregating site is detected by
reads is
q3¼ X n1
b¼1
qnbq2ðbÞ; ð3Þ
whereqnb¼ ð1=bÞðPn
1
k¼11=kÞ 1
is the probability that a mutant is representedbtimes in the sample of sizen (Griffithsand Tavare´1998).
4. The expected number of detected SNPs is
E½ST ¼q3E½S ¼q3u Xn1
i¼1
1
i: ð4Þ
Hence we obtain the point estimator ofufor read data,
ˆ
u¼ ST
q3Pn1i¼1ð1=iÞ
: ð5Þ
Note that these probabilities (e.g.,q3) depend only onX,
the expected coverage of reads per region. Figure 2 shows the proportion of the region covered for any given individual (q1) and the number of detected SNPs
(ST) in graphical form, based on simulation of 25
diploid individuals over 1000 replicate data sets; circles refer to values obtained by the simulation and the solid line is based on the formulas above. Simulated values agree closely with the analytical predictions.
We now use the result in (5) to estimateu. To assess performance we use standard coalescent simulations to generate 1000 samples of 25 diploid individuals (i.e.,n¼
2325¼50) with fixed values ofuandr,e.g., (100, 20) and (400, 20), for a 100-kb region. For each chromo-some, we simulate the start point of reads as indepen-dent Poisson processes, and reads are assumed to be of length 36 bp. We record the number of segregating sites detected by reads, ST, and report point estimates of u
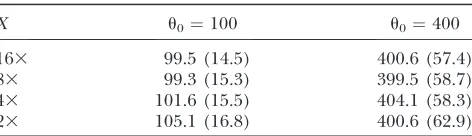
obtained using Equation 5. The mean and root mean square error (RMSE) are listed in Table 2. As we can see, the number of segregating sites detected by reads,ST, is
highly informative foru, with the variance increasing as the coverage decreases.
Application to data: It is, of course, of interest to apply our methods to existing data sets. Given the new nature of the technology, and the fact that the aim of our article is to anticipate the need for analysis meth-odologies for forthcoming data, we find ourselves in a situation in which there are very few publicly available resequencing data. For this reason we use a data set that was analyzed in Hellmannet al.(2008), an article that
shotgun sequence data from Venteret al.(2001). Those
data consist of contigs from seven human individuals. The average number of reads per base, across the sample, is about five, leading to an expected coverage of 0.36 per haploid. Consequently, we apply our method for estimation of mutation rate to these data and compare results to those of Hellmann et al. (2008).
However, we note that the depth of coverage in these data does not allow for application of the estimator for recombination rates that we present later in this article. In the method of Hellmann et al. (2008), each
chromosome is treated as a collection of segments, each segment being defined as the maximal continuous region over which the observed coverage is constant. This raises a key issue: when coverage is low, or varies significantly over the genome due to the existence of repetitive regions, for example, the use of an estimator, such as ours, that conditions on theoretical expectation of coverage rather than the coverage actually observed may be suboptimal. To assess this issue, when analyzing these data we also present results for a version of our method that conditions on the observed coverage. We now detail this modification.
The key to our method for estimating u is the calculation of the probability that a segregating site is detected. To calculate this probability conditional on the observed coverage within a segment, where seg-ments are defined as regions of maximal length over which coverage is constant, we consider a particular segregating site, in a particular segment v, and let r denote the number of reads observed to cover that site. We first condition on the number of mutant alleles at the segregating site (i.e.,b) and calculate the probability of detecting this segregating site as
q2ðb;rÞ ¼1 ð1b=nÞr ðb=nÞr ð6Þ
(cf. Equation 2), where n is the number of (haploid) chromosomes. We then substitute into Equation 3 to obtain the conditional probability of detecting a segre-gating site, givenrobserved reads as
q3ðrÞ ¼X n1
b¼1
q2ðb;rÞqnb; ð7Þ
where, as before,qnbis the probability of there beingb mutants at a segregating site. The point estimator ofu
per base for the region covered byrreads is then
ˆ
u¼ sv
q3ðrÞlvPn1i¼1ð1=iÞ
; ð8Þ
wheresvis the number of detected segregating sites and lvis the length of segmentv.
We then write the overall estimate ofuas
ˆ
u¼
PV v¼1sv ðPn1
i¼1ð1=iÞÞ PV
v¼1q3ðrvÞlv
; ð9Þ
whereVis the total number of segments (wherer.0). Results are listed in Table 3. As well as analyzing the data of Venteret al.(2001) (the first row of results), we
present analyses of a set of 1000 simulated data sets (the second row of results) designed to assess the generality of our conclusions. We report both the mean and the RMSE of the resultingu-estimates for the 1000 analyses. We simulated 10-kb regions forn¼20 haplotypes using a mutation rate ofu¼1/kb and further simulated short reads of length 100 bp with an expected coverage of 0.5, without sequencing error. In column a we show the results of applying the method of Hellmannet al.
(2008), in column b we give results for the method presented in this article, and in column c we report results for the extension of our approach to perform calculations conditional onobservedrather thanexpected coverage. Existing estimates foru in the region corre-sponding to the data of Hellmann et al. (2008) are 1.0/kb (Halushkaet al.1999, reported as 1.5/kb for
silent substitutions and 1.05/kb for introns), suggesting that our method may perform somewhat better than that of Hellmann et al. (2008). The analyses of the
simulated data suggest that this might be true in gen-eral, since we obtain both a smaller bias and a smaller RMSE. Finally, we note that, across the scenarios con-sidered in this article, as is suggested by the results in Table 3, there appears to be little measurable difference in performance between the versions of our estimator based on expected and observed coverage (results not TABLE 2
Estimatinguusing resequencing data
X u0¼100 u0¼400
163 99.5 (14.5) 400.6 (57.4)
83 99.3 (15.3) 399.5 (58.7)
43 101.6 (15.5) 404.1 (58.3)
23 105.1 (16.8) 400.6 (62.9)
The recombination parameter is fixed atr¼20. We report the mean (and RMSE) of the estimates over 1000 simulations.
TABLE 3
Comparisons of estimates ofu(per kb) for the data of VENTER et al.(2001) and for a set of 1000 simulated data sets
Data a b c
Celera data 1.67 1.13 1.21
Simulated data 1.68 (0.9) 1.36 (0.6) 1.39 (0.6)
shown). However, when coverage levels are very low, it may be the case that conditioning on observed coverage would show an improvement in performance.
Estimating r: When estimating r we adapt the
approximate product-likelihood approach of Hudson
(2001). The major difficulty here is that we cannot determine the genotypes of individuals with certainty. Suppose two alleles exist at a given polymorphic locus. For now, we assume that bases are called correctly. Consequently, for any given individual, if we observe two types at that locus, we know that we have sequenced both alleles and that the individual is a heterozygote. However, if only one type is observed, two explanations are possible: (i) the individual is homozygous at that position and we have sequenced one or both alleles or (ii) the individual is heterozygous but we have only sequenced one allele. The probability of the second of these two situations decreases as the number of reads at that locus for that individual increases (and can be calculated directly). Thus, we propose a pragmatic approach in which data are included in the analysis if either of the following ‘‘read criteria’’ are satisfied: (1) we observe two different sequence types or (2) we observe one type and there are at least NT reads, for
that individual at that locus. We vary the value ofNTto
find a good choice for a given coverageX.
In addition to the above, we make a further adjust-ment to the approximate product-likelihood approach of Hudson(2001) to deal with the imperfect coverage
that results from read data. Hudson’s method relies upon lookup tables that contain empirical estimates of the probability of observing each possible two-locus genotype configuration for a givenr and sample size. Each lookup table gives results for a range ofr-values and a particular sample size. In traditional applications a single lookup table is used, corresponding to the appropriate sample sizen. In our context, due to (a) incomplete read coverage and (b) the fact that we discard genotypes not meeting the read criteria given earlier, we do not have full data. For example, if for the jth two-locus pair, onlyNjindividuals meet either of the two read criteria given above at both loci, we then use the lookup table of size nj ¼ 2Nj to find the sample probability for this diploid configuration. SinceNjvaries between locus pairs, the lookup table that we use will also vary from pair to pair.
We now present a more formal description. Let mj denote a two-locus genotype configuration obtained from full sequence data overnchromosomes. Letpn(mj;
r) denote the probability of this configuration givenr. The composite likelihood of the full sample is defined as
LðrÞ ¼Y j
pnðmj;rÞ: ð10Þ
In the present setting we letmj˜ be the configuration of thejth two-locus pair we observe from reads meeting the
read criteria. Suppose there areNjindividuals that meet the read criteria for both loci of this locus pair. We then use the tabulated two-locus sampling distribution of size nj¼2Njto look up the value of the likelihood ofmj˜ given
r, denoted bypnjðmj˜ ;rÞ, which we then use as a surrogate
for pn(mj; r) in the above expression. Therefore, we write the approximate product likelihood as
˜
LðrÞ ¼Y j
pnjðm˜j;rÞ: ð11Þ
Finally, we compute the approximate product likeli-hoodL˜ðrÞforr-values ranging from 0 to 120 and record the MLE as the estimate ofrfor each sample.
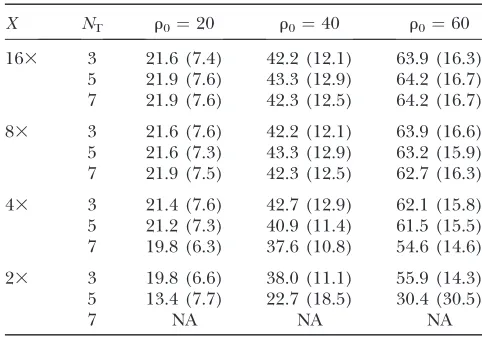
In our simulation study we generate 1000 coalescent samples of 25 diploid individuals with fixed u but differingr,e.g., (100, 20), (100, 40), and (100, 60), for a 100-kb region, and report results for estimatingr in Table 4. First, we note that the mean number of reads, nr, covering a locus increases as the coverageXincreases.
That is, for a thresholdNT, the larger the coverage is, the
larger nrbecomes on average, and the more two-locus
pairs are included in the approximate product-likeli-hood calculation, which improves the estimates. On the other hand, for largeNTand relatively smallX, we do not
obtain estimates ofrbecause there are too few two-locus pairs meeting the read criteria.
An important observation from Table 4 is that we tend to significantly underestimaterwhen there is low cover-age and a stringent threshold forNT,e.g., twofold coverage
with NT ¼ 5. We speculate that this is caused by the
increasing tendency to misinterpret an observed homo-zygote as an actual homohomo-zygote as coverage decreases. Clearly, if resequencing data are to be used to estimate recombination rates, adequate coverage must be used.
TABLE 4
Estimatingrfor resequencing data whereu¼100 andNT¼ number of reads required to use homozygous genotype calls
in the inference
X NT r0¼20 r0¼40 r0¼60
163 3 21.6 (7.4) 42.2 (12.1) 63.9 (16.3) 5 21.9 (7.6) 43.3 (12.9) 64.2 (16.7) 7 21.9 (7.6) 42.3 (12.5) 64.2 (16.7)
83 3 21.6 (7.6) 42.2 (12.1) 63.9 (16.6) 5 21.6 (7.3) 43.3 (12.9) 63.2 (15.9) 7 21.9 (7.5) 42.3 (12.5) 62.7 (16.3)
43 3 21.4 (7.6) 42.7 (12.9) 62.1 (15.8) 5 21.2 (7.3) 40.9 (11.4) 61.5 (15.5) 7 19.8 (6.3) 37.6 (10.8) 54.6 (14.6)
23 3 19.8 (6.6) 38.0 (11.1) 55.9 (14.3) 5 13.4 (7.7) 22.7 (18.5) 30.4 (30.5)
7 NA NA NA
Robustness:So far we have assumed that there are no sequencing errors in read data; in reality, of course, sequencing errors do exist. We focus on two types of errors in this article:traditional sequencing errorandbiased amplification.
We first allow for traditional base-calling sequencing errors. In Solexa data, for example, the error rate is
1% per base per read. Motivated by the fact that a given base will be sequenced more than once if it is contained within more than one read, we provide a simple heuristic procedure to deal with sequencing errors. For the read data at any given locus, for any given individual, we proceed as follows:
1. Treat the data as missing if the number of reads is less thanNT.
2. Find the most frequent and second most frequent alleles, denoted byAandB; denote their counts bynA andnB, respectively.
3. Set the genotype asAAifnB¼0 orBBifnA¼0;i.e., we observe only one type at this locus.
4. Set the genotype asABifnA$2 andnB$2;i.e., we require at least two observations of both alleles to call it as a heterozygote (so, ifnA¼1 ornB¼1, we treat the data as missing for that individual).
The rationale for the last condition is that sequencing errors at a homozygous locus will most often result in a single instance of the erroneous call (assuming, as is realistic, that error rates are relatively low). Therefore, we exclude such occurrences from the analysis since this pattern cannot be distinguished from a situation in which one of two different alleles has been read once only. Clearly, other schemes are possible.
In following this procedure the probability of making an error in calling the genotype is a decreasing function ofNT, but, conversely, the number of called genotypes
will decrease as NT increases. For example, when the
error rate is 1% per base per read, and when using 13
coverage withNT¼3 (i.e., we require at least three reads
present to call a locus), we make calls for 32% of homozygotes (with 100% accuracy), while calling13% of heterozygotes (with 54% accuracy). As we increase the coverage and the thresholdNT, we make better calls.
For example, with 43 coverage andNT ¼5, we make
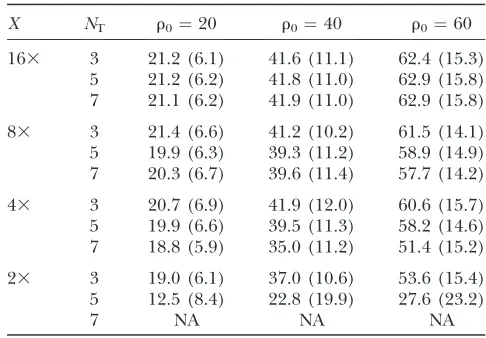
calls for 81.2% heterozygotes, with 98.2% accuracy. The results in Table 5 show that we still successfully estimate
u, but there is some impact on performance when estimatingr(Table 6) at low coverage levels.
We also note that the method for dealing with sequencing errors inherent in the method of Hellmann
et al. (2008) is not applicable in this scenario. In that article it was assumed that each sequencing error leads to a unique new segregating site or SNP. Their method works in the context of the data of Venteret al.(2001)
because of the extremely small error rate of0.003% per base per read, but fails to produce accurate estimates in the present context (results not shown).
Note that, for convenience, we assume that sequenc-ing errors are distributed uniformly along a read. In fact, error rates typically increase toward the growing end of each read and may be influenced by composition of neighboring bases (e.g., in homopolymer tracts), but we expect this to have little impact on the results presented here.
We now consider a second type of error: biased amplification. Here there are different success rates in sequencing, depending on the actual type being se-quenced. Clearly a range of scenarios is possible, but here we illustrate how to adapt our approach in a situation in which we are able sequence the major allele with 100% success but fail to sequence a percentage of minor alleles at each locus. We now recalculate the probability that a segregating site is detected in this context. We letpedenote the probability that a minor
allele is not sequenced and then recalculateq2(b) andq3
as follows:
(2˜): The probabilityq2e(b) that a segregating site withb
mutants in a sample of sizenis detected by reads is TABLE 5
Estimatinguin the presence of sequencing errors where ris fixed at 20 andNT¼3
X u0¼100 u0¼400
163 99.8 (11.4) 404.2 (59.6)
83 99.6 (11.4) 403.6 (60.5)
43 104.8 (12.9) 406.5 (61.0)
23 103.2 (12.0) 415.6 (64.7)
We report the mean (and RMSE) of the estimates over 1000 simulations.
TABLE 6
Estimatingrin the presence of sequencing errors
X NT r0¼20 r0¼40 r0¼60
163 3 21.2 (6.1) 41.6 (11.1) 62.4 (15.3) 5 21.2 (6.2) 41.8 (11.0) 62.9 (15.8) 7 21.1 (6.2) 41.9 (11.0) 62.9 (15.8)
83 3 21.4 (6.6) 41.2 (10.2) 61.5 (14.1) 5 19.9 (6.3) 39.3 (11.2) 58.9 (14.9) 7 20.3 (6.7) 39.6 (11.4) 57.7 (14.2)
43 3 20.7 (6.9) 41.9 (12.0) 60.6 (15.7) 5 19.9 (6.6) 39.5 (11.3) 58.2 (14.6) 7 18.8 (5.9) 35.0 (11.2) 51.4 (15.2)
23 3 19.0 (6.1) 37.0 (10.6) 53.6 (15.4) 5 12.5 (8.4) 22.8 (19.9) 27.6 (23.2)
7 NA NA NA
Here,u¼100 andNT¼number of reads required to use
q2eðbÞ ¼ ð1 ð1q1ÞnbÞð1 ð1 ð1peÞq1ÞbÞ; ð12Þ
for 1,b,n, whereq1is defined as before.
(3˜): Under a constant population size coalescent model, the probabilityq3ethat a segregating site is detected
by reads is
q3e ¼
Xn1
b¼1
qnbq2eðbÞ: ð13Þ
The estimate ofuis given byST=ðq3e Pn1
i¼1 1=iÞ, where ST is the number of detected segregating sites. We
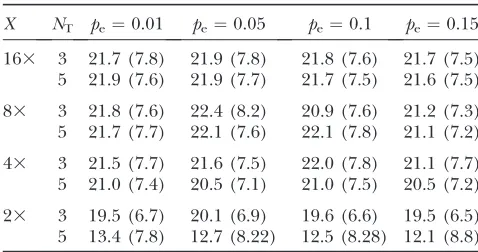
simulate 1000 data sets using the coalescent model to assess performance of this estimator. Results for esti-mating u are listed in Table 7, where we see that we remain able to infer u from the adjusted formulas. There is no straightforward way to adapt the procedure for estimatingrin the presence of biased amplification. However, in Table 8 we show results obtained by applying the method we used for ‘‘traditional’’ sequenc-ing errors earlier in this article to this new context. We see the same trends as in Table 4;i.e., if coverage is low we tend to underestimater, but as coverage increases, the estimator begins to perform well. Note that, with
onefold coverage, performance is relatively poor when estimating u or r since relatively few data meet the thresholdNT(results not shown).
Inference with no reference genome: Thus far we
have assumed that there is a reference genome to which all reads can be uniquely mapped. However, reference genomes are not always available, e.g., in bacterial genome resequencing projects. The common fragment assembly programs such as Phrap (Ewingand Green
1998) work well on 500- to 700-bp reads produced by Sanger sequencing, but their overlap-layout-consensus approach becomes more difficult when applied to shorter reads produced by next-generation sequencing techniques. Chaisson et al.(2004) demonstrated that
while it is feasible to assemble short reads (of length 80–200 bp), it requires significantly higher coverage ($303).
Addressing the lack of a reference genome in diploid data is a difficult problem, and it is not clear how one should proceed. As a first step in that direction, we demonstrate a simple but effective algorithm that is usable in the context where individuals arehaploid:
1. AssumeRreads (lengthlbp) are obtained for each of the haploid individuals.
2. Assume that we can merge adjacent reads into a larger fragment if they share at leastkbases. Do this for each individual and call the resulting collections of reads ‘‘islands.’’
3. Examine the set of islands across all individuals and create ‘‘superislands’’ by joining islands that overlap by at leastkbases.
This algorithm results in a set of superislands. The relative ordering of the superislands is unknown. We now present results for inferring the mutation and recombi-nation parameters on the basis of the superislands. We show results for a context in which there are no sequencing errors in the reads. (Sequencing errors can be dealt with using the heuristic procedures employed earlier.) We explore a range of different values fork.
In Table 9 we list the estimates ofuandr, respectively, from simulated data. For each combination of generat-ing values (u,r), we simulate 1000 coalescent samples of TABLE 7
Estimatinguin the presence of biased amplification
X pe¼0.0 pe¼0.01 pe¼0.05 pe¼0.1 pe¼0.15
163 100.1 (14.4) 100.0 (14.7) 101.8 (15.2) 102.4 (15.1) 102.6 (15.6) 83 100.1 (14.4) 100.1 (15.4) 101.9 (15.5) 102.3 (15.4) 103.0 (15.9) 43 100.2 (14.9) 101.5 (15.6) 102.8 (16.5) 100.6 (15.8) 103.7 (15.9) 23 99.6 (15.7) 103.7 (16.3) 105.1 (16.7) 105.6 (16.5) 107.3 (18.7)
Here we setu0(the generating value ofu)¼100 and user0¼20.peis the probability that a minor allele is not
sequenced. We report the mean (and RMSE) of the estimates over 1000 simulations.
TABLE 8
Estimatingrin the presence of biased amplification
X NT pe¼0.01 pe¼0.05 pe¼0.1 pe¼0.15
163 3 21.7 (7.8) 21.9 (7.8) 21.8 (7.6) 21.7 (7.5) 5 21.9 (7.6) 21.9 (7.7) 21.7 (7.5) 21.6 (7.5)
83 3 21.8 (7.6) 22.4 (8.2) 20.9 (7.6) 21.2 (7.3) 5 21.7 (7.7) 22.1 (7.6) 22.1 (7.8) 21.1 (7.2)
43 3 21.5 (7.7) 21.6 (7.5) 22.0 (7.8) 21.1 (7.7) 5 21.0 (7.4) 20.5 (7.1) 21.0 (7.5) 20.5 (7.2)
23 3 19.5 (6.7) 20.1 (6.9) 19.6 (6.6) 19.5 (6.5) 5 13.4 (7.8) 12.7 (8.22) 12.5 (8.28) 12.1 (8.8)
Here we set the generating values,u0¼100 andr0¼20.NT
is the number of reads required to use homozygous genotype calls in the inference andpeis the probability that a minor
50 haploid individuals over a 100-kb region and gener-ate reads according to a Poisson process, as before, with intensity specified by the coverageXfor each chromo-some. We then construct superislands. For both analyses we consider only the SNPs detected by reads in the superislands. When estimatingr, we include only the covered pairs for which both loci fall within the same superisland (since only for such pairs is the distance between them known). We then use composite likeli-hood as before and report the maximum-likelilikeli-hood estimate (MLE). We present mean and RMSE of the estimates from the 1000 samples. Results foruare gen-erated from data simulated withu0¼100 andr0¼20. Results forruse data simulated withu0¼20 andr0¼20, 40 and 60 (per column headings).
As we can see from Table 9, in general we obtain good results for estimating bothuandr. When estimatingr
we lose some efficiency when coverage is low and large overlap is required for alignment (last row of Table 9). This is because, in such a case, the number of superis-lands becomes very large, with each being of relatively short length. For example, for data corresponding to the last row of Table 9, there are an average of250 superislands with a mean length440 bp in the 100-kb region for each data set (see Figure 3). Consequently there are far fewer SNPs within each superisland, the number of covered pairs becomes much lower, and those pairs will be relatively close together. This in-creases the variance of our estimates of r, and the asymmetry of those errors at low r-values leads to an apparent upward bias in the final MLE.
Note that the total length of the combined superis-lands, G˜, will often be longer than the length of the region from which they were generated, G. This is because if two superislands (A and B, say) overlap by fewer base pairs than are required to align them, they are not combined to form a single superisland. Thus the region of overlap between the two is considered twice in the analysis: once for superisland A and once for superisland B. For example, withX ¼0.5,l¼50, and k¼40, the total length of superislands is, on average
˜
G¼110 kb. Because of this, the estimate we obtain foru
is what would be appropriate for a region of lengthG˜. Consequently, we report a ‘‘corrected’’u-estimate that multiplies the original estimate by a factor ofG=G˜.
DISCUSSION
Our model and analysis show how read data from the Solexa (and similar) systems can be used to estimate mutation and recombination parameters. Inference accuracy increases as coverage increases, but 23 cover-age provides good estimates for inferring mutation rate, while 43coverage is sufficient for recombination rate. One of the primary advantages of sequencing by synthesis is that it is (in principle) fast and economic, and it is therefore relatively easy to increase coverage to whatever level is necessary to attain the desired accuracy.
In this article we have presented results for the Solexa system (with an assumed read length of 36 bp). However, our methods generalize naturally to longer read lengths and to the 454 and polony methods, since TABLE 9
Estimatinguandrin the absence of a reference genome
X l k u0¼100 r0¼20 r0¼40 r0¼60
13 30 20 100.5 (16.7) 21.3 (7.5) 42.2 (11.4) 63.2 (15.7) 13 50 40 100.3 (16.3) 21.5 (7.7) 42.2 (13.0) 61.8 (15.1) 0.53 30 20 99.3 (18.0) 22.2 (11.1) 44.2 (16.1) 62.8 (19.2) 0.53 50 40 101.2 (18.2) 32.8 (34.9) 47.7 (34.3) 61.5 (30.9)
We report the mean (and RMSE) of the estimates over 1000 simulations.
Figure 3.—Histograms of the number of SNPs detected within superislands for (a)X¼0.53andl¼50 and (b)X¼
our theoretical results depend only on the expected coverageX. With respect to 454 technology, we simply have to change the read length to be 200 bp, say, rather than the 36 bp used here.
For polony data, the situation is slightly less clear since reads now occur in pairs (one read at each end of each fragment). It has been experimentally determined that the distance between each pair of reads is reasonably modeled by a Gaussian distribution with a mean of950 bp and standard deviation of97 bp (Shendureet al.
2005b). The theoretical results we have presented here still apply in this case.
It is also of interest to explore our ability to estimate decay of linkage disequilibrium (LD) using resequenc-ing data. Recall that, for each pair of SNPs, the number of haplotypes that are covered (i.e., have data) at both SNPs will be less than or equal to the total number of haplotypes. In particular, the number of covered SNP pairs will vary from pair to pair. This leads to an interesting phenomenon, which we illustrate in the context of haploid data. In Figure 4a, we plot the decay of LD, measured in terms of r2, for differing levels of
coverage. Ther2 estimates are based on averages over
1000 simulations. We see that the estimatedr2decreases
as distance increases, as it should, but also increases as coverage decreases. This is a simple consequence of the known tendency of r2 to be overestimated for small
sample sizes (Terwilliger and Hiekkalinna 2006).
For reference, Figure 4a also shows the decay ofr2when
calculated from the full SNP data using samples of 30 and 50 chromosomes. One way of avoiding the observed bias is to condition on having a reasonably large number of covered chromosomes for each pair of loci. As an example of this, in Figure 4b we show results in which we include only pairs of loci for which have at least 30 covered chromosomes. We see that the bias now largely disappears. The results for X ¼ 0.253 are not shown because there are no two-locus pairs that meet the conditioning criteria in this case.
Throughout this article we have assumed that reads are randomly distributed and that read locations are independent across chromosomes. Since fragments are created by physical shearing processes, this assumption appears to be a reasonable approximation. However, there is evidence suggesting that in short-read rese-quencing data the distribution of the number of reads covering a base pair depends on the location of that base pair. The effects of this lack of homogeneity, thought to be due to underlying variation in GC content across the genome, can be modeled in a straightforward way using nonhomogeneous Poisson processes, in which the rate of the Poisson process at a given location will reflect the local GC content, for example. We also note that since isochores, regions of relatively constant GC content, are
300 kb long (Constantiniet al.2006), then if we are
considering regions of the order of 100 kb (say), as in the examples in this article, an assumption of
homoge-neity is more reasonable. It is also likely that the locations of reads are correlated across fragments in the sequencing library. We have shown in other work ( Jianget al.2006) that procedures such as those used
here continue to work in the context of single-feature polymorphism (SFP) data, in which the positions of SFPs are also highly correlated across fragmentations of a given chromosome (theoretical results will change, of course). One might also consider Poisson processes of different rates for different regions or allow the prob-ability that a read is sequenced to depend on the local GC content.
Our method for estimating recombination rate is admittedly somewhatad hoc. This approach represents an attempt to finesse the principal difficulty in using Figure4.—LD decay ofr2based on SNPs observed in a sam-ple of 50 chromosomes, presented as a function of coverage in a 100-kb region. (a) Plot of ther2estimates obtained from
resequencing data to estimate recombination rates: the fact that while, under reasonable assumptions, reads can be mapped to a genomic location within an in-dividual, it is, at least under current incarnations of the technologies, not known which copy of the chromo-some has been read. Our method relies upon use of a thresholdNT, and we show performance under a range
of values for NT. It is worth noting that in other
scenarios, such as varying recombination rates, say, performance as a function of NT may vary. However,
we note that, while we demonstrated results for estimat-ing recombination rate usestimat-ing the composite-likelihood estimator of Hudson in this article, other methods, for example LDHat (McVeanet al. 2004), might also be
usefully adapted to the present context by using a similar threshold scheme and might improve robust-ness to variation in recombination rates.
In summary, resequencing data provide an exciting, economically efficient way of generating large quanti-ties of sequence data. Such data will typically result in a level of coverage that varies from locus to locus. In this article we have shown that this complication can be dealt with in a reasonably simple way, allowing for successful estimation of evolutionary parameters from such data.
We gratefully acknowledge the criticism of the reviewers, which resulted in a considerably improved article. We are also grateful to Ines Hellmann and Rasmus Nielsen for help in providing a preformatted version of the data of Venteret al. (2001) and with running the
analysis program used to generate the results in Hellmann et al.
(2008). This work was funded in part by National Institutes of Health grants HG002790, GM67243, HL084706, GM069890, and MH084678. S.T. is a Royal Society–Wolfson Research Merit Award holder.
LITERATURE CITED
Bentley, D. R., 2006 Whole-genome re-sequencing. Curr. Opin.
Genet. Dev.16:545–552.
Brockman, W., P. Alvarez, S. Young, M. Garber, G. Giannoukos
et al., 2008 Quality scores and SNP detection in sequencing-by-synthesis systems. Genome Res.18:763–770.
Chaisson, M., P. Pevznerand H. Tang, 2004 Fragment assembly
with short reads. Bioinformatics20:2067–2074.
Constantini, M., O. Clay, F. Aulettaand G. Bernadi, 2006 An
isochore map of human chromosomes. Genome Res.16:536– 541.
Ewing, B., and P. Green, 1998 Base-calling of automated sequencer
traces using Phred. II. Error probabilities. Genome Res.8:186–194. Griffiths, R. C., and S. Tavare´, 1998 The age of a mutation in a
general coalescent tree. Stoch. Models14:273–295.
Halushka, M. K., J. B. Fan, K. Bentley, L. Hsie, N. Shenet al.,
1999 Patterns of single-nucleotide polymorphisms in candi-date genes for blood-pressure homeostasis. Nat. Genet. 22:
239–247.
Hellmann, I., Y. Mang, Z. Gu, P. Li, F. M. De LaVega et al.,
2008 Population genetic analysis of shotgun assemblies of ge-nomic sequence from multiple individuals. Genome Res. 18:
1020–1029.
Hillier, L., G. T. Marth, A. R. Quinlan, D. Dooling, G. Fewell
et al., 2008 Whole-genome sequencing and variant discovery inC. elegans.Nat. Methods5:183–188.
Hudson, R. R., 2001 Two-locus sampling distributions and their
ap-plication. Genetics159:1805–1817.
H , R. R., and N. L. K , 1985 Statistical properties of the number of recombination events in the history of a sample of DNA sequences. Genetics111:147–164.
Jarvie, T., 2005 Next generation sequencing technologies. Drug
dis-covery today. Technologies2:255–260.
Jiang, R., P. Marjoram, J. O. Borevitzand S. Tavare´, 2006 Inferring
population parameters from single feature polymorphism data. Genetics173:2257–2267.
Johnson, P. L. F., and M. Slatkin, 2006 Inference of population
ge-netic parameters in metagenomics: a clean look at messy data. Genome Res.16:1320–1327.
Korbel, J. O., A. E. Urban, J. P. Affourtit, B. Godwin, F. Grubert
et al., 2007 Paired-end mapping reveals extensive structural var-iation in the human genome. Science318:420–426.
Margulies, M., M. Egholm, W. E. Altman, S. Attiya, J. S. Bader
et al.2005 Genome sequencing in microfabricated high-density picolitre reactors. Nature437:376–380.
McVean, G. A., S. R. Myers, S. Hunt, P. Deloukas, D. R. Bentley
et al., 2004 The fine-scale structure of recomination rate varia-tion in the human genome. Science304:581–584.
Shendure, J., R. D. Mitra, C. Varma and G. M. Church,
2005a Advanced sequencing technologies: methods and goals. Nat. Rev. Genet.5:335–344.
Shendure, J., G. J. Porreca, N. B. Reppas, X. Lin, J. P. McCutcheon
et al., 2005b Accurate multiplex polony sequencing of an evolved bacterial genome. Science309:1728–1732.
Terwilliger, J. D., and T. Hiekkalinna, 2006 An utter refutation
of the ‘Fundamental Theorem of the HapMap’. Eur. J. Hum. Genet.14:426–437.
Venter, J. C., M. D. Adams, E. W. Myers, P. W. Li, R. J. Muralet al.,
2001 The sequence of the human genome. Science291:1304– 1351.
Watterson, G. A., 1975 On the number of segregating sites in
ge-netical models without recombination. Theor. Popul. Biol. 7:
256–276.
Communicating editor: G. Gibson
APPENDIX: DERIVATIONS
We now derive the results of Equations 1–4. First consider the probability that a random point in the genome is covered by reads or the expected fraction of the genome is covered by reads. We assume the reads occur on the real line (‘,‘) according to a Poisson process with ratel. The region of interest corresponds to the interval (0,G) in base pairs. The probability that a point x is not covered by reads of length l is the probability that no events occur in the interval (xl, x), which isell. The expected number of reads in (0,G)
isGl, covering an average ofGllbp. The coverage per base is thereforeX¼Gll/G¼ll. To achieve a coverage ofXwe choosel¼X/l. The probability that a base is not covered is therefore
q1¼1ell ¼1eX:
interest. The probability that this segregating site is detected is the product of the probability of reading at least one of thebmutant and at least one of the (nb) ancestral alleles. This gives formula (2). To find the probability that a segregating site is detected by reads without conditioning onb, we average over the proba-bility qnb of having b mutants in a sample of n chromosomes given in Griffithsand Tavare´ (1998)
for coalescent samples with constant population size. To derive the expected number of segregating sites detected by reads, we use indicator functionsIsuch that Ii ¼ 1 if the ith segregating site is detected by reads; otherwiseIi¼0. Note thatST¼
PS
i¼1Ii, whereSis the total number of segregating sites in the sample. Condi-tioning onS¼s, we have
E½STjS¼s ¼E½ Xs
i¼1
IijS ¼s ¼ Xs
i¼1
E½Ii;
since Ii is independent of S. The distribution of the Bernoulli random variable,Ii, is determined byP(Ii¼1j b)¼q2(b), wherebis the number of mutants at theith
segregating site. Hence
E½Ii ¼E½E½Iijb ¼E½q2ðbÞ ¼q3:
Thus we have
E½STjS ¼s ¼ Xs
i¼1
q3¼q3s;