Injection Modeling and Experimental
validation of DI Diesel Engine Fueled with
Diesel and Biodiesel Blends
Shashank Kumar 1, Rahul Bhatnagar2, Vaibhav Trivedi3, Kapil Gill4, Manish Kr Singh5
Assistant Professor, Department of Mechanical Engineering, IFTM University Moradabad, India1
Assistant Professor, Department of Mechanical Engineering, IFTM University Moradabad, India2
Assistant Professor, Department of Mechanical Engineering, IFTM University Moradabad, India3
Assistant Professor, Department of Mechanical Engineering, IFTM University Moradabad, India4
Assistant Professor, Department of Mechanical Engineering, Bhagwant University Ajmer, India5
ABSTRACT: This study was carried out on DI diesel engine. First we done the theoretical work in which we calculated the readings of all blends by the theoretical formulas and then we done the experimental work on the DI diesel engine and find the Indicated Power (KW), Break Power (KW), Friction Power (KW), Indicated Mean Effective Pressure (Bar), Brake Mean Effective Pressure (bar), Indicated Thermal Efficiency (%), Brake Thermal Efficiency (%), Fuel Consumption (Kg/h), Mechanical Efficiency (%). We compared the properties obtained from theoretical and experimental work taken Blend 0%, Blend 20%, Blend 50%, Blend 100% at Injection Pressure 200 bar, 205 bar and 210 bar and found the best blend among them.
I. INTRODUCTION
Engine: Internal combustion engines are seen every day in automobiles, trucks, and buses. The name internal combustion refers also to gas turbines except that the name is usually applied to reciprocating internal combustion (I.C.) engines like the ones found in everyday automobiles. There are basically two internal combustion engines are seen every day in automobiles, trucks, and buses. The name internal combustion refers also to gas turbines except that the name is usually applied to reciprocating internal combustion (I.C.) engines like the ones found in everyday automobiles. There are basically two types of I.C. ignition engines, those which need a spark plug, and those that work on compression of a fluid. Spark ignition engines take a mixture of fuel and air, compress it, and ignite it using a spark plug.
Biodiesel: Biodiesel is a fuel equivalent of petrol or diesel with the exception of its derivation from biological sources. Both non-toxic and renewable, biodiesel essentially comes from plants and animals. The major source of biodiesel is soybean oil, but other oils include rapeseed, canola, palm, cottonseed, sunflower, and peanut. All of which can be replenished through farming and recycling. Biodiesel can even be made from recycled cooking grease! Although biodiesel can be used in its pure form, it is usually blended with standard diesel fuel. Blends are indicated by the abbreviation Bxx, where xx is the percentage of biodiesel in the mixture. Much attention has been focused on the thought of it one day replacing fossil fuels as the world’s primary transport energy source. Biodiesel is safe and can be used in diesel engines with few or no modifications needed.
II. RELATEDWORK
pulses and axial location of injector nozzle. B.P Singh et.al the research developed a theoretical method based on various existing process models has been developed for the performance evaluation of a compression ignition engine by using diesel and Jatropha straight vegetable oil as an input fuel. A good synchronization has been observed between the model’s prediction and the available theoretical and experimental results. Dhandapani Kannan et.al In this work addition of ethanol to high viscosity jatropha methyl ester (JME) through port injection is investigated in order to determine its effect fuel viscosity reduction on diesel engine performance. It is found that blending of oxygenated fuels with diesel modifies the chemical structure and physical properties which again alter the engine operating conditions, combustion parameters and emissions levels. However, the injection of only 5% ethanol through port injection allows for a total of 25% blending of biofuels into diesel yet keeping the fuel characteristics close to that of conventional diesel. However, both experimental and numerical results show that ethanol addition in JME blended diesel results in a slight increase in fuel consumption and thermal efficiency for the same power outputs as that of conventional diesel fuel. M. Pandian et.al 2011 This study is aimed at investigating the effect of injection system parameters such as injection pressure, injection timing and nozzle tip protrusion on the performance and emission characteristics of a twin cylinder water cooled naturally aspirated CIDI engine. The experiments were designed using a statistical tool known as Design of Experiments (DoE) based on response surface methodology (RSM). The resultant models of the response surface methodology were helpful to predict the response parameters such as Brake Specific Energy Consumption (BSEC), Brake Thermal Efficiency (BTE), Carbon monoxide (CO), Hydrocarbon (HC), smoke opacity and Nitrogen Oxides (NOx) and further to identify the significant interactions between the input factors on the responses.
III.MATERIALSANDMETHODS
The setup consists of single cylinder, four stroke, VCR (Variable Compression ratio) Diesel engine connected to eddy current type dynamometer for loading. The compression ratio can be changed without stopping the engine and without altering the combustion chamber geometry by specially designed tilting cylinder block arrangement. Setup is provided with necessary instruments for combustion pressure and crank-angle measurements. These signals are interfaced to computer through engine indicator for Pθ−PV diagrams. Provision is also made for interfacing airflow, fuel flow, temperatures, and load measurement.
The setup enables study of VCR engine performance for brake power, indicated power, frictional power, BMEP, IMEP, brake thermal efficiency, indicated thermal efficiency, Mechanical efficiency, volumetric efficiency, specific fuel consumption, A/F ratio and heat balance. Lab view based Engine Performance Analysis software package EnginesoftLV” is provided for on line performance evaluation.
Engine Specification
Make of engine Kirloskar , TV1
General Details Four stroke, compression ignition, constant speed, vertical, water cooled, computerized diesel engine
No. of cylinder One
Bore 87.5 mm
Stroke 110 mm
Swept Volume 661 cc Compression Ratio 17.5:1
Rated Output 5.2 kw at 1500 rpm Injection Nozzle 3 hole
Fuel Injection Pressure
205 bar
Air box MS fabricated with orifice meter and U tube manometer
Fuel Tank Capacity 15 lit with glass fuel metering column
Calorimeter Type pipe in pipe out
Piezo sensor Range 5000 PSI, with low noise cable
Crank angle sensor Resolution 1 Deg , Speed 5500 rpm with TDC pulse
Table 1- Engine Specification
In this work the effect of injection timing, Compression ratio and different blends of Jetropha biodiesel-Diesel on the performance of diesel engine have been studied.
METHODOLOGY ADOPTED
The present mathematical model is used to determine various efficiencies of the engine like brake thermal efficiency, indicated thermal efficiency, mechanical efficiency. Along with the same the parameters used for finding out the performance of the engine are also found out like BSFC, BP & IP. Average value of frictional; power for the engine is used for the given set of operating conditions.
THEORETICAL SOLUTION PROCEDURE
The Numerical model is developed to be suitable for any hydrocarbon fuel viz. diesel, biodiesel and its blends. The engine geometrical parameters, molecular weight of gaseous products, and the various constants used in the modeling are defined. The input parameters used in the modeling are the compression ratio 16. Injection pressure 200
bar, 205 bar, 210 bar and the molecular formula of the fuel. The outputs of the modeling program are instantaneous pressure, temperature, volume and the performance parameters that includes brake mean effective pressure, indicated mean effective pressure, friction mean effective pressure, Indicated Power, Brake Power, Friction Power, brake thermal efficiency, Mechanical Efficiency, Engine Torque, Brake specific fuel consumption, Fuel Consumption and Indicated Thermal Efficiency.
ENGINE TRIALS
Tests were carried out on the engine with various blends of Jetropha Biodiesel. Engine specifications are mentioned in Table 1. Various percentages of ethanol in petrol were used from 0 to 100% by volume and named accordingly e.g. B0D100, B20D80, B50D50, B100D0. Engine performance parameters like brake power, brake thermal efficiency, mechanical efficiency and specific fuel consumption were measured during the trials. During the experimentation parameters Fuel Injection Pressure (200,205 and 210 bar) and Engine Load (3,6,9 and 12 Kg) were variable parameters. The purpose of experiment is to compare the results of the engine trial outputs with the results shown by the output of the mathematical model.
IV.EXPERIMENTAL RESULTS
1.
Indicated Power (KW)Load CR IP 200 bar
B0 Th0 B20 Th20 B50 Th50 B100 Th100
Table No. 2
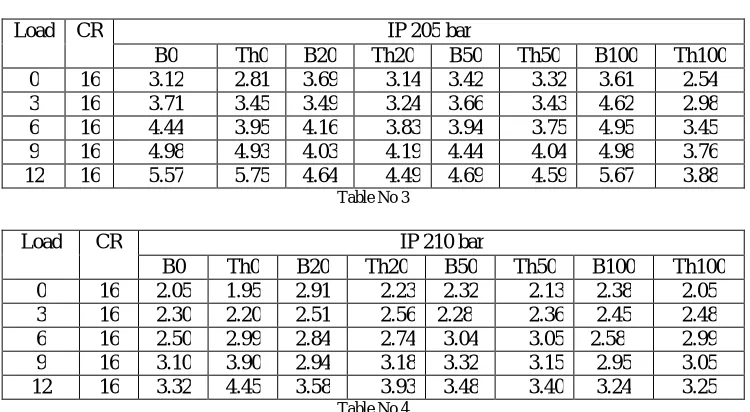
Load CR IP 205 bar
B0 Th0 B20 Th20 B50 Th50 B100 Th100 0 16 3.12 2.81 3.69 3.14 3.42 3.32 3.61 2.54 3 16 3.71 3.45 3.49 3.24 3.66 3.43 4.62 2.98 6 16 4.44 3.95 4.16 3.83 3.94 3.75 4.95 3.45 9 16 4.98 4.93 4.03 4.19 4.44 4.04 4.98 3.76 12 16 5.57 5.75 4.64 4.49 4.69 4.59 5.67 3.88
Table No 3
Load CR IP 210 bar
B0 Th0 B20 Th20 B50 Th50 B100 Th100 0 16 2.05 1.95 2.91 2.23 2.32 2.13 2.38 2.05 3 16 2.30 2.20 2.51 2.56 2.28 2.36 2.45 2.48 6 16 2.50 2.99 2.84 2.74 3.04 3.05 2.58 2.99 9 16 3.10 3.90 2.94 3.18 3.32 3.15 2.95 3.05 12 16 3.32 4.45 3.58 3.93 3.48 3.40 3.24 3.25
Table No 4
The indicated power of diesel engine at injection pressure 200 bar, 205 bar and 210 bar is shown in table no. 2, 3, 4 and it is clear that the indicated power is first increase from 200 bar to 205 bar and after that it decrease from 205 bar to 210 bar.
2.
Brake Power (KW)Load CR IP 200 bar
B0 Th0 B20 Th20 B50 Th50 B100 Th100 0 16 0.10 0.09 0.10 0.11 0.10 0.05 0.07 0.16 3 16 0.89 0.84 0.87 0.69 0.89 0.50 0.87 0.63 6 16 1.72 1.61 1.71 0.94 1.74 1.05 1.21 0.99 9 16 2.55 2.70 2.59 1.89 2.56 1.39 1.94 1.28 12 16 3.36 3.75 3.35 2.78 3.35 2.24 3.16 2.04
Table No 5
Load CR IP 205 bar
B0 Th0 B20 Th20 B50 Th50 B100 Th100
0 16 0.13 0.12 0.12 0.14 0.11 0.14 0.12 0.17 3 16 0.93 0.99 0.89 1.40 0.94 0.82 0.96 0.87 6 16 1.77 1.78 1.74 2.21 1.76 1.50 1.72 1.56 9 16 2.57 2.85 2.63 2.51 2.59 1.65 2.56 1.77 12 16 3.38 3.79 3.38 3.22 3.38 2.45 3.37 2.28
Table No 6
Load CR IP 210 bar
B0 Th0 B20 Th20 B50 Th50 B100 Th100 0 16 0.08 0.07 0.08 0.09 0.09 0.03 0.06 0.13 3 16 0.85 0.80 0.84 0.59 0.87 0.43 0.80 0.52 6 16 1.68 1.51 1.67 0.85 1.71 0.99 1.03 0.88 9 16 2.52 2.62 2.53 1.65 2.52 1.24 1.55 1.08 12 16 3.34 3.67 3.30 2.50 3.30 2.05 2.99 1.88
The brake power of diesel engine at injection pressure 200 bar, 205 bar and 210 bar is shown in table no. 5, 6, 7 and it is clear that the brake power is first increase from 200 bar to 205 bar and after that it decrease from 205 bar to 210 bar.
3.
Friction Power (KW)Load CR IP 200 bar
B0 Th0 B20 Th20 B50 Th50 B100 Th100
0 16 2.55 2.64 3.81 3.10 2.85 2.89 2.32 3.02
3 16 2.18 2.38 3.11 2.84 2.32 2.63 2.28 3.10
6 16 2.12 2.16 3.02 2.61 1.97 2.41 1.71 2.88
9 16 1.92 1.97 2.36 1.82 1.74 2.22 1.60 2.52
12 16 1.68 1.81 1.55 1.27 1.14 2.06 1.18 2.07
Table No 8
Load CR IP 205 bar
B0 Th0 B20 Th20 B50 Th50 B100 Th100
0 16 2.02 1.94 2.98 2.74 2.41 2.29 2.25 2.07
3 16 1.69 1.69 1.94 2.48 1.83 2.04 1.69 1.81
6 16 1.22 1.46 1.36 2.06 1.49 1.81 1.45 1.59
9 16 0.94 1.27 0.77 1.07 0.88 0.62 0.95 1.40
12 16 0.36 1.11 0.53 1.21 0.44 0.58 0.52 1.24
Table No 9
Load CR IP 210 bar
B0 Th0 B20 Th20 B50 Th50 B100 Th100
0 16 3.01 2.94 3.59 2.10 3.33 3.18 3.53 3.56
3 16 2.82 2.68 2.60 1.84 2.77 2.92 3.02 3.30
6 16 2.68 2.46 2.42 1.61 2.18 2.70 2.83 3.08
9 16 2.43 2.27 1.40 1.42 1.87 2.51 2.42 2.89
12 16 2.19 2.11 1.27 1.72 1.31 2.35 2.30 2.73 Table No 10
The Friction Power of diesel engine at injection pressure 200 bar, 205 bar and 210 bar is shown in table no. 8, 9, 10 and it is clear that the friction power is first decrease from 200 bar to 205 bar and after that it increase from 205 bar to 210 bar.
4.
Indicated Mean Effective Pressure (bar)Load CR IP 200 bar
B0 Th0 B20 Th20 B50 Th50 B100 Th100 0 16 3.78 3.24 4.44 3.80 4.07 4.02 4.43 4.51 3 16 4.53 4.46 4.85 3.92 4.44 4.15 5.63 4.76 6 16 5.41 4.71 5.08 4.63 4.79 4.54 6.02 4.93 9 16 6.09 5.89 5.62 5.06 5.43 4.89 6.09 5.21 12 16 6.89 6.42 5.71 5.43 5.80 5.56 7.01 5.78
Load CR IP 205 bar
B0 Th0 B20 Th20 B50 Th50 B100 Th100
0 16 2.52
2.49 3.60 3.33 2.97 2.84 2.85 2.71 3 16 3.20 3.24 3.41 3.60 3.40 3.47 3.26 3.27
6 16 3.62
3.84 3.86 3.75 3.98 4.01 3.85 3.82 9 16 4.30
4.98 4.14 4.41 4.26 4.17 4.21 4.06 12 16 4.63
5.94 4.87 5.11 4.71 4.74 4.68 4.26 Table No 12
Load CR IP 210 bar
B0 Th0 B20 Th20 B50 Th50 B100 Th100 0 16 2.16 2.01 3.20 3.01 2.46 2.45 2.67 2.41 3 16 2.88 2.95 3.10 3.22 3.02 3.07 3.01 2.97 6 16 3.05 3.15 3.54 3.32 3.39 3.79 3.45 3.28 9 16 3.89 4.45 3.96 4.04 3.98 3.96 4.02 3.96 12 16 4.10 5.50 4.10 4.89 4.35 4.35 4.20 4.01
Table 13
The indicated mean effective pressure of diesel engine at injection pressure 200 bar, 205 bar and 210 bar is shown in table no. 11, 12, 13 and it is clear that the indicated mean effective pressure is slightly decrease from 200 bar to 210 bar.
5.
Brake Mean Effective Pressure (bar)Load CR IP 200 bar
B0 Th0 B20 Th20 B50 Th50 B100 Th100 0 16 0.15 0.14 0.13 1.26 0.14 0.16 0.26 0.20 3 16 1.14 1.20 1.08 1.69 1.18 1.00 1.31 1.07 6 16 2.12 2.07 2.20 2.67 2.18 1.81 2.23 1.89 9 16 3.15 3.44 3.21 3.03 3.18 2.87 3.68 2.15 12 16 4.28 4.59 4.22 3.89 4.18 3.77 4.25 2.75
Table 14
Load CR IP 205 bar
B0 Th0 B20 Th20 B50 Th50 B100 Th100 0 16 0.12 0.11 0.12 0.14 0.12 0.06 0.09 0.20 3 16 1.09 1.02 1.06 0.89 1.08 0.61 1.06 0.76 6 16 2.15 1.94 2.12 2.02 2.14 1.27 2.09 1.20 9 16 3.12 3.35 3.15 2.72 3.10 1.68 3.13 1.55 12 16 4.18 4.52 4.16 3.79 4.08 2.71 4.17 2.47
Table 15
Load CR IP 210 bar
B0 Th0 B20 Th20 B50 Th50 B100 Th100 0 16 0.10 0.07 0.09 0.10 0.09 0.05 0.05 0.16 3 16 1.01 0.88 0.99 0.78 1.01 0.45 0.99 0.55 6 16 2.05 1.78 2.02 1.86 2.02 1.08 2.01 1.02 9 16 3.02 3.05 3.08 2.53 3.01 1.39 3.05 1.25 12 16 4.03 4.25 4.07 3.44 3.99 2.41 4.11 2.09
The brake mean effective pressure of diesel engine at injection pressure 200 bar, 205 bar and 210 bar is shown in table no. 14, 15, 16 and it is clear that the brake mean effective pressure is slightly decrease from 200 bar to 210 bar.
6.
Indicated Thermal Efficiency (%)Load CR IP 200 bar
B0 Th0 B20 Th20 B50 Th50 B100 Th100 0 16 49.33 64.90 70.95 71.97 57.82 49.56 56.82 47.20 3 16 46.71 64.29 50.10 51.91 49.49 52.76 50.12 49.80 6 16 43.00 63.81 45.89 45.33 43.36 49.11 45.23 46.76 9 16 40.08 62.90 38.56 40.57 39.71 39.62 38.16 38.58 12 16 37.33 62.15 36.96 34.62 35.85 34.77 34.65 31.23
Table 17
Load CR IP 205 bar
B0 Th0 B20 Th20 B50 Th50 B100 Th100
0 16 71.43 65.11 75.43 72.26 68.65 70.05 96.52 78.61 3 16 66.14 64.43 59.82 64.68 58.72 63.10 74.09 72.38 6 16 59.39 63.91 52.67 56.66 52.73 55.61 66.17 60.35 9 16 57.04 62.97 46.21 48.11 47.52 46.48 53.23 49.47 12 16 52.58 62.20 43.82 39.79 44.26 40.73 50.53 42.35
Table 18
Load CR IP 210 bar
B0 Th0 B20 Th20 B50 Th50 B100 Th100
0 16 48.92 63.25 69.69 70.12 56.38 48.83 54.77 46.24 3 16 45.52 62.99 48.33 50.49 48.93 50.07 48.62 47.89 6 16 41.56 62.42 43.55 43.33 42.71 48.06 43.98 45.02 9 16 38.02 60.90 37.66 38.08 37.12 37.93 36.53 37.20 12 16 35.38 61.20 35.44 32.15 34.53 32.65 32.79 29.84
Table 19
The indicated thermal efficiency of diesel engine at injection pressure 200 bar, 205 bar and 210 bar is shown in table no. 17, 18,19 and it is clear that the indicated thermal efficiency is first increase from 200 bar to 205 bar and after that it decrease from 205 bar to 210 bar.
7.
Brake Thermal Efficiency (%)Load CR IP 200 bar
B0 Th0 B20 Th20 B50 Th50 B100 Th100
0 16 2.36 4.68 2.65 2.54 1.48 0.30 1.99 0.35
3 16 15.87 35.11 15.51 16.16 14.80 11.16 14.00 19.63 6 16 23.60 51.88 22.01 23.00 23.43 20.31 20.94 30.12 9 16 29.18 68.12 29.69 29.07 27.63 24.06 27.35 30.62 12 16 31.90 75.32 31.97 31.76 31.71 29.82 30.03 30.30
Load CR IP 205 bar
B0 Th0 B20 Th20 B50 Th50 B100 Th100
0 16 3.00 5.68 2.85 3.20 2.96 1.11 2.65 1.35
3 16 16.62 37.11 15.75 20.94 16.24 18.26 16.25 13.91 6 16 25.15 53.88 26.68 25.51 23.56 28.87 21.26 19.16 9 16 29.32 69.12 30.17 33.24 29.49 28.55 27.65 22.18 12 16 33.70 77.32 32.88 36.81 31.92 32.64 30.25 27.20
Table 21
Load CR IP 210 bar
B0 Th0 B20 Th20 B50 Th50 B100 Th100
0 16 2.38 4.28 2.33 2.29 1.17 0.29 1.28 0.30
3 16 15.70 34.11 15.15 15.72 14.14 10.91 13.96 19.23
6 16 22.70 51.08 21.55 22.78 21.39 19.46 20.09 29.89
9 16 28.57 67.12 29.15 28.20 26.61 23.29 25.52 30.12
12 16 31.52 74.32 31.83 31.34 31.08 29.54 28.28 30.20
Table 22
The brake thermal efficiency of diesel engine at injection pressure 200 bar, 205 bar and 210 bar is shown in table no. 20, 21, 22 and it is clear that the Brake thermal efficiency is first increase from 200 bar to 205 bar and after that it decrease from 205 bar to 210 bar.
8.
Fuel Consumption (Kg/h)Load CR IP 200 bar
B0 Th0 B20 Th20 B50 Th50 B100 Th100 0 16 0.40 0.42 0.45 0.47 0.65 0.48 0.55 0.56 3 16 0.55 0.49 0.55 0.58 0.70 0.56 0.65 0.67 6 16 0.70 0.62 0.72 0.65 0.80 0.65 0.75 0.77 9 16 0.80 0.75 0.80 0.78 0.85 0.75 0.85 0.87 12 16 0.95 1.05 0.90 0.99 0.95 1.15 1.25 1.30
Table 23
Load CR IP 205 bar
B0 Th0 B20 Th20 B50 Th50 B100 Th100 0 16 0.35 0.38 0.32 0.38 0.40 0.38 0.30 0.38 3 16 0.45 0.43 0.47 0.43 0.50 0.43 0.50 0.43 6 16 0.60 0.54 0.62 0.54 0.60 0.54 0.60 0.54 9 16 0.70 0.69 0.70 0.69 0.75 0.69 0.75 0.69 12 16 0.85 0.90 0.85 0.90 0.85 0.90 0.90 0.90
Table 24
Load CR IP 210 bar
B0 Th0 B20 Th20 B50 Th50 B100 Th100 0 16 0.46 0.49 0.52 0.55 0.70 0.55 0.60 0.63 3 16 0.60 0.55 0.59 0.68 0.75 0.62 0.70 0.73 6 16 0.75 0.67 0.78 0.75 0.85 0.70 0.80 0.83 9 16 0.85 0.80 0.83 0.88 0.90 0.80 0.90 0.93 12 16 1.05 1.15 1.20 1.25 1.05 1.25 1.30 1.35
The fuel consumption of diesel engine at injection pressure 200 bar, 205 bar and 210 bar is shown in table no. 23, 24, 25 and it is clear that the fuel consumption is first decrease from 200 bar to 205 bar and after that it increase from 205 bar to 210 bar.
9.
Mechanical Efficiency (%)Load CR IP 200 bar
B0 Th0 B20 Th20 B50 Th50 B100 Th100
0 16 3.30 3.44 2.70 3.38 2.86 2.36 2.06 4.56
3 16 23.99 25.47 25.41 29.43 24.26 14.74 18.90 16.01 6 16 39.73 42.42 41.79 47.71 44.68 28.09 34.67 24.43 9 16 51.15 58.58 65.29 66.47 57.85 42.88 51.38 36.98 12 16 60.68 67.08 72.75 83.23 72.13 63.46 59.43 55.66
Table 26
Load CR IP 205 bar
B0 Th0 B20 Th20 B50 Th50 B100 Th100
0 16 6.08 5.68 3.74 6.63 4.29 4.34 3.95 7.43
3 16 35.58 37.11 30.95 33.21 33.95 28.85 31.65 32.86 6 16 58.50 53.88 56.67 54.27 54.03 45.22 55.89 49.54 9 16 73.17 69.12 77.00 72.65 74.61 60.55 73.62 67.05 12 16 90.30 77.32 86.49 87.52 88.45 81.35 89.54 84.07
Table 27
Load CR IP 210 bar
B0 Th0 B20 Th20 B50 Th50 B100 Th100
0 16 2.90 2.39 2.60 2.61 2.22 2.05 1.99 4.06
3 16 22.28 23.29 22.16 18.90 23.19 14.30 18.66 15.81 6 16 38.44 36.81 37.64 34.01 43.78 27.95 33.23 23.43 9 16 49.26 45.37 52.33 53.51 48.53 41.94 60.46 36.18 12 16 60.34 61.79 68.53 56.13 66.09 63.06 58.44 55.06
Table 28
The mechanical efficiency of diesel engine at injection pressure 200 bar, 205 bar and 210 bar is shown in table no. 26, 27, 28 and it is clear that the mechanical efficiency is first increase from 200 bar to 205 bar and after that it decrease from 205 bar to 210 bar.
V. CONCLUSION
As discussed above the injection model developed for single cylinder four stroke diesel engine is suited for injection pressure 205 bar and for fuel composition of 20% Jetropha Biodiesel and 80% Diesel in Biodiesel blend.
REFERENCES
[1] Amin Maghbouli , Wenming Yang , Hui An , Jing Li , Sina Shafee “Effects of injection strategies and fuel injector configuration on combustion and emission characteristics of a D.I. diesel engine fueled by bio-diesel” 2014 Elsevier Ltd.
[2] B. RajendraPrasath, P. Tamil Porai, Mohd. F. Shabir “Two-zone modeling of diesel/ biodiesel blended fuel operated ceramic coated direct injection diesel engine”2010 International Energy and Environment Foundation - All rights reserved.]
[3] B.P Singh, and P.K Sahoo “ A Simulation Model for Predicting the Performance of Bio Fuels Conventional Engine” 2012 IJETSE
[4] C.D. Rakopoulos and E.G. Giakoumis“Second-Law Analysis of Indirect Injection Turbocharged Diesel Engine Operation under Steady-State
and Transient Conditions “2005 SAE International
[5] Claes Ericson, Björn Westerberg,Magnus Andersson, Rolf Egnell “Modelling diesel engine combustion and NOx formation formodel based
[6] Dhandapani Kannan a , Senthilkumar Pachamuthu b, Md. Nurun Nabi a, Johan Einar Hustad a, Terese Løvås a” Theoretical and experimental investigation of diesel engine performance, combustion and emissions analysis fuelled with the blends of ethanol, diesel and jatropha methyl ester” 2011 Published by Elsevier Ltd.
[7] Hui An , Wenming Yang, Jing Li, Amin Maghbouli, Kian Jon Chua, Siaw Kiang Chou “A numerical modeling on the emission characteristics
of a diesel engine fueled by diesel and biodiesel blend fuels” 2014 Elsevier Ltd
[8] John Agudelo, Elkin Gutiérrez, Pedro Benjumea “Experimental Combustion analysis of a hsdidiesel engine fuelled with palm oilbiodiesel-diesel fuel blends”dyna, año 76, nro. 159, pp. 103-113. medellíng, sept de 2009. issn 0012-7353
[9] K. BalaShowry, Dr. A.V.S. Raju, Dr. P. Ravinder Reddy “Multi-Dimensional Modeling of Direct Injection Diesel Engine and Effects of Split
Injection”International Journal of Scientific and Research Publications, Volume 2, Issue 1, January 2012
[10] M. Hillion, H. Buhlbuck, and J. Chauvin “Combustion Control of Diesel Engines Using Injection Timing”2009 SAE International
[11] M. Pandian, S.P. Sivapirakasam , M. Udayakumar” Investigation on the effect of injection system parameters on performance and emission