DOI: 10.1534/genetics.105.041525
Epistasis in Monkeyflowers
John K. Kelly
1Department of Ecology and Evolutionary Biology, University of Kansas, Lawrence, Kansas 66045 Manuscript received February 3, 2005
Accepted for publication May 1, 2005
ABSTRACT
Epistasis contributes significantly to intrapopulation variation in floral morphology, development time, and male fitness components ofMimulus guttatus. This is demonstrated with a replicated line-cross ex-periment involving slightly over 7000 plants. The line-cross methodology is based on estimates for means. It thus has greater power than the variance partitioning approaches historically used to estimate epistasis within populations. The replication of the breeding design across many pairs of randomly extracted, inbred lines is necessary given the diversity of multilocus genotypes residing within an outbred deme. Male fitness is shown to exhibit synergistic epistasis, an accelerating decline in fitness with inbreeding. Synergism is a necessary, but not sufficient, condition for a mutational deterministic hypothesis for the evolutionary maintenance of sexual reproduction. Unlike male fitness measures, flower morphology and development time yield positive evidence of epistasis but not of synergism. The results for these traits suggest that epistatic effects are variable across genetic backgrounds or sets of interacting loci.
E
PISTASIS is the interaction between different ge-netic loci in determining phenotype. The preva-lence and nature of epistasis are central to a range of questions in evolutionary biology. Sewall Wright devel-oped his shifting balance theory to provide a mecha-nism for the evolution of favorable gene combinations (Wright1931; Wade1992). The evaluation of this the-ory, and more generally of the interaction between epis-tasis and population structure, has been a major impetus to experimental work (Malletand Singer1987; Husband and Barrett1992a,b; see reviews by Coyneet al.1997; Wade and Goodnight 1998). Ronald Fisher, the principal antagonist to the shifting balance model, him-self invoked ‘‘modifiers’’ in a number of evolutionary hypotheses (e.g., Fisher1958, Chap. 3). Modifiers, which are epistatic by definition, were also a recurring theme of Fisher’s colleagues in the ecological genetics school (Ford 1971). More recently, evolutionary geneticists have explored the role of gene interactions on the evo-lution of sex and recombination (Peters and Lively 2000), developmental integration (Rice 1998), specia-tion (Rieseberg et al. 1996; Johnson 2000), and the rate and pattern of adaptive diversification (Wade 2000).There is a great deal of evidence that epistasis con-tributes to the genetic differences among species (e.g., Doebley et al. 1995; Fishman and Willis 2001) and among populations within a species (e.g., Hardet al. 1992; Burtonet al.1999; Fensterand Galloway2000). This has been established by comparing the average
phenotype of various hybrids (the F1, F2, or backcross progeny) to the corresponding values of the parental species or lines. Without epistasis, the mean phenotype of F2 individuals should be exactly intermediate be-tween the F1and midparent means (the midparent is the average of the parental species). The often observed ‘‘F2breakdown,’’ where the average F2phenotype is sub-stantially lower than expected, is thus an example of epis-tasis (Grant1975; Burton1990). Fine mapping of the variants responsible for hybrid failure in interspecies crosses has subsequently revealed complicated patterns of gene interaction (Cabotet al. 1994; Palopoli and Wu1994; but also see Zenget al.2000).
The finding of epistasis in interspecies crosses is not compelling evidence that selection acted on gene combinations to produce the phenotypic divergence between these species (Whitlocket al.1995, pp. 612– 613). Nor does it directly imply that epistatic variation was present within the ancestral species. In fact, the loci interacting to cause hybrid failure may never have been simultaneously polymorphic within the ancestral population. The classical Dobzhansky-Muller model of hybrid breakdown yields interspecies epistasis with-out selection ever acting directly on gene combinations (Dobzhansky1936; Muller1939; Orr1995). We need to consider the genetic variability present within species to evaluate the evolutionary consequences of epistasis.
Barker(1979) reviewed attempts to estimate the con-tribution of epistasis to quantitative trait variation within contiguous natural populations, i.e., demes. Consider-ing studies of different types (e.g., variance partitionConsider-ing, response to selection and inbreeding, and linkage dis-equilibria), he concluded that the evidence was ‘‘equiv-ocal and unsatisfying.’’ This could be interpreted to
1Address for correspondence:Department of Ecology and Evolutionary
Biology, University of Kansas, 1200 Sunnyside Ave., Lawrence, KS 66045-7534. E-mail: [email protected]
mean that epistasis is simply more important in deter-mining differences among highly divergent genotypes (species or lines) than the more modest differences among individuals within demes. Alternatively, the differing results from inter- and intraspecific studies may simply reflect differences in statistical power (Fenster et al. 1997). The line-cross method used in agricultural and inter-species studies is based on statistical comparisons of mean phenotypic values. In contrast, the variance-partitioning approaches frequently used to estimate epistasis within populations (e.g., Milleret al.1963; Barker1974) are based on second moments, variances, and covariances. For a given sample size, means are typically estimated with far greater accuracy than variances or covariances.
The traditional method of model evaluation in line-cross studies is the joint scaling test (Mather 1949; Anderson and Kempthorne 1954; Hayman 1960; Matherand Jinks1982). Following Lynchand Walsh (1998, Chap. 9), I refer to the various categories of in-dividuals such as the parental lines, F1, F2, and back-crosses as ‘‘line-cross derivatives.’’ In a joint scaling test, the means for each line-cross derivative are used to calibrate and then test models of inheritance. Analysis generally begins by considering the simplest model, additive inheritance. With strict additivity, the means of all line-cross derivatives can be predicted given only two parameters, the overall mean (M) and the additive effect (A). A set of expected values for each line-cross derivative is obtained by estimating these parameters. The correspondence between observed and expected means, and hence the sufficiency of the model, can then be evaluated using the chi-square test. If the strictly additive model is rejected, one then proceeds to evaluate a model allowing dominance (three parameters:M,A, andD, the dominance deviation). The rejection of this model implies epistasis. With a sufficient number of dis-tinct line-cross derivates, increasingly complicated mod-els of gene interaction can be tested (e.g., Jinks and Perkins1969).
A frequently cited shortcoming of line-cross studies is that the results, estimates for dominance and epistasis, are specific to the particular pair of inbred lines chosen as parentals. This is not a serious difficulty for many agricultural applications, because a limited number of cultivars/varieties/genotypes are widely used by farm-ers. However, there are an enormous number of distinct multilocus genotypes in an outbred deme. It is difficult, perhaps even impossible, to realistically concentrate this variability into a single pair of inbred lines.
This article describes a study using the line-cross methodology to investigate variation resident within a single natural population. I replicate the joint scaling test across a large collection of inbred lines that are representative of the ancestral outbred population in terms of allele frequencies at quantitative trait loci. Lines were randomly paired without consideration of their phenotypic attributes and each pair of lines was
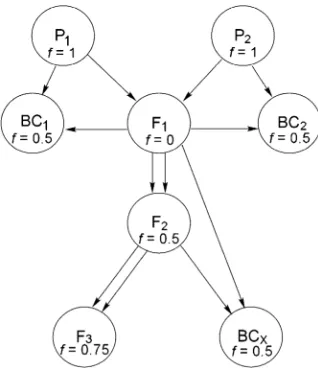
used to synthesize a set of line-cross derivatives (Figure 1). The progeny produced from this array of crosses were grown under common conditions and measured for development time, flower morphology, and male fit-ness components. This experiment addresses two basic questions: Do these traits exhibit significant epistasis? If so, are epistatic effects consistent in their direction across sets of interacting loci?
The characters chosen for study, flower morphology, development time, and pollen production, are primary determinants of plant fitness in the wild. The genetic analysis of measurements on these traits consists of two parts, both of which are based on comparisons of mean phenotypic values. The first considers the phenotypic response to inbreeding. In the context of the ancestral population, line-cross derivatives have inbreeding coef-ficients (f) that range from 0 to 1 (Figure 1). A simple test for epistasis within a diploid population is to deter-mine whether the relationship between the average trait value andfis nonlinear. If loci contribute additively to trait variation, the mean phenotype should change linearly withf (Wright1951; Kempthorne1957). In contrast, consistently positive or consistently negative in-teractions among loci predict a nonlinear relationship between mean phenotype and f (Crow and Kimura 1970, pp. 77–85).
The failure to detect nonlinearity in the relationship between mean phenotype andfdoes not conclusively in-dicate the absence of epistasis. An approximately linear relationship may be obtained if epistatic effects are im-portant, but variable in direction across loci (Elenaand Lenski 1997; Phillips et al. 2000). However, such variable epistatic effects should be evident as deviations between observed and expected means within individ-ual cross-families. For example, the mean value of F2 plants may be significantly greater than the expected values in some families, but less than those in others. These deviations may cancel when considering the pop-ulation as a whole because all F2plants have the same inbreeding coefficient. However, these fluctuating de-viations are appropriately integrated in the Replicated joint scaling test to produce a population-wide test for epistasis.
MATERIALS AND METHODS
variation for floral traits (Carrand Fenster1994; Robertson
et al.1994; Kellyand Arathi2003), and in the timing of selfing over the life span of the flower (Dole 1990; Dudash and Ritland 1991; Leclerc-Potvin and Ritland 1994; Arathi
et al.2002).
This experiment investigates genetic variation within one particular natural population called ‘‘Iron Mountain,’’ which is located in Oregon’s Western Cascades (see Willis 1996, 1999a,b). Iron Mountain contains several hundred thousand individuals continuously distributed over an area of400 square meters. The population contains a tremendous amount of variation at microsatellite loci (Kellyand Willis1998, 2002). Some loci have 20–30 alleles and expected heterozygosities.0.8, indicating that the population has not suffered a recent bottle-neck in size. Despite limitations on both seed and pollen dis-persal, microsatellite polymorphisms exhibit little or no spatial structure within this population (Sweigart et al.1999). The implication is that gene flow is sufficient so that Iron Mountain can be considered a cohesive genetic population for evolution-ary studies. However, the microsatellite data do not imply that spatial structure is absent at loci that might be under stronger selection.
John H. Willis initiated1200 independent lines from Iron Mountain in August of 1995. Each line was founded from the seed set of a separate field-collected plant. Each line was sub-sequently maintained by single-seed descent (self-fertilization) for seven to nine generations. Over the course of these gen-erations, most lines went extinct due to the random fixation of lethal and/or sterile alleles. However, over 300 survived to at least generation seven. The progeny of these surviving lines now have an inbreeding coefficient of.0.99. As expected, the surviving lines are almost completely homozygous at highly poly-morphic microsatellite loci with different lines fixed for differ-ent alleles (Willis1999a; L. Holeski, unpublished results).
Crossing design:Two hundred of these lines were used as parental plants in a breeding design (Figure 1). Pairs of lines, P1 and P2, were randomly selected to initiate independent ‘‘line-cross families.’’ These lines were crossed to produce an F1 family. The F1 individuals were self-fertilized to produce F2 families and also crossed to each parental line to produce back-cross families: Backback-cross (BC)1is the family derived from the cross between P1and F1while BC2is the family derived from P2 and F1. Seeds from the F2family were grown to maturity, self-fertilized to produce an F3family, and backcrossed to an F1 individual. I denote progeny from the last cross as BCX. Due to
failure of crosses or seed germination, only 76 line-cross families had at least 4 line-cross derivatives, and for reasons described below, the replicated joint scaling tests are limited to these data. The controlled matings and self-fertilizations described in Figure 1 were conducted over the span of three plant gen-erations, distinct from the generations in which plants were measured (seePhenotypic measurements and plant growth). Most of the line-cross derivatives within a line-cross family were synthesized from multiple crosses, each from a pairing of dis-tinct individuals of the parental types. Many of the crosses were done reciprocally, with both parental line-cross derivatives serving as the maternal plant. For example, the collection of F1 plants in line-cross family 84 consisted of five full-sib families, each derived from a distinct pairing of P1and P2individuals. Multiple crosses were done for a number of reasons. First, they effectively eliminated any association between the age of seed when sown and the inbreeding coefficient (Lynchand Walsh 1998, pp. 262–263). Seeds for P1and P2were generated in the first generation of the mating scheme, simultaneously with the first set of F1plants. A second set of P1and P2seeds was created in the second generation of the mating scheme, simulta-neously with the synthesis of BC1, BC2, and F2plants; and a third set was created in the final generation, simultaneously
with the synthesis of BCXand F3plants. Seeds for several of the other derivates, BC1, BC2, F1, and F2, were also generated during different generations of the breeding scheme.
Synthesizing line-cross derivatives from multiple crosses also alleviates potential biases caused by maternal effects. The phenotype of an individual may depend not only on its own inbreeding coefficient, but also on that of its mother (Vogler
et al.1999). The maternal inbreeding effect can be estimated by comparing plants from reciprocal crosses in which the parents differ in their respective inbreeding coefficients. In the present crossing design (Figure 1), each backcross family was derived from a cross between a completely inbred plant (P1or P2) and an outbred F1. The two sets of progeny in the reciprocal cross have the same individual inbreeding coef-ficients (f¼ 0.5), but different maternal inbreeding coeffi-cients (either 0 or 1). A consistent difference in phenotype across line-cross families, say reduced pollen production by plants with inbred moms, would indicate an effect of maternal inbreeding. In addition to the backcrosses, the cross generat-ing BCXwas done reciprocally between parents with differing
inbreeding coefficients.
Three of the eight line-cross derivatives (P1, P2, and F1) are genetically homogenous. All individuals within these catego-ries are genetically identical, both within and among full-sib families (at least for the autosomal genome within a particular line-cross family). The F1plants may be heterogeneous in the cytoplasmic genome, as it may be descended from different parental lines in different full-sib families. The other five line-cross derivatives (BC1, BC2, F2, F3, and BCX) will contain a
mixture of genotypes even in the autosomal genome. The parents are genetically homogeneous for the first three of these derivates, BC1, BC2, and F2. Thus, for the autosomal ge-nome, there is no greater genetic relatedness of individuals within full-sib families than among full-sib families (again we are referring to the different progeny sets within these line-cross derivatives of a particular line-line-cross family). However, for the last two derivates, F3and BCX, at least one of the parents is
an F2 individual. Since the F2 is genetically heterogeneous, there is increased genetic relatedness of individuals within full-sibs of the F3 and BCX line-cross derivatives. These
consid-erations do not directly impact the calculations described below, because they are based entirely on the mean values of line-cross derivatives. However, they are relevant to the more rigorous treatment that includes the variance within line-cross derivatives to be described in a future article ( J. K. Kelly, unpublished results).
Phenotypic measurements and plant growth: Phenotypic data were collected from plants grown in three successive intervals. The first ‘‘block’’ was initiated on May 8, 2003, using only six of the line-cross derivatives within each line-cross fam-ily, the P1, P2, F1, BC1, BC2, and F2. The second block of plants, initiated on July 30, 2003, also consisted of plants from the first six line-cross derivatives. The third block, the seeds of which were sown on Jan 20, 2004, consisted of plants from all eight line-cross derivatives. Seeds were germinated under standard conditions in the greenhouse (see Kellyand Arathi2003), and 2 weeks later, individual seedlings were transplanted into 98-well plug trays. These trays were maintained in a growth room with 18-hr days and 6-hr nights. Plants were fertilized once per week by bottom watering using a high P nutrient mixture. Trays were rotated daily. I noted the day on which each plant produced its first flower and then measured corolla width, corolla length, pistil length, and anther length. Stigma-anther separation is calculated as the difference between the latter two measurements.
from each tube was then diluted into 20 ml of electrolyte solution and run through the machine to produce particle counts within two size ranges. My estimate for total pollen per flower is the sum of these two counts320 (since only 1 ml of solution is processed in a run of the machine). The pollen size index (PSI) is the proportion of grains in the larger size category. There is a strong positive correlation between PSI and pollen viability as measured through standard staining techniques (Kellyet al.2002). The proportion of viable grains (PV) is accurately estimated from the equation: PV¼0.l1PSI. For the rare samples in which PSI.0.9, I set PV¼1.0. Viable pollen per flower was calculated as the product of PV and pollen number. In data analysis, I treat pollen traits as char-acteristics of the parental plant (the sporophyte).
ANALYSIS AND RESULTS
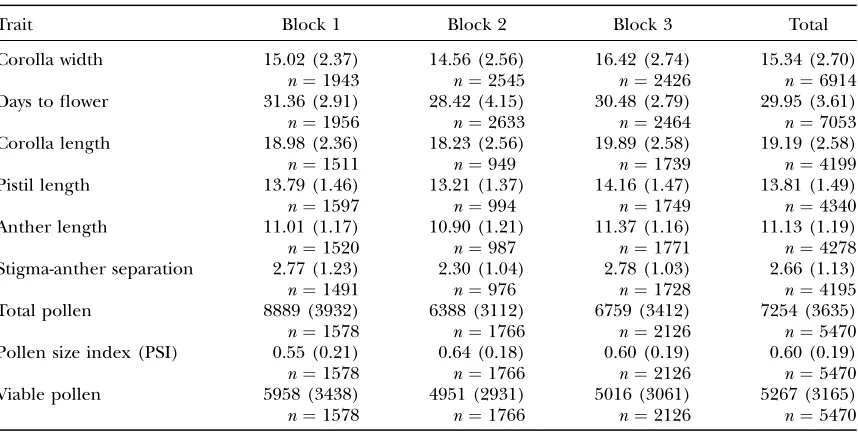
Table 1 summarizes the means, standard deviations, and sample sizes for each trait in each of the three blocks. Since each block contains different proportions of inbred and outbred individuals, the differences in mean trait values are only partly reflective of a ‘‘block effect.’’ A substantial number of measurements are mis-sing from the 7053 plants in the study. Day of first flower was noted for all plants and the great majority were measured for corolla diameter. The remaining measure-ments were taken on most, but not on all plants.
Each trait was subjected to two analyses, first the combined population analysisand then thereplicated joint scaling test. Both involve comparisons of different sta-tistical models. The model parameters are estimated from means and standard errors using generalized least squares. The fitted model is then used to establish a set of ‘‘expected values’’ for each mean. Observed and
ex-pected values are compared, using chi-square statistics to assess significance. I wrote C programs to conduct the relevant calculations following the theory described in Lynchand Walsh(1998, pp. 198–204 and 216–219). The code for these programs and a sample input file (plant data) are provided in the supplemental materials (http://www.genetics.org/supplemental/).
Combined population analysis: This procedure
de-termines the effects of block, individual inbreeding, and maternal inbreeding on each character. Letm denote the outbred grand mean for a particular trait and Bi
represent the effect of blocki. I assume that, if maternal inbreeding matters, the effect (v) is linearly related to the inbreeding coefficient of the maternal plant (Fm). Finally,djrepresents the effect of individual inbreeding
coefficient j on trait values. Individual inbreeding co-efficients were 0 (F1plants), 0.5 (BC1, BC2, F2, and BCX),
0.75 (F3), or 1 (P1and P2) in this experiment (Figure 1). The general model for the expected mean phenotype can then be written as
Zij ¼m1Bi1vFm1dj: ð1Þ
There are seven distinct parameters in this model for this study (m,B2,B3,v,d0.5,d0.75, andd1.0). The param-etermessentially estimates the mean of outbred plants with outbred mothers when grown in block 1.
Of the 36 possible combinations of block, individual inbreeding, and maternal inbreeding, 14 were actually represented in this study. By generalized least squares, I estimated the seven parameters in Equation 1 from this set of means and standard errors. A chi-square value was calculated from the observed and expected means, and this statistic was used in tests for phenotypic responses to
TABLE 1
The mean, standard deviation (in parentheses), and sample size (n) for each measured trait are given for each block and for all plants pooled
Trait Block 1 Block 2 Block 3 Total
Corolla width 15.02 (2.37) 14.56 (2.56) 16.42 (2.74) 15.34 (2.70)
n¼1943 n¼2545 n¼2426 n¼6914
Days to flower 31.36 (2.91) 28.42 (4.15) 30.48 (2.79) 29.95 (3.61)
n¼1956 n¼2633 n¼2464 n¼7053
Corolla length 18.98 (2.36) 18.23 (2.56) 19.89 (2.58) 19.19 (2.58)
n¼1511 n¼949 n¼1739 n¼4199
Pistil length 13.79 (1.46) 13.21 (1.37) 14.16 (1.47) 13.81 (1.49)
n¼1597 n¼994 n¼1749 n¼4340
Anther length 11.01 (1.17) 10.90 (1.21) 11.37 (1.16) 11.13 (1.19)
n¼1520 n¼987 n¼1771 n¼4278
Stigma-anther separation 2.77 (1.23) 2.30 (1.04) 2.78 (1.03) 2.66 (1.13)
n¼1491 n¼976 n¼1728 n¼4195
Total pollen 8889 (3932) 6388 (3112) 6759 (3412) 7254 (3635)
n¼1578 n¼1766 n¼2126 n¼5470
Pollen size index (PSI) 0.55 (0.21) 0.64 (0.18) 0.60 (0.19) 0.60 (0.19)
n¼1578 n¼1766 n¼2126 n¼5470
Viable pollen 5958 (3438) 4951 (2931) 5016 (3061) 5267 (3165)
n¼1578 n¼1766 n¼2126 n¼5470
both maternal and individual inbreeding. Both of the null hypotheses described below are defined as simpli-fied versions of Equation 1.
To test whether the level of maternal inbreeding had an effect on a character, I setv¼0 and then reestimated the remaining parameters of Equation 1. The chi-square value produced when the expected values from this re-duced model are compared to the observed means must be greater than or equal to the corresponding chi-square from the full model. A sufficiently large difference indi-cates a significant effect of maternal inbreeding. Since the two models differ by a single parameter (1 d.f.), the appropriate critical value from the chi-square distribu-tion is 3.84. To test whether the response to individual inbreeding is linear, I estimated a model in whichd0.5¼ 0.5b,d0.75¼0.75b, andd1.0¼b, wherebis the slope. This reduces the number of parameters by 2 and the appro-priate critical value is 5.99. By similar means, one could address additional hypotheses,e.g., for an effect of block or for whether an individual inbreeding coefficient has any effect on trait values. I do not present these analyses because the effects are obvious, have been demon-strated previously, or are tangential to the purposes of this article.
Table 2 summarizes model tests for each trait on its original scale of measurement and also for log-transformed male fitness measures. The pollen traits (pollen number, PSI, and viable pollen) were log-transformed because, in many situations, the ‘‘null model’’ for fitness assumes that loci and environmental effects combine multiplicatively (Crow and Kimura 1970). These dependences become additive after log-transformation. Only number of days to flower exhibits a significant effect of maternal inbreeding, although log-transformed viable pollen is only marginally
non-significant. Response to individual inbreeding is ap-proximately linear for each morphological trait and for total pollen number (Figure 2A). However, both PSI and viable pollen show a significantly nonlinear response to inbreeding. Both fitness measures exhibit ‘‘synergistic’’ or ‘‘reinforcing’’ epistasis (Crowand Kimura 1970, pp. 80–81), an accelerating decline in value as inbreeding coefficient increases (Figure 2B).
Replicated joint scaling test:For each character, I first
applied a standard joint scaling test to each line-cross family. Prior to this analysis, the data were corrected for the effects of maternal inbreeding (for days to flower) and block effects (for all characters) as estimated in the Combined population analysis. Then, by generalized least squares, I estimated the three parameters of the additive-dominance model from the observed means and standard errors of each line-cross derivative. Using the formulation of Lynchand Walsh(1998, p. 209), the expected values are given in Table 3. The param-etersM,A, andDare specific to each line-cross family, their values defined by the genotypes of the parental lines.
If the number of estimated line-cross derivative means exceeds the number of estimated parameters, then a test of model sufficiency is possible. Thus, we require only four line-cross derivatives to test the additive-dominance model, but more derivatives (up to eight here) increase power to detect epistasis. The hypothesis test for a particular line-cross family is similar to that used previously. I first established expected values for each line-cross derivative using the estimated values for M,A, andD. Deviations between observed and expected Figure1.—A diagram of the crossing scheme used to
syn-thesize line-cross families. Each circle encloses a line-cross de-rivative and arrows denote the transmission of a gamete. The inbreeding coefficient (f) relative to the ancestral population is given for each derivative.
TABLE 2
The chi-square values and test results from the combined population analyses (see text for details)
Null hypothesis No maternal
effect:x2 ½1
No epistasis:
x2 ½2
Untransformed trait values
Corolla width 1.39 4.06
Days to flower 3.96* 2.25
Corolla length 0.00 1.79
Pistil length 0.76 0.82
Anther length 0.73 0.07
Stigma-anther separation 0.15 0.32
Pollen no. 0.16 4.49
PSI 1.86 45.19***
Viable pollen 0.34 8.03*
Log-transformed pollen values
Ln(pollen no.) 2.03 3.78
Ln(PSI) 2.33 42.53***
Ln(viable pollen) 3.85 16.51***
means were measured using a chi-square statistic. This statistic was then compared to the chi-square distribu-tion with the number of degrees of freedom equal to the number of line-cross derivatives minus the number of estimated parameters (three).
Figure 3 provides a sample of results for corolla width and PSI within three line-cross families. The degree of correspondence between the observed means of line-cross derivatives and those predicted from the nonepi-static model is highly variable, both among line-cross families for a particular character and among traits within a line-cross family. For most characters, the mag-nitude and direction of deviations for particular deriv-atives are idiosyncratic. For example, the observed mean corolla width of F3 plants is substantially less than expected in line-cross family 6, slightly less than pected in family 41, but substantially greater than ex-pected in family 61 (Figure 3, left column). However, the nonlinear relationship between PSI and inbreeding coefficient (Figure 2) does yield some patterns for this trait. Consistent with a convex relationship, observed means are often less than expected for the line-cross derivatives at the ends of the range of inbreeding
co-efficients (P1, P2, and F1), but greater than expected for derivates with intermediate inbreeding coefficients (Figure 3, right column).
Results from the full collection of line-cross families can be synthesized into a single test by noting that each family is independent. Each one is based on measure-ments of distinct plants derived from distinct lines, randomly extracted from the ancestral population. As a consequence, I can simply sum the chi-square values and degrees of freedom across families. This provides an overall test for each trait and eliminates any ‘‘multiple-tests problem’’ associated with attempting to draw con-clusions from the collection ofP-values from individual line-cross families. The cumulative chi-square values and degrees of freedom are given in Table 4. In the full data set, all traits exhibit highly significant deviations from the nonepistatic model.
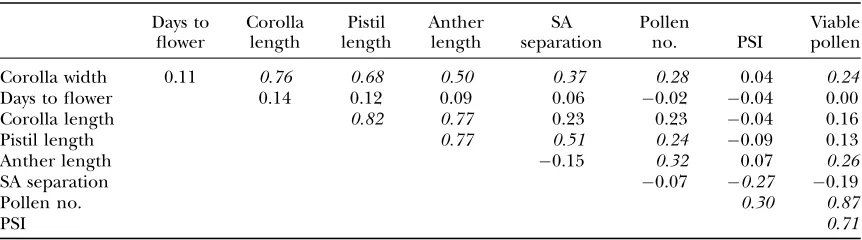
The complete collection of estimated values (across line-cross families) allows a range of comparisons. For example, the correlations of F1means for different traits are given in Table 5. Measures of flower size (corolla width, corolla length, anther length, and pistil length) exhibited strong, positive correlations. The number of pollen grains and the estimated number of viable grains showed lower, but still significantly positive correlations with flower size. There was a significant positive rela-tionship between number of pollen grains and PSI (see also Willis1999b). Stigma-anther separation was neg-atively correlated with PSI. Development time was not significantly correlated with any other measure, at least not for F1mean values.
Given the variability among line-cross families, it is worthwhile to consider the factors most closely related to the magnitude of deviations from the nonepistatic model. One might expect the chi-square value to in-crease with the amount of phenotypic differentiation between parental lines (given the greater evidence for epistasis in inter-vs.intraspecific crosses, see Introduc-tion). However, this expectation is not born out in these data: There was no relationship between chi square and
TABLE 3
The expected values for each line-cross derivative as a function of genetic parameters
Line-cross derivative Expected mean phenotype
P1 M1AD
P2 MAD
F1 M1D
F2 M
BC1 M11
2A
BC2 M12A
F3 M1
2D
BCX M
Mis the overall mean (standardized to the F2generation), Ais the additive effect, andDis the dominance deviation.
the amount of difference between P1 and P2 for any character.
The majority of estimates forD, the dominance devia-tion, were negative for days to flower, but positive for other traits. These observations are consistent with ‘‘heterosis,’’ the tendency for crossing of lines to in-crease fitness or yield. Mollet al.(1965) noted that the magnitude of heterosis in corn appears to be greatest in crosses between lines that are divergent to an interme-diate degree (Lynchand Walsh1998, pp. 225–226). I plotted estimates of D vs. the absolute phenotypic dif-ference between P1and P2for each character. As with chi-square values, the relationships between line dif-ferentiation and D-estimates were weak and generally nonsignificant.
Scale transformation: The logarithm is only one of
many nonlinear but monotonic functions that can be
applied to measurements prior to analysis. The simplest form of epistasis is scalar. Loci affecting a trait contrib-ute additively to a genetic value,g. The phenotype,z, is equal toF(g1e), whereeis the environmental effect andF(*) is a simple nonlinear, but generally monotonic, function. Scalar epistasis can be ‘‘removed’’ by applying a transformation to the measurements:z9¼F1(z)¼g1e. The standard model accurately describes inheritance of the transformed variable,z9.
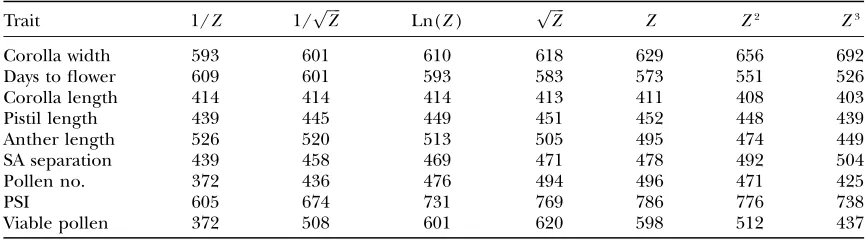
It is thus useful to determine if the significant devia-tions from the additive-dominance model (documented in Table 6) can be eliminated by applying scale trans-formations. To evaluate this possibility, I applied the power series transformations over the four orders of magnitude spanning the original scale of measurement (Box and Cox1964; Sokaland Rohlf2000, p. 419). Letting Z denote the original values, the following se-ries of transformations were applied to each trait: 1/Z, 1/pffiffiffiffiZ, Ln(Z),pffiffiffiffiZ,Z2, andZ3. While scale transforma-tion did reduce cumulative chi-square values of some traits, all replicated joint scaling tests remained highly significant.
The same set of scale transformations can also be applied to measurements prior to the combined pop-ulation analysis. For most characters this is unwarranted given the approximately linear response to inbreeding on the original scale of measurement. The reciprocal (1/Z) and 1/pffiffiffiffiZ transformations do reduce the mag-nitude of nonlinearity in PSI and viable pollen, but deviations remain significant. Moreover, since scale of measurement is not arbitrary for fitness components (or at least not for their evolutionary interpretation), an explicit nonlinear regression is more informative (Fig-ure 2B, seediscussion).
DISCUSSION
Epistasis seems inevitable when one considers the interconnected nature of biochemical pathways and
TABLE 4
Results from the replicated joint scaling test (see text for details)
d.f. total Cumulativex2
Untransformed trait values
Corolla width 306 628.5***
Days to flower 307 573.3***
Corolla length 296 411.3***
Pistil length 295 451.3***
Anther length 297 495.0***
Stigma-anther separation 295 477.9***
Pollen no. 304 496.0***
PSI 304 785.5***
Viable pollen 304 598.2***
Log-transformed pollen values
Ln(pollen no.) 304 475.9***
Ln(PSI) 304 731.4***
Ln(viable pollen) 304 600.5***
Significance levels: ***P,0.001.
TABLE 5
The correlations of F1means between different traits (each line-cross family contributes a single value
for each trait)
Days to flower
Corolla length
Pistil length
Anther length
SA separation
Pollen
no. PSI
Viable pollen
Corolla width 0.11 0.76 0.68 0.50 0.37 0.28 0.04 0.24
Days to flower 0.14 0.12 0.09 0.06 0.02 0.04 0.00
Corolla length 0.82 0.77 0.23 0.23 0.04 0.16
Pistil length 0.77 0.51 0.24 0.09 0.13
Anther length 0.15 0.32 0.07 0.26
SA separation 0.07 0.27 0.19
Pollen no. 0.30 0.87
PSI 0.71
gene networks. Yet evidence of epistasis in quantitative character variation is surprisingly weak, at least within contiguous natural populations (demes). This study supports the view that our failure to see epistasis is not due to its absence. Statistical power is a central issue in practically all studies of quantitative variation. Attempts to distinguish the contributions of additive effects, dom-inance deviations, and gene interactions to trait var-iation are confounded by the large statistical error associated with variance estimates. This analysis ofM. guttatus, based on comparisons of phenotypic means, provides clear evidence of epistasis in development time, floral morphology, and male fitness components.
The increasing use of genomic techniques,e.g., QTL mapping, is frequently cited as the key to elucidating the contribution of epistasis to quantitative trait variation (e.g., Erickson et al. 2004). The measured genotype approach, in which phenotype is determined for col-lections of individuals sharing the same molecular genotypes, has yielded both positive and negative results regarding the importance of epistasis (positive results: Longet al. 1995; Clark and Wang 1997; Elena and Lenski1997; Routman and Cheverud 1997; Lukens and Doebley1999; Templeton2000) (negative results: Tanksley1993 and references therein). In some stud-ies (e.g., Weberet al.1999), results have been ambiguous despite extensive replication. The ability to isolate partic-ular genomic regions and directly associate phenotype with a limited collection of genotypes is certainly a favor-able feature of measured genotype studies. However, their power to detect epistasis is largely a consequence of the fact that these studies are simple comparisons of mean values, those associated with different multilocus genotypes.
While based on phenotypic values, the line-cross methodology provides a surprisingly simple and direct test for epistasis (Matherand Jinks1982). The method capitalizes on the essential simplification of the
addi-tive/dominance model, the direct extrapolation from individual loci to the whole genotype. For a single locus with two alleles, there are three distinct genotypes and thus three mean values to be estimated. Given estimates for these genotypic values, one can predict the mean phenotype of all descendants from a cross between the alternative homozygotes. Under the additive/domi-nance model, the contributions of different loci sum and single-locus effects conveniently distill into aggre-gate parameters (Table 3,M,A, andD). These are suf-ficient to predict the means of all line-cross derivatives. If there is epistasis, single-locus effects do not combine in a simple fashion and the aggregate parameters will not accurately predict the means of all line-cross de-rivatives. This is the basis of the test.
When epistasis is detected in line-cross studies, the general practice is to parse deviations from the non-epistatic model into components,e.g., the additive-by-additive and additive-by-additive-by-dominance components (Mather and Jinks1982; Clarkand Wang1997; Routmanand Cheverud1997). I have not done this here. The main practical difficulty is that many of the line-cross families are incomplete, with one or more line-cross derivatives absent. Because the type and complexity of model that can be fit to the data depend on the number and type of derivatives that are present, different sorts of model would have to be fit to different line-cross families. This hinders interpretation because the same genetic ef-fect would likely be absorbed into different terms (e.g., additive-by-additive instead of additive-by-dominance) in different families.
The larger conceptual difficulty is that, beyond docu-menting the existence of epistasis, interaction variance statistics have limited inferential value. They are useful in predicting how a population will respond to inbreed-ing or genetic drift (Kempthorne 1957; Goodnight 1988), but essentially uninformative about the nature of gene interactions (Mackay2001). Phillipset al.(2000,
TABLE 6
The cumulativex2values are given from replicated joint scaling tests on transformed values of each trait
Trait 1/Z 1/pffiffiffiffiZ Ln(Z) pffiffiffiffiZ Z Z2 Z3
Corolla width 593 601 610 618 629 656 692
Days to flower 609 601 593 583 573 551 526
Corolla length 414 414 414 413 411 408 403
Pistil length 439 445 449 451 452 448 439
Anther length 526 520 513 505 495 474 449
SA separation 439 458 469 471 478 492 504
Pollen no. 372 436 476 494 496 471 425
PSI 605 674 731 769 786 776 738
Viable pollen 372 508 601 620 598 512 437
The function used for transformation is given at the top of each column. The degrees of freedom for each trait are the same as those in Table 4. For SA separation and PSI, a constant was added to all measurements (to ensure that all values were positive) prior to transformation. Allx2values are statistically significant;P,0.01 in all cases.
p. 26) go as far at to state that the ‘‘epistatic variance is so far removed from the actual interactions as to be basi-cally useless for determining the impact of gene in-teractions on evolutionary processes.’’ There does not seem to be any simple, general relationship between interaction variance statistics and response to selection. In contrast, the standard additive genetic variance is useful for predicting response to selection even when there is epistasis (Turelliand Barton 1994, p. 933; see below).
The nature of gene interactions:The standard
non-epistatic model of quantitative genetics is often consid-ered a linear approximation of the complicated mapping from genotype to phenotype. It is thus natural to at-tempt to characterize gene interactions with an explicit nonlinear function that predicts phenotype from one or more genetic metrics. These simple kinds of gene interaction, denoted ‘‘directional epistasis’’ by Phillips et al. (2000), have been considered in a variety of evo-lutionary models. Epistatic interactions among dele-terious mutations have been characterized using a function with fitness as the dependent variable and the total number of deleterious mutations (summed across loci) as the independent variable. Different treatments have considered a quadratic function (Kimura and Maruyama 1966), an exponential quadratic function (Charlesworth1990; Charlesworthet al.1991), or a step function (Kondrashov1985, 1988). Rice(1998, 2000) models the phenotype as a nonlinear function of multiple ‘‘underlying factors.’’ These factors may then be treated as genetic and environmental effects in the standard quantitative genetic model. Turelliand Orr (1995) model hybrid breakdown by allowing loci to con-tribute additively to a ‘‘breakdown scale’’ and assume that fitness is a monotonically decreasing function of this breakdown value (see also Turelliand Orr2000). Finally, Hansenand Wagner(2001) analyze a model in which the effects of allelic differences at a particular locus are a linear function of the genetic background.
The utility of these approaches, in which the in-teraction of many loci is distilled into a simple mathe-matical function, has become a subject of debate. These models will probably not prove to be mechanistically accurate in most cases. However, they may nonetheless capture essential features of the genotype-to-phenotype mapping, allowing theorists to consider otherwise in-tractable problems and providing experimentalists with meaningful parameters to estimate. Countering this view, Phillips et al.(2000) argue that the multidimensional nature of genotypic space cannot be justifiably reduced to simple one- or two-dimensional representations.
The main purpose of the combined population analysis (Table 2, Figure 2) is to identify simple direc-tional forms of gene interaction, at least types that generate a nonlinear relationship between average trait values andf, the inbreeding coefficient of plants. If loci contribute additively to trait variation, the mean
phe-notype should change linearly with f (Wright 1951; Kempthorne1957). If loci contribute multiplicatively, the relationship should be log-linear. Floral morphol-ogy and pollen number vary in an approximately lin-ear way with f, while PSI and viable pollen exhibited significant deviations from linearity. The relationship between log-transformed PSI and f is more accurately described by a quadratic function (Figure 2B, dashed line) than by a line. This suggests that pollen viability corresponds more closely to the exponential quadratic model than to either the additive or the multiplicative model.
The response to inbreeding test for epistasis has been applied to a substantial number of species, both natural and agricultural (Lynchand Walsh 1998, Chap. 10). Both linear (e.g., Hallauerand Sears1973) and non-linear (e.g., Carr and Dudash 1997) responses have been documented, but much of the evidence is equiv-ocal. Most experiments fail to include appropriate con-trols or suffer statistical flaws (Lynch1988; Lynchand Walsh1998, p. 272). Oftentimes, studies have been con-ducted over multiple generations with different levels of inbreeding assessed in different generations, which makes it impossible to distinguish inbreeding effects from environmental effects (e.g., differences in growth conditions in different generations). Statistical power is also limited when the maximum inbreeding coefficient is low (,0.25). A linear model will likely provide a good fit within a limited range of values for the inbreeding coefficient, regardless of the level of epistasis.
Perhaps the most serious difficulty in interpreting previous results concerns the potential effects of genetic purging. The linear prediction is based on the assump-tion that experimental inbreeding changes genotype frequencies without changing allele frequencies. Ran-dom fluctuations in allele frequencies can be accounted for in a statistical analysis, but deterministic changes are assumed to be absent. Unfortunately, some allele fre-quency changes are inevitable during line formation. Lines that become homozygous for mutations that are lethal or cause sterility in homozygous form will go extinct and eliminate these alleles from the experimen-tal population. Selection within lines will have similar effects even in lineages that survive. As a consequence, the frequencies of deleterious mutations will differ be-tween inbred and outbred individuals. Depending on circumstances, genetic purging of this kind can either produce artificial nonlinearities or obscure genuine epistasis.
of inbreeding coefficients simultaneously. The multigener-ational crossing scheme eliminated any association between seed age and inbreeding coefficient. Recipro-cal crosses between plants inbred to differing degrees disentangle individual and maternal inbreeding effects. Lynch(1988) also noted that many statistical analy-ses of response to inbreeding have failed to account for the genetic relatedness of individuals within an in-breeding lineage. This can elevate the type I error rate, increasing the likelihood of ‘‘significant’’ nonlinearity even when there is no epistasis. The family structure of the present experiment is fully accounted inReplicated joint scaling test, but not inCombined population analysis. However, the nonlinearity apparent for log-transformed male fitness measures (Table 2, Figure 2B) is not a statistical artifact. Seventy-three line-cross families pro-duced at least one plant that was fully outbred (f¼0), inbred to an intermediate level (f ¼ 0.5), and fully inbred (f¼1). We can distill each of these families into a pair of values:D1is the difference in mean trait value between plants with f ¼ 0 and f ¼ 0.5 and D2 is the difference between mean values for plants withf¼0.5 andf¼1. If the true relationship between trait values and inbreeding coefficient is linear, we expect thatD1 will be.D2in about half of the families. With synergistic epistasis,D2should be.D1in most line-cross families. For Ln[PSI] in this study, 52 of 73 cross families ex-hibited a greater decline at higher inbreeding coeffi-cients (D2.D1). For Ln[viable pollen],D2.D1in 48 of 73 families. Both trends are statistically significant (Wilcoxon sign rank test,P,0.01).
Synergism in monkeyflowers: The response of M.
guttatusto inbreeding has been investigated extensively (Willis 1993a,b, 1996, 1999a,b; Carr and Dudash 1995, 1996, 1997; Carret al.1997; Dudash and Carr 1998; Kellyand Willis2001; Carrand Eubanks2002; Carret al.2003). Willis(1993a) and Carrand Dudash (1997) measured fitness-related characters of plants with a range of inbreeding coefficients and their results are thus comparable to those in Table 2. Carr and Dudash (1997) generated plants of six different in-breeding levels (f¼0, 0.5, 0.75, 0.875, 0.938, and 0.969) from two California populations, ‘‘S’’ and ‘‘T.’’ They esti-mated the relationship between inbreeding coefficient and mean trait values to be approximately linear for female fitness measures in both populations. However, male fitness in population T exhibited an accelerating decline withf, a result consistent with synergistic epis-tasis. Their measure of male fitness is most directly comparable to viable pollen of this study.
Willis(1993a) synthesized plants with four levels of inbreeding (f¼0, 0.25, 0.5, and 0.75) from two Oregon populations, ‘‘Cone Peak’’ and the Iron Mountain pop-ulation that I consider here. Pollen viability exhibited synergistic epistasis for the Cone Peak population, but the relationship withf was not significantly nonlinear for the Iron Mountain plants. In contrast, the present
study of Iron Mountain provides compelling evidence for synergism in log-transformed values of both pollen viability (as estimated by PSI) and total viable pollen (Figure 2B). The difference may simply reflect statistical power. Willis(1993a) did note a nonsignificant trend toward synergism in his study (see Figure 1f of that article) and the present study of Iron Mountain consid-ers a larger range of inbreeding coefficients with 10 times as many plants.
Perhaps the simplest explicit genetic model that yields synergism is complementary gene action (Brookfield 1997). Consider two loci involved in pollen production. Each locus has recessive mutations that reduce pollen viability. If the two loci are complementary (functional duplicates in the extreme case), pollen viability is sig-nificantly reduced only in individuals that are homozy-gous for mutant alleles at both loci. Loss or reduction of function at only one locus is effectively compensated by full function of the complementary locus. This mode of action has been demonstrated for some chlorophyll deficiency mutations inM. guttatus(Willis1992). More generally, the high levels of genetic redundancy apparent in the Arabidopsis genome suggest that complementary gene action may not be uncommon.
Variable epistatic effects:Flower traits, development
time, and pollen number did not exhibit nonlinear re-sponses to inbreeding. However, all yielded highly sig-nificant evidence of epistasis in the replicated joint scaling tests (Figure 3, Table 4). Moreover, the results from each character remained significant even after a full series of scale transformations (Table 6), which indicates gene interactions are not scalar in nature. This difference in outcomes between the two analyses sug-gests that epistatic interactions may be variable across the loci influencing these traits (see, for example, de Visseret al. 1997). Certain pairs of loci may interact strongly and others may act more or less independently. However, it would be premature to conclude that these data are inconsistent with more complicated models of directional epistasis (e.g., Rice1998, 2000; Hansenand Wagner2001)only on the basis of Table 6.
Scale transformations could often eliminate signifi-cant deviations between observed and expected values within individual line-cross families. For example, cub-ing values for corolla width reduces chi square for line-cross family 6 from 15.5 to 9.7, which is not significant given 5 d.f. (see Figure 3, top left). Unfortunately, the same transformation exaggerates deviations in other families such that the cumulative chi square actually increases. This result is reminiscent of Powers’ studies of tomato fruit characters, in which transformations useful in some crosses (yielding approximate additivity) were detrimental in others (Powers1950, 1951).
P2 are very different would yield higher chi-square values than line-cross families constituted from pheno-typically similar lines. This prediction may also follow from the idea that the nonepistatic model is a ‘‘linear approximation’’ of the nonlinear mapping from geno-type to phenogeno-type. Linear approximations are generally taken around a specific point on the phenotypic axis and are most accurate close to that point. It is thus noteworthy that, in contrast to these expectations, I failed to find any relationship between the level of phe-notypic differentiation of parental lines and the strength of evidence for epistasis.
Maternal effects: In both plants and animals, an
organism’s phenotype is often substantially influenced by the characteristics of its mother. Seed provisioning, in terms of both nutrients and genetic instruction (mRNAs), is a likely avenue for maternal effects in plants. Since inbreeding clearly influences individual traits, it is reasonable to expect that it will also affect the quality of maternal effects. In fact, this has been clearly demonstrated in both animals (White1972) and plants (Melchingeret al.1986; Vogleret al.1999).
Surprisingly, I found little evidence of maternal in-breeding effects in this study, despite both large sample sizes and strong comparisons (Table 2). The latter refers to line-cross derivatives synthesized by reciprocal crosses between parents with substantially different inbreeding coefficients (BC1, BC2, and BCX). Which parent served
as mother seemed to have minimal effects on most traits. Only days to flower exhibited a significant effect. All else being equal, plants with fully inbred mothers produced their first flower an average of 0.25 days later than plants with outbred mothers.
Maternal effects may be significant but unrelated to level of inbreeding or at least only weakly related. For this reason, the plants derived from a single cross (a full-sib family) may exhibit a consistent deviation from the expected value of their line-cross derivative even with-out epistasis. These deviations average with-out if each line-cross derivative is synthesized from a substantial number of distinct crosses (e.g., Jinksand Perkins1969). How-ever, with a limited number of crosses per derivative, maternal effects must be accounted statistically to dis-tinguish them from epistasis. The sequel to this article develops the theory necessary for a more rigorous treat-ment of the data, on the basis of not only the means of line-cross derivatives but also patterns of variability within and between derivatives ( J. K. Kelly, unpub-lished results). A maximum-likelihood-based applica-tion of this theory to the present data set confirms that both maternal effects and epistasis contribute to devia-tions between observed and expected line-cross means. However, epistasis remains the primary cause.
Evolutionary implications:The purpose of this study
was to determine if gene interactions influence charac-ters of M. guttatus, and if they do, to investigate the nature of these interactions. Regarding the first part,
there does seem to be significant epistasis affecting development time, floral morphology, and male fitness components. Male fitness involves synergism, a ten-dency for alleles at different loci that reduce pollen viability to have greater effects when combined than in isolation (Figure 2B). Synergism among deleterious mu-tations is a central tenet of the mutational deterministic hypothesis for the evolutionary maintenance of sexual reproduction (Charlesworth1990; Kondrashov1993). Synergistic interactions can substantially reduce the mutational load in a sexual population, but not in an asexual population (Kimura and Maruyama 1966). This, combined with a sufficiently high rate of deleteri-ous mutation, can allow sexual genotypes to outcompete asexual genotypes in the face of the twofold cost of sex.
Despite the results of Figure 2B, support for the mu-tational deterministic model fromM. guttatus remains equivocal. First, the quantitative relationship between viable pollen per flower (as measured here) and evolu-tionary fitness in the wild has yet to be determined empirically. Synergism between mutations affecting the latter is necessary for the model. Second, estimates for the genomic deleterious mutation rate in M. guttatus fall largely within the range 0.1–1.0 (Willis 1999a; Kelly2003). These estimates are somewhat lower than what is thought necessary to favor sex and, for a variety of reasons, are more likely to be overestimates than underestimates.
Flower morphology and development time yielded negative results in the combined population analysis, but positive evidence of epistasis in the replicated joint scaling test. Such a difference is expected if epistatic ef-fects are variable across genetic backgrounds or sets of interacting loci. Similar results have been obtained in measured genotype studies (deVisseret al.1997; Elena and Lenski1997). These findings are intriguing in light of theoretical studies exploring the implications of var-iable interactions among loci (Phillipset al 2000). To con-sider an example noted previously, consistent synergistic epistasis among deleterious mutations can favor in-creased rates of recombination (Charlesworth1990; Barton1995). If interactions are variable, however, mod-ifiers that reduce the rate of recombination may actually be favored (Ottoand Feldman1997).
quantities can be estimated from the resemblance of relatives, independent of the observed response to selection.
The breeder’s equation, and its multitrait generaliza-tion, is one of the most important predictive models in evolutionary biology (Grantand Grant1995) and it is worth considering whether it fails when there is epista-sis. This can be directly evaluated for corolla width ofM. guttatus, one of the traits shown to exhibit epistasis here (Table 4). We have estimated the heritability of this character for the Iron Mountain population (Kellyand Arathi2003) and, in other experiments, have imposed selection on corolla diameter (e.g., Kellyand Willis 2001). In the largest of these studies, bidirectional trun-cation selection was imposed for seven generations. The observed divergence between the means of high- and low-selected populations (5.2 phenotypic standard de-viations) differs from the prediction of the breeder’s equation by,6% ( J. K. Kelly, unpublished results). Given the myriad of factors other than epistasis that can generate deviations, one has to conclude that the model performs quite well.
These results fromM. guttatusare complementary to those from previous studies. Clayton et al. (1957) demonstrated the accuracy of the breeder’s equation in predicting short-term evolution of bristle number in Drosophila melanogaster. While this trait was often cited as an example of additive inheritance, mapping studies have recently demonstrated that variation is substan-tially influenced by interactions among QTL (Long et al. 1995, 1996; Mackay 2001). Two complementary conclusions emerge from these selection experiments. First, short-term responses to selection that are consis-tent with the additive/dominance model (breeder’s equation) do not imply the absence of epistasis in the se-lected traits. Second, the existence of epistasis does not necessarily invalidate conclusions derived from simpler, nonepistatic models.
It seems likely that the additive genetic variance is itself a function of genetic interactions among QTL. In fact, theorists have begun to explore the interaction of epistasis, mutation, and natural selection in determin-ing the genetic architecture of quantitative characters (e.g., Hermissonet al.2003). Experimentalists will con-tinue to identify and describe particular gene interac-tions, at least in model species (Templeton 2000). At present, there is a substantial gap between theory and experiment. I suggest that this is due, at least in part, to the absence of meaningful statistics, measurable quan-tities with clear relevance to evolutionary questions. Iden-tifying such statistics, if they do exist, should facilitate the synthesis of theory and experiment.
I thank T. Marriage, J. Gleason, L. Holeski, M. Orive, D. Houle, and two anonymous reviewers for comments on this manuscript. Kim Milne, L. Holeski, B. Harris, R. How, J. Schaller, D. Deole, L. Richman, H. Nelson, and S. Jablonski each helped to complete the enormous volume of crossing and plant measurements.
LITERATURE CITED
Anderson, V. L., and O. Kempthorne, 1954 A model for the study of quantitative inheritance. Genetics30:883–898.
Arathi, H. S., A. Rasch, C. Coxand J. K. Kelly, 2002 Autogamy and floral longevity in Mimulus guttatus. Int. J. Plant Sci.163:
567–573.
Barker, J. S. F., 1974 The state of information concerning devia-tions from additivity of gene effects. Proceedings of the 1st World Congress on Genetics Applied to Livestock Production, Madrid, Vol. 1, pp. 373–383.
Barker, J. S. F., 1979 Inter-locus interactions: a review of experimen-tal evidence. Theor. Popul. Biol.16:323–346.
Barton, N. H., 1995 A general model for the evolution of recom-bination. Genet. Res.65:123–144.
Box, G. E., and D. R. Cox, 1964 An analysis of transformations. J. R. Stat. Soc. B26:211–252.
Brookfield, J. F. Y., 1997 Genetic redundancy. Adv. Genet. 36: 137–155.
Burton, R. S., 1990 Hybrid breakdown in development time in the copepod Tigriopus californicus. Evolution44:1814–1822. Burton, R. S., P. D. Rawsonand S. Edmands, 1999 Genetic
archi-tecture of physiological phenotypes: empirical evidence for co-adapted gene complexes. Am. Zool.39:451–462.
Cabot, E. L., A. W. Davis, N. A. Johnsonand C. I. Wu, 1994 Ge-netics of reproductive isolation in the Drosophila simulans clade: complex epistasis underlying hybrid male sterility. Genetics137:
175–189.
Carr, D. E., and M. R. Dudash, 1995 Inbreeding depression under a competitive regime in Mimulus guttatus: consequences for po-tential male and female function. Heredity75:437–445. Carr, D. E., and M. R. Dudash, 1996 Inbreeding depression in two
species of Mimulus (Scrophulariaceae) with contrasting mating systems. Am. J. Bot.83:586–593.
Carr, D. E., and M. R. Dudash, 1997 The effects of five generations of enforced selfing on potential male and female function in Mimulus guttatus. Evolution51:1797–1807.
Carr, D. E., and M. D. Eubanks, 2002 Inbreeding alters resistance to insect herbivory and host plant quality in Mimulus guttatus (Scrophulariaceae). Evolution56:22–30.
Carr, D. E., and C. B. Fenster, 1994 Levels of genetic variation and covariation for Mimulus (Scrophulariaceae) floral traits. Heredity
72:606–618.
Carr, D. E., C. B. Fensterand M. R. Dudash, 1997 The relation-ship between mating-system characters and inbreeding depres-sion in Mimulus guttatus. Evolution51:363–372.
Carr, D. E., J. F. Murphyand M. D. Eubanks, 2003 The suscepti-bility and response of inbred and outbred Mimulus guttatus to infection by Cucumber mosaic virus. Evol. Ecol.17:85–103. Charlesworth, B., 1990 Mutation-selection balance and the
evolu-tionary advantage of sex and recombination. Genet. Res. 55:
199–221.
Charlesworth, B., M. T. Morganand D. Charlesworth, 1991 Mul-tilocus models of inbreeding depression with synergistic selec-tion and partial self-fertilizaselec-tion. Genet. Res.57:177–194. Clark, A. G., and L. Wang, 1997 Epistasis in measured genotypes:
DrosophilaP-element insertions. Genetics147:157–163. Clayton, G. A., J. A. Morrisand A. Robertson, 1957 An
experi-mental check on quantitative genetic theory. I. Short term re-sponses to selection. J. Genet.5:131–151.
Coyne, J. A., N. H. Bartonand M. Turelli, 1997 Perspective: a critique of Sewall Wright’s shifting balance theory of evolution. Evolution51:643–671.
Crow, J. F., and M. Kimura, 1970 An Introduction to Population Genet-ics Theory.Harper & Row, New York.
de Visser, J. A. G. M., R. F. Hoekstra and H. van den Ende,
1997 Test of interaction between genetic markers that affect fitness in Aspergillus niger. Evolution51:1499–1505.
Dobzhansky, T. H., 1936 Studies on hybrid sterility. II. Localization of sterility factors in Drosophila pseudoobscura hybrids. Genetics
21:113–135.
Doebley, J., A. Stecand C. Gustus, 1995 teosinte branched1and the origin of maize: evidence for epistasis and the evolution of dom-inance. Genetics141:333–346.
Dole, J. A., and K. Ritland, 1993 Inbreeding depression in 2 Mimulus taxa measured by multigenerational changes in the in-breeding coefficient. Evolution47:361–373.
Dudash, M. R., and D. E. Carr, 1998 Genetics underlying inbreed-ing depression in Mimulus with contrastinbreed-ing matinbreed-ing systems. Nature393:682–684.
Dudash, M. R., and K. Ritland, 1991 Multiple paternity and self-fertilization in relation to floral age in Mimulus guttatus (Scrophulariaceae). Am. J. Bot.78:1746–1753.
Elena, S. F., and R. E. Lenski, 1997 Test of synergistic interactions among deleterious mutations in bacteria. Nature390:395–398. Erickson, D. L., C. B. Fenster, H. K. Stenoien and D. Price, 2004 Quantitative trait locus analyses and the study of evolu-tionary process. Mol. Ecol.13:2505–2522.
Falconer, D. S., and T. F. C. Mackay, 1996 Introduction to Quantita-tive Genetics.Prentice Hall, London.
Fenster, C. B., and L. F. Galloway, 2000 Population differentia-tion in an annual legume: genetic architecture. Evoludifferentia-tion54:
1157–1172.
Fenster, C. B., and K. Ritland, 1992 Chloroplast Dna and isozyme diversity in 2 Mimulus species (Scrophulariaceae) with contrast-ing matcontrast-ing systems. Am. J. Bot.79:1440–1447.
Fenster, C. B., and K. Ritland, 1994a Evidence for natural-selection on mating system in Mimulus (Scrophulariaceae). Int. J. Plant Sci.
155:588–596.
Fenster, C. B., and K. Ritland, 1994b Quantitative genetics of mat-ing system divergence in the yellow monkeyflower species com-plex. Heredity73:422–435.
Fenster, C. B., L. F. Gallowayand L. Chao, 1997 Epistasis and its consequences for the evolution of natural populations. Trends Ecol. Evol.12:282–286.
Fisher, R. A., 1958 The Genetical Theory of Natural Selection.Dover, New York.
Fishman, L., and J. Willis, 2001 Evidence for Dobzhansky-Muller incompatibilites contributing to the sterility of hybrids between Mimulus guttatus and M. nasutus. Evolution55:1932–1942. Ford, E. B., 1971 Ecological Genetics.Chapman & Hall, London. Goodnight, C. J., 1988 Epistasis and the effect of founder events on
the additive genetic variance. Evolution42:441–454.
Grant, A. L., 1924 A monograph of the genus Mimulus. Ann. Mo. Bot. Gard.11:99–398.
Grant, P. R., and B. R. Grant, 1995 Predicting microevolutionary responses to directional selection on heritable variation. Evolu-tion49:241–251.
Grant, V., 1975 Genetics of Flowering Plants.Cambridge University Press, New York.
Hallauer, A. R., and J. H. Sears, 1973 Changes in quantitative traits associated with inbreeding in a synthetic variety of maize. Crop Sci.13:327–330.
Hansen, T. F., and G. Wagner, 2001 Modeling genetic architecture: a multilinear theory of gene interaction. Theor. Popul. Biol.59:61–86. Hard, J. J., W. E. Bradshawand C. M. Holzapfel, 1992 Epistasis and the genetic divergence of photoperiodism between popula-tions of the pitcher-plant mosquito,Wyeomyia smithii.Genetics
131:389–396.
Hayman, B. I., 1960 The separation of epistatic from additive and dominance variation in generation means. Genetica31:371–390. Hermisson, J., T. F. Hansenand G. P. Wagner, 2003 Epistasis in polygenic traits and the evolution of genetic architecture under stabilizing selection. Am. Nat.161:708–734.
Husband, B. C., and S. C. H. Barrett, 1992a Effective population size and genetic drift in tristylous Eichornia paniculata (Ponte-deriaceae). Evolution46:1875–1890.
Husband, B. C., and S. C. H. Barrett, 1992b Genetic drift and the maintenance of the style length polymorphism in tristylous pop-ulations of Eichornia paniculata (Pontederiaceae). Heredity69:
440–449.
Jinks, J. L., and J. M. Perkins, 1969 The detection of linked epistatic genes for a metrical trait. Heredity24:465–475.
Johnson, N. A., 2000 Gene interactions and the origin of species, pp. 197–212 inEpistasis and the Evolutionary Process, edited by J. B. Wolf, E. D. Brodieand M. J. Wade. Oxford University Press, New York.
Kelly, A. J., and J. H. Willis, 1998 Polymorphic microsatellite loci in Mimulus guttatus and related species. Mol. Ecol.7:769–774.
Kelly, J. K., 2003 Deleterious mutations and the genetic variance of male fitness components in Mimulus guttatus. Genetics 164:
1071–1085.
Kelly, J. K., and H. S. Arathi, 2003 Inbreeding and the genetic var-iance of floral traits in Mimulus guttatus. Heredity90:77–83. Kelly, J. K., and J. H. Willis, 2001 Deleterious mutations and
ge-netic variation for flower size in Mimulus guttatus. Evolution55:
937–942.
Kelly, J. K., and J. H. Willis, 2002 A manipulative experiment to estimate bi-parental inbreeding in monkeyflowers. Int. J. Plant Sci.163:575–579.
Kelly, J. K., A. Raschand S. Kalisz, 2002 A method to estimate pol-len viability from polpol-len size variation. Am. J. Bot.89:1021–1023. Kempthorne, O., 1957 An Introduction to Genetic Statistics. Wiley,
New York.
Kiang, Y. T., 1972 Pollination study in a natural population of Mimulus guttatus. Evolution26:308–310.
Kiang, Y. T., 1973 Floral structure, hybridization and evolutionary relationships of two species of Mimulus. Rhodora75:225–238. Kimura, M., and T. Maruyama, 1966 The mutation load with
epi-static gene interactions in fitness. Genetics54:1337–1351. Kondrashov, A. S., 1985 Deleterious mutations as an evolutionary
factor. 2. Facultative apomixis and selfing. Genetics111:635–653. Kondrashov, A. S., 1988 Deleterious mutations and the evolution
of sexual reproduction. Nature336:435–440.
Kondrashov, A. S., 1993 Classification of hypotheses on the advan-tage of amphimixis. J. Hered.84:372–387.
Lande, R., and S. Arnold, 1983 The measurement of selection on correlated characters. Evolution37:1210–1226.
Leclerc-Potvin, C., and K. Ritland, 1994 Modes of self-fertilization in Mimulus-guttatus (Scrophulariaceae)—a field experiment. Am. J. Bot.81:199–205.
Long, A. D., S. L. Mullaney, L. A. Reid, J. D. Fry, C. H. Langley et al., 1995 High-resolution mapping of genetic factors affecting abdominal bristle number in Drosophila melanogaster. Genetics
139:1273–1291.
Long, A. D., S. L. Mullaney, T. F. C. Mackayand C. H. Langley, 1996 Genetic interactions between naturally occurring alleles at quantitative trait loci and mutant alleles at candidate loci affecting bristle number inDrosophila melanogaster.Genetics144:1497–1510. Lukens, L. N., and J. Doebley, 1999 Epistatic and environmental interactions for quantitative trait loci in maize evolution. Genet. Res.74:291–302.
Lush, J. L., 1937 Animal Breeding Plans.Iowa State Press, Ames, IA. Lynch, M., 1988 Design and analysis of experiments on random
drift and inbreeding depression. Genetics120:791–807. Lynch, M., and B. Walsh, 1998 Genetics and Analysis of Quantitative
Characters.Sinauer Associates, Sunderland, MA.
Mackay, T. F. C., 2001 The genetic architecture of quantitative traits. Annu. Rev. Genet.35:303–339.
Macnair, M. R., and Q. J. Cumbes, 1989 The genetic architecture of interspecific variation in Mimulus. Genetics122:211–222. Mallet, J., and M. C. Singer, 1987 Individual selection, kin
selec-tion and the shifting balance in the evoluselec-tion of warning colours in butterflies. Biol. J. Linn. Soc.32:337–350.
Mather, K., 1949 Biometrical Genetics.Methuen, London. Mather, K., and J. L. Jinks, 1982 Biometrical Genetics.Chapman &
Hall, New York.
Melchinger, A. E., H. H. Geigerand F. W. Schnell, 1986 Epistasis in maize (Zea mays L.) 2. Genetic effects in crosses among early flint and dent lines determined by three methods. Theor. Appl. Genet.72:231–239.
Miller, R. H., J. E. Legatesand C. C. Cockerham, 1963 Estimation of nonadditive hereditary variance in traits of mice. Genetics48:
177–188.
Moll, R. H., J. H. Longquist, J. V. Fortunoand E. C. Johnson, 1965 The relationship of heterosis and genetic divergence in maize. Genetics52:139–144.
Muller, H. J., 1939 Reversibility in evolution considered from the standpoint of genetics. Biol. Rev.14:185–268.
Orr, H. A., 1995 The population genetics of speciation: the evolu-tion of hybrid incompatibilities. Genetics139:1805–1813. Otto, S. P., and M. W. Feldman, 1997 Deleterious mutations,