Review of various Image Processing
Techniques
J.Anish Jafrin Thilak1, Dr.P.Suresh2, N.Subramani3, S.Sathishkumar4, V.V.Arunsankar5
Assistant Professor, Department of Mechanical Engineering, Karpagam College of Engineering,
Coimbatore, India1,3,4&5
Professor, Department of Mechanical Engineering, Karpagam College of Engineering, Coimbatore, India2
ABSTRACT: The neck can be vulnerable to injury and disorders that produce pain and restrict motion. It may result from abnormalities in the soft tissues the muscles, ligaments, and nerves as well as in bones and joints of the spine. The most common causes of neck pain are soft-tissue abnormalities due to injury or prolonged wear and tear. In rare instances, infection or tumours may cause neck pain. Neck pain may feel like a "kink," stiffness, or severe pain. Pain may spread to the shoulders, upper back, or arms, or it may cause a headache. Neck movement may be limited, usually more to one side than the other. Neck pain refers to pain anywhere from the area at the base of the skull into the shoulder. It is rare to predict the causes during movement of the neck. In this paper proposes a various edge detection techniques like prewitt, sobel, canny and Roberts edge detection methods to compare and analyse the two dimensional CCD camera neck disc image. This analysis will be more helpful to predict the suitable technique for edge detection. This work may be extended to predict the analyse of the neck while driving the car and also software industries employees with continuos exposure with VDT.
KEYWORDS: CT Scan, Neck disc image, Sobel, canny, prewitt and Roberts.
I. INTRODUCTION
Manual Material Handling (MMH), especially lifting, poses a risk to many and considered the prime cause of back pain and various other joint impairments. This in turn leads to increased worker compensation and loss of productive man-hours. Approximately one third of all jobs in industry involve MMH. Low back pain is one of the most prevalent and costly work related injuries. The study of the lifting posture, the amounts of weight the man can safely lift are the areas concentrated on by Researchers.Of all Manual Material Handling (MMH) activities, lifting is considered to be a major cause for neck pain, low back pain and spinal injuries. Medical image processing is a field of science due to its advances technology and software breakthroughs. It plays a vital role in disease diagnosis and improved in medical area with patient care and helps medical practitioners to make decision in regard to the type of treatment. Various state-of-the-art equipments are available for human organs in digital form. Examples of such devices include X-Ray-based devices, Computed Tomography (CT), Magnetic Resonance Imaging (MRI), Ultrasound (US), Positron Emission Tomography (PET) and Single Photon Emission Computed Tomography (SPECT). In which, X-Ray is one the oldest and frequently used devices, as they are non-invasive, painless and economical. A x-ray makes images. Of any bone in the body, including the hand, wrist, arm, elbow, shoulder, foot, ankle, leg, knee, thigh, hip, pelvis or spine. Most cervical problems are due to degenerative changes that occur in the discs and joints of the neck.
II. EDGE DETECTION TECHNIQUES
applied only Prewitt operator, Sobel operator and Prewitt operator approach. These techniques will follow the edge based technique.
A. SOBEL OPERATOR: This technique performs 2D spatial gradient measurement on an image and also it emphasizes regions of high spatial frequency that correspond to edges. Typically it is used to find the approximate absolute gradient magnitude at each point in an input grayscale image. In theory at least, the operator consists of a pair of 3x3 convolution masks as shown in figure. One mask is simply the other rotated by 90o. This is very similar to the Roberts cross operator. These masks are designed to respond maximally to edges running vertically and horizontally relative to the pixel grid, one mask for each of the two perpendicular orientations. The masks can be applied separately to the input image, to produce separate measurements of the gradient component in each orientation that is Gx and Gy.
These can be combined together to find the absolute magnitude of the gradient at each point and the orientation of that gradient. The gradient magnitude is given below in Figure 6.
(1)
-1 0 1 1 2 1
-2 0 2 0 0 0
-1 0 1 -1 -2 -1
Gx Gy
Fig.6. Gradient Magnitude
Although typically, an approximate magnitude is computed using:
│G│=│Gx│+ │Gy│ (2)
Which is much faster to compute. The angle of orientation of the edge (relative to the pixel grid) giving rise to the spatial gradient is given by:
α = arctan(Gy/Gx) - 3π/4 (3)
In this case, orientation 0 is taken to mean that the direction of maximum contrast from black to white runs from left to right on the image, and other angles are measured anti-clockwise from this. Often, this absolute magnitude is the only output the user sees the two components of the gradient are conveniently computed and added in a single pass over the input image using the pseudo convolution operator shown in Figure 7.
H1 H2 H3
H4 H5 H6
H7 H8 H9
Fig.7. Pseudo convolution
Using this mask the approximate magnitude is given by:
│G│=│(H1+2xH2+H3)–(H7+2xH8+H9)│+
│(H3+2x H8+H9)–(H1+2xH4+H7)│ (4)
The Sobel operator is slower to compute than the Roberts cross operator, but its larger convolution mask smooth’s the input image to a greater extend and so makes the operator less sensitive to noise. The problem can be avoided by using an image type that supports pixel values with a larger range.
horizontal edge component is calculated with kernel Gy. │Gx│+ │Gy│ give an indication of the intensity of the
gradient in the current pixel. The Gradient magnitude is shown in Figure 8.
-1 0 1 1 1 1
-1 0 1 0 0 0
-1 0 1 -1 -1 -1
Gx Gy
Fig.8. Gradient Magnitude
) - ) (5)
) - ) (6)
C. ROBERTS OPERATOR: This technique performs 2D spatial gradient measurement on an image and highlights regions of high spatial frequency which often correspond to edges. It performs a simple, quick to compute of an image. It thus highlights regions of high spatial gradient which often correspond to edges. In its most common usage, the input to the operator is a grayscale image, as is the output. Pixel values at each point in the output represent the estimated absolute magnitude of the spatial gradient of the input image at that point. In theory, the operator consists of a pair of 2x2 convolution masks as shown in Figure. One mask is simply the other rotated by 90o. This is very similar to the Sobel operator. The gradient magnitude of the Roberts operator is shown in Figure 9.
1 0 0 1
0 -1 -1 0
Gx Gy
Fig.9. Gradient Magnitude
These masks are designed to respond maximally to edges running at 45o to the pixel grid, one mask for each of the two perpendicular orientations. The masks can be applied separately to the input image, to produce separate measurements of the gradient component in each orientation (call these Gx and Gy). These can then be combined together to find the
absolute magnitude of the gradient at each point and the orientation of that gradient. The gradient magnitude is given by:
│G│=│Gx│+ │Gy│ (7)
Often, the absolute magnitude is the only output the user sees the two components of the gradient are conveniently computed and added in a single pass over the input image using pseudo convolution operator shown in Figure 10.
H1 H2
H3 H4
Fig.10. Pseudo convolution
Using this mask the approximate magnitude is given by:
│G│=│H1-H4│+│H2-H3│ (8)
(9)
D. CANNY EDGE DETECTION ALGORITHM
The Canny algorithm can be used an optimal edge detector based on a set of criteria which include finding the most edges by minimizing the error rate, marking edges as closely as possible to the actual edges to maximize localization, and marking edges only once when a single edge exists for minimal response. According to Canny, the optimal filter that meets all three criteria above can be efficiently approximated using the first derivative of a Gaussian function.
(1)
(2)
All the images are having some speckle and other noises. So there is a need of noise filtering using any techniques. In this work median filter is used to reduce the noise. If the scan box is approximately centered with knee, the median filter is shown below.
(3)
Where, the speckle noise reduction can be done using the below expression
(4)
A. PRE-PROCESSING OF INITIAL POSITION OF EDGE PARAMETERS DETECTION
Step 1: Calculate the average magnitude
(5)
Step 2: Calculate the density of the edge length. The density of the edge length is calculated from
(6)
Where C(i,j) is the number of connected pixels at each position of pixel.
Step 3: Calculate the Initial position of map from summation of density of edge Length and average magnitude.
(7)
Step 4: Calculate the thresholding of the initial position map. If
(8)
Then P(1, 2) is the initial position of the edge following. And then we obtained the initial position by setting Tmax to
III. RESULTS AND DISCUSSION
Fig.3. (a). CT scan Noisy Knee image (b). Average Magnitude Image (c). Density of the Edge Length
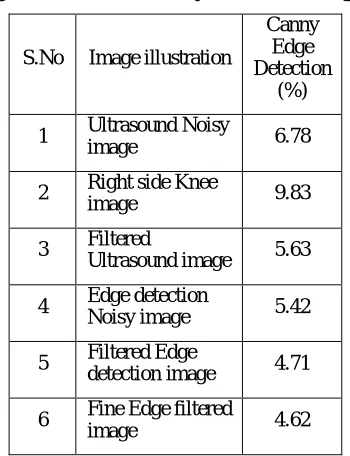
Table 1. Average Results of Probability of Error in Image Segmentation
S.No Image illustration
Canny Edge Detection
(%)
1 Ultrasound Noisy
image 6.78
2 Right side Knee
image 9.83
3 Filtered
Ultrasound image 5.63
4 Edge detection Noisy image 5.42
5 Filtered Edge
detection image 4.71
6 Fine Edge filtered
image 4.62
The best and optimum detector type can be evaluated by calculating the edge maps relative to each other through statistical evaluation. Upon this evaluation, an edge detection method can also be emphasised to characterize edges to represent the image for further analysis. The statistical analysis of results is shown in Table. 2 and the valediction of results using existing method is shown in table 3.
IV. CONCLUSION
the object boundaries in medical images. The proposed method can be applied not only for medical imaging, but can also be applied to any image processing problems.
REFERENCES
1. E. Argyle. “Techniques for edge detection,” Proc. IEEE, vol. 59, pp. 285-286, 1971.
2. F. Bergholm. “Edge focusing,” in Proc. 8th Int. Conf. Pattern Recognition, Paris, France, pp. 597- 600, 1986. 3. J. Matthews. “An introduction to edge detection: The sobel edge detector,” Available at
http://www.generation5.org/content/2002/im01.asp, 2002.
4. L. G. Roberts. “Machine perception of 3-D solids” ser. Optical and Electro-Optical Information Processing. MIT Press, 1965 . 5. R. C. Gonzalez and R. E. Woods. “Digital Image Processing”. 2nd ed. Prentice Hall, 2002.
6. V. Torre and T. A. Poggio. “On edge detection”. IEEE Trans. Pattern Anal. Machine Intell., vol. PAMI-8, no. 2, pp. 187-163, Mar. 1986. 7. E. R. Davies. “Constraints on the design of template masks for edge detection”. Partern Recognition Lett., vol. 4, pp. 11 1-120, Apr. 1986. 8. W. Frei and C.-C. Chen. “Fast boundary detection: A generalization and a new algorithm ”. lEEE Trans. Comput., vol. C-26, no. 10, pp.
988-998, 1977.
9. W. E. Grimson and E. C. Hildreth. “Comments on Digital step edges from zero crossings of second directional derivatives’’. IEEE Trans. Pattern Anal. Machine Intell., vol. PAMI-7, no. 1, pp. 121-129, 1985.
10. R. M. Haralick. “Digital step edges from zero crossing of the second directional derivatives,” IEEE Trans. Pattern Anal. Machine Intell., vol. PAMI-6, no. 1, pp. 58-68, Jan. 1984.
11. J. F. Canny. “A computational approach to edge detection”. IEEE Trans. Pattern Anal. Machine Intell., vol. PAMI-8, no. 6, pp. 679-697, 1986 12 J. Canny. “Finding edges and lines in image”. Master’s thesis, MIT, 1983.
13. R. A. Kirsch. “Computer determination of the constituent structure of biomedical images”. Comput. Eiorned. Res., vol. 4, pp. 315-328, 1971. 14. M. H. Hueckel. “ A local visual operator which recognizes edges and line”. J. ACM, vol. 20, no. 4, pp. 634-647, Oct. 1973.
15. Y. Yakimovsky, “Boundary and object detection in real world images”. JACM, vol. 23, no. 4, pp. 598-619, Oct. 1976
16. A. Yuille and T. A. Poggio . “Scaling theorems for zero crossings”. IEEE Trans. Pattern Anal. Machine Intell., vol. PAMI-8, no. 1, pp. 187-163, Jan. 1986.
17. D. Marr and E.Hildreth. “Theory of Edge Detection”. Proceedings of the Royal Society of London. Series B, Biological Sciences,, Vol. 207, No. 1167. (29 February 1980), pp. 187-217
18. M. Heath, S. Sarkar, T. Sanocki, and K.W. Bowyer. “A Robust Visual Method for Assessing the Relative.Performance of Edge Detection Algorithms”. IEEE Trans. Pattern Analysis and Machine Intelligence, vol.19,no. 12, pp. 1338-1359, Dec. 1997.
19. M. Heath, S. Sarkar, T. Sanocki, and K.W. Bowyer. “Comparison of Edge Detectors: A Methodology and Initial Study “. Computer Vision and Image Understanding, vol. 69, no. 1, pp. 38-54 Jan. 1998
20. M.C. Shin, D. Goldgof, and K.W. Bowyer. “Comparison of Edge Detector Performance through Use in an Object Recognition Task”. Computer Vision and Image Understanding, vol. 84, no. 1, pp. 160-178, Oct. 2001.
21. T. Peli and D. Malah. “A Study of Edge Detection Algorithms”. Computer Graphics and Image Processing, vol. 20, pp. 1-21, 1982. 22. H.Chidiac, D.Ziou, “Classification of Image Edges”,Vision Interface’99, Troise-Rivieres, Canada, 1999.pp. 17-24.
23. Q.Ji, R.M.Haralick, “Quantitative Evaluation of Edge Detectors using the Minimum Kernel Variance Criterion”, ICIP 99. IEEE International Conference on Image Processing volume: 2, 1999, pp.705-709.
24. Albovik,“Handbook of Image and Video Processing”, Academic Press, 2000.