forest ecology
Patterns of Forest Phylogenetic Community Structure
across the United States and Their Possible Forest
Health Implications
Kevin M. Potter and Frank H. Koch
The analysis of phylogenetic relationships among co-occurring tree species offers insights into the ecological organization of forest communities from an evolutionary perspective and, when employed regionally across thousands of plots, can assist in forest health assessment. Phylogenetic clustering of species, when species are more closely related than expected by chance, suggests a process of evolutionary niche conservatism. Because such communities share much evolutionary history and an affinity for similar environmental conditions, they may be particularly susceptible to threats such as insects and diseases and shifting climate conditions. Meanwhile, a pattern of phylogenetic evenness, in which the species are less closely related than by chance, may indicate competitive exclusion or interspecies facilitation. The ecological integrity of such communities may be less at risk because they may encompass a wider variety of evolutionary adaptations. Using a network of more than 100,000 forest inventory plots across the conterminous United States, we tested whether community phylogenetic structure was significantly clustered or even at multiple scales. Clustering predominated across most of the study area, indicating the widespread significance of evolutionary niche conservatism, except in areas of the west. Phylogenetic structure varied along environmental gradients, suggesting that clustering predominates in more favorable locations and evenness predominates in areas with harsher environments. These results have implications for broad-scale forest health monitoring.
Keywords: evolutionary ecology, forest community, forest ecology, forest health assessment, landscape ecology
R
ecent broad-scale forest health assessments have incorpo-rated measurements of the evolutionary relationships among tree species within forested communities of the United States. Specifically, such relationships are associated with biomass accumulation in some circumstances (Potter and Woodall 2014), whereas regional changes in tree seedling evolutionary diver-sity may indicate the future effects of climate change on forested communities (Potter and Woodall 2012). Such analyses are part of an emerging synthesis of community ecology and evolutionary bi-ology (Johnson and Stinchcombe 2007) that provides a framework for quantifying evolutionary and ecological patterns in ecological communities as well as for testing some of the central mechanisms important in structuring those communities (Swenson et al. 2007, Emerson and Gillespie 2008, Burns and Strauss 2011). These anal-yses of phylogenetic relationships among tree species also offer new insights into the ecological organization of forest communities froman evolutionary perspective and have the potential to assist in the assessment of the health of forest communities from the perspective of biodiversity and resilience to stress (Potter 2009).
Specifically, two general types of phylogenetic community anal-ysis are useful for quantifying evolutionary relationships within for-est tree communities across broad scales: the generation of phyloge-netic diversity statistics and the quantification of phylogephyloge-netic community structure. Phylogenetic diversity statistics (Faith 1992, Webb et al. 2006) are meaningful measures of biodiversity because, unlike species richness and related metrics, they account for the evolutionary relationships among species (Vane-Wright et al. 1991). Measurements of evolutionary history within a set of co-oc-curring species should better represent the diversity of species traits within that community, because taxonomically distinct species are expected to contribute more to the diversity of functional traits existing within the community (Faith 1992, 2002). Recent
Manuscript received July 31, 2013; accepted January 7, 2014; published online February 6, 2014.
Affiliations:Kevin M. Potter ([email protected]), North Carolina State University, Department of Forestry and Environmental Resources, Research Triangle Park, NC. Frank H. Koch ([email protected]), USDA Forest Service, Southern Research Station.
Acknowledgments:We appreciate the technical assistance of Cam Webb, Kurt Riitters, and Bill Smith, and we extend our appreciation to Mark Ambrose for his discussions and comments about the analyses, as well as to two anonymous reviewers who provided helpful comments. We thank Marc Johnson and the following members of the North Carolina State University Ecology and Evolution Reading Group for their thoughtful comments: Warren Booth, Norm Douglas, John Grady, Rosemary Grinnan, William Hoffmann, Sean Menke, Nash Turley, and Michael Weiser. This research was supported in part through Research Joint Venture Agreements 06-JV-11330146-124, 08-JV-11330146-078, and 12-JV-11330146-063 between the USDA Forest Service and North Carolina State University.
publications have assessed regional relationships between phyloge-netic diversity statistics and species richness in North American forests (Paquette and Messier 2011, Potter and Woodall 2012, 2014).
The central methodology of community phylogenetics, mean-while, is to define the phylogenetic structure of a local community (evenness or clustering) relative to random species assemblages drawn from a broader species pool (Swenson et al. 2006). Stated another way, community phylogenetic methods test whether the species present in a community are more or less clustered on the tree of life compared with a random selection of species from a wider geographic area that could potentially be present within the com-munity. Whereas analyses of plant community structure generally have been conducted at relatively local scales (for example, Kembel and Hubbell 2006, Silvertown et al. 2006, Webb et al. 2006), the examination of phylogenetic structure across broad geographic re-gions should prove useful (Pennington et al. 2006). Recently, such studies have quantified forest tree phylogenetic community struc-ture across broad regions in North America (Qian et al. 2013), South America (Giehl and Jarenkow 2012), and Australia (Kooy-man et al. 2011). Within the context of forest ecology and forest health, plot-level forest phylogenetic community structure across large scales can be used to test how environmental variables are associated with patterns of relatedness among co-occurring tree spe-cies and can allow for assessments of which forested areas are at greater risk from threats such as pests, pathogens, nonnative invasive plants, and changing climate conditions.
Analyses of phylogenetic structure in species occurring within and across communities provide insight into the ecological and evo-lutionary processes that organize these communities (Webb 2000, Bryant et al. 2008). A clustered phylogenetic distribution of taxa, in which species are more closely related than expected (for example, Tofts and Silvertown 2000, Webb 2000, Verdu and Pausas 2007), suggests that habitat use may be a conserved trait among the species in the community (Webb et al. 2002). Such a pattern of environ-mental filtering is expected to occur when closely related species share similar tolerances to the abiotic environment, as a result of shared functional traits that arose in a common ancestor, and exhibit evolutionary niche conservatism (Cavender-Bares et al. 2004, 2006). This is the expectation that, all else being equal, related species will tend to occupy the same sorts of environments (Dono-ghue 2008). Because such forest communities share much evolu-tionary history and an affinity for similar environmental conditions, they may be particularly susceptible to threats such as generalist insects and diseases, nonnative plant invasion, and shifting climate conditions.
On the other hand, an even phylogenetic distribution of taxa, in which species are less closely related than expected by chance (for example, Cavender-Bares et al. 2004, Slingsby and Verboom 2006, Bryant et al. 2008), may suggest competition among related taxa for similar niches within the community (Webb et al. 2002). This com-petitive exclusion, a form of biotic interaction, should limit the coexistence of closely related species if they share limiting resources (Cavender-Bares et al. 2004, 2006). Phylogenetic evenness also may be caused by abiotic habitat filtering that acts on distantly related species that exhibit convergent niche evolution toward fitness for a particular set of environmental conditions (Kraft et al. 2007, Dono-ghue 2008). Ecological facilitation (Vandermeer 1989), in which positive interactions occur between phylogenetically distant species, could also result in this type of phylogenetic community structure
(Valiente-Banuet and Verdu 2007, 2008). The ecological integrity of such communities could be less at risk from environmental threats such as insects, disease, nonnative plants, and climate change because the species contained within the communities may encom-pass a wider variety of evolutionary adaptations to respond to chang-ing conditions.
Using a network of more than 100,000 standardized forest in-ventory plots, we tested whether the forests of the conterminous United States exhibit significant phylogenetic structure (clustering or evenness) nationally and regionally. These permanent plots are a consistent size, are inventoried in a consistent manner across the United States, and are sampled at a consistent spatial intensity across that area (Bechtold and Scott 2005). The result is a standardized forest tree inventory data set that samples from an extensive area at an intensity that allows for robust analysis at large scales and reduces the likelihood of an incorrectly rejected hypothesis of clustering or evenness in cases where the community is very species poor or con-stitutes a very large proportion of the regional species pool (Kraft et al. 2007). To our knowledge, no other such standardized plot-level forest community data set is available at a continental scale. The plots are small enough (0.067 ha) that species may interact on the plots, allowing for the possibility that patterns of phylogenetic even-ness in community structure could be the result of interspecific competition (Vamosi et al. 2009).
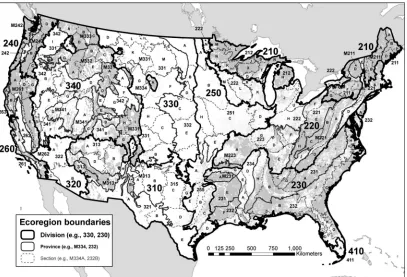
To operationally define the spatial extent of the species pools to which forest tree communities are compared in our study (Swenson et al. 2006), we analyzed the forest inventory data within the frame-work of a multiple-scale nested system of ecoregions, in which the ecoregions at each descending scale are defined in an increasingly finer fashion based on geology, climate, soils, potential natural veg-etation, and potential natural communities (Cleland et al. 1997). We conducted these analyses across three ecoregion scales for three taxonomic groupings and identified which environmental factors help explain patterns of phylogenetic relatedness across broad regions.
Methods
Forest Tree Community Data Assembly
The Forest Inventory and Analysis (FIA) Program of the US Department of Agriculture (USDA) Forest Service systematically collects tree inventory information on all forestland ownerships in the United States and is the primary source for information about the extent, condition, status, and trends of the nation’s forest re-sources (Smith 2002). FIA maintains a network of more than 100,000 permanent ground plots of forested land across the conter-minous United States, with a sampling intensity of approximately 1 plot per 2,428.11 ha. Forested land is defined as being at least 0.405 ha in extent and at least 10% stocked by forest trees of any size, or as land formerly having such tree cover and not currently developed for a nonforest use. Each FIA plot consists of four 7.32-m fixed-radius subplots, in which all trees havingⱖ12.7 cm or greater dbh are measured. In addition, each subplot contains a microplot with a radius of 2.07 m in which saplings of 2.54 –12.45 cm dbh are inventoried (Bechtold and Scott 2005).
Inc., Redlands, CA), we assigned each plot to the appropriate ecore-gion domain, division, province, and section under the USDA For-est Service hierarchical ecoregion system (Figure 1), using the most recent geographical information system (GIS) mapping of these nested scales (Cleland et al. 2007). Domains and divisions, the two broadest scales, are based on large ecological climate zones, whereas each division is divided into provinces based on vegetational mac-rofeatures. Provinces are further divided into sections, encompass-ing areas similar in their geology, climate, soils, potential natural vegetation, and potential natural communities (Cleland et al. 1997). By law, the exact coordinates of FIA plots are slightly altered to protect the privacy of forest landowners, with most of the adjusted coordinates located within 0.8 km and all within 1.61 km of the actual plot coordinates. In addition, a small proportion of plot co-ordinates from privately owned locations may be “swapped” with those of another private plot within the same county with similar attributes, such as forest type, stand-size class, latitude, and longi-tude (Woudenberg et al. 2010). Obscuring the original plot coor-dinates should have little effect on the results of this study because plot-level results are summarized by ecoregions. Ecoregion sections, the smallest scale of the analyses, are generally thousands of square kilometers in extent and generally encompass hundreds to thou-sands of plots each. In addition, each sample in the national FIA system is independently selected (Bechtold and Patterson 2005), so autocorrelation among samples is not an issue regardless of the prox-imity of the most closely neighboring plots (generally about 5 km apart).
Supertree Construction
Determining community structure statistics required construct-ing a hypothesized phylogenetic supertree of 311 tree species
in-cluded in the FIA data (Potter and Woodall 2012). In brief, we used the online phylogenetic database and toolkit Phylomatic (Webb and Donoghue 2005) to generate a backbone phylogenetic supertree topology based on the Angiosperm Phylogeny Group II classifica-tion of flowering plant families (Angiosperm Phylogeny Group 2003). We then used the BLADJ (Branch Length ADJustment) module in the Phylocom version 3.41 software package (Webb et al. 2008) to assign ages to nodes in this supertree based on the fossil and molecular estimates reported by Wikstro¨m et al. (2001), with un-dated nodes spaced evenly between un-dated nodes to minimize vari-ance in branch lengths. The resulting “pseudochronogram” can be used to estimate phylogenetic distance, in units of time, between taxa (Webb et al. 2008). To improve the resolution of the phyloge-netic supertree to the species level and to expand it to incorporate gymnosperms, we surveyed recent molecular systematic and paleo-botanical studies of the families and genera that encompass North American tree species and of the higher-level gymnosperm groups (Potter and Woodall 2012). We added dated node constraints to the supertree topology where possible and then re-ran the BLADJ algo-rithm in Phylocom to again set the ages of undated nodes evenly between dated nodes. Such supertree phylogenies approximate the actual evolutionary relationships among species and can be im-proved with additional molecular systematic research and with en-hanced understanding of the fossil record.
Community Phylogenetic Analysis
2). We used Phylocom 3.41 (Webb et al. 2008) to calculate com-munity phylogenetic statistics at the plot level with random null communities drawn from the species present in each of three as-cending ecoregion scales (section, province, and division) to exam-ine how the geographic scale of the null community species pool affects the signal of phylogenetic clustering or evenness in plot-level species co-occurrences. Plots containing only one species cannot be interpreted using these measures of phylogenetic structure, so we used plots containing two or more species (Swenson et al. 2007). Ecoregion units containing fewer than 25 plots were excluded from the analysis to ensure reasonable sampling. In addition to analyzing all tree species inventoried, we conducted separate analyses of an-giosperm and gymnosperm species.
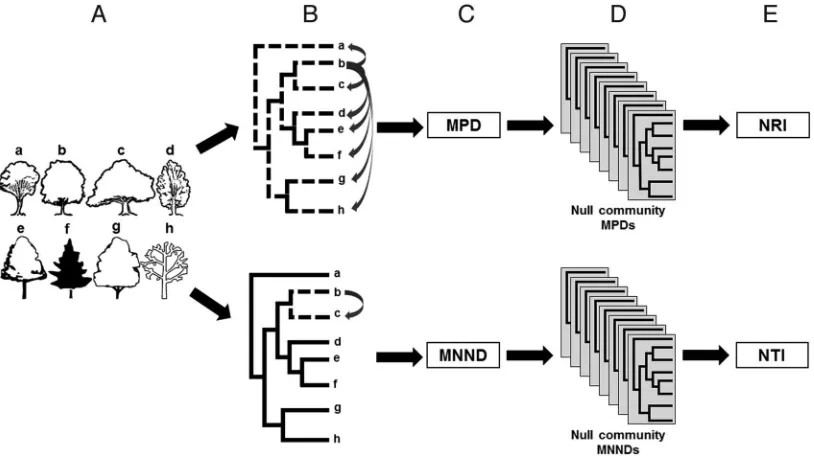
For each plot, we calculated mean phylogenetic distance (MPD), in millions of years, between each species on a plot and all other species on the plot, and mean nearest neighbor distance (MNND), the mean minimum phylogenetic distance between each species on the plot and the most closely related species also on the plot, again measured in millions of years (Webb et al. 2006). The MPD and MNND statistics were then used in two indices that characterize the phylogenetic community structure of a set of co-occurring species (Figure 2). The net relatedness index (NRI) is a standardized mea-sure of total community relatedness. It is the mean pairwise phylo-genetic distance of a set of co-occurring species in a community and therefore measures the overall clustering of those taxa on the refer-ence tree (Webb 2000, Webb et al. 2002). It is calculated as
NRI⫽ ⫺(MPD⫺MPD共0兲)
MPD共0兲
whereMPD(0)is the mean phylogenetic distance taken from 1,000
simulated null communities andMPD(0)is the SD of MPD in those null communities. The nearest taxon index (NTI), meanwhile, is a standardized measurement of nearest-relative relatedness in a com-munity. It quantifies the terminal (branch tip) clustering of co-oc-curring species regardless of the clustering of the higher-level clades on the tree (Webb 2000, Webb et al. 2002). Similar to NRI, NTI is calculated as
NTI⫽ ⫺共MNND⫺MNND共0兲兲
MNND共0兲
where MNND(0)is the mean of the MNND measurements from
1,000 simulated null communities andMPD(0)is the null
commu-nity MNND SD. NRI values are negative when species are less phylogenetically related than expected by chance across the entire tree (phylogenetic evenness) and are positive when they are more related (phylogenetic clustering), whereas NTI values will be posi-tive (clustered) when species occur with other closely related species and will be negative (even) when species do not occur together with closely related species (Kembel and Hubbell 2006).
occurring on plots within each ecoregion but does not introduce species from the reference phylogeny into the null communities. Each of the 1,000 null communities used for each plot was gener-ated through 50,000 swaps. For each scale of our analyses (11 ecore-gion divisions, 35 provinces, and 165 sections), we used the species present across a given ecoregion unit as the pool for the creation of null communities.
We used a single-sample Wilcoxon signed-rank test (Conover 1971) to test whether the community phylogenetic structure across each ecoregion was significantly clustered or even, that is, whether NRI and NTI values differed significantly from 0. To investigate smaller-scale patterns of clustering, we interpolated plot-level NRI and NTI values determined with province-level species pools, using inverse distance weighting interpolation in ArcMap 9.2, at a resolu-tion of 10 km with a 100-km search radius. Each province was interpolated independently using a polyline ecoregion province cov-erage as a search barrier.
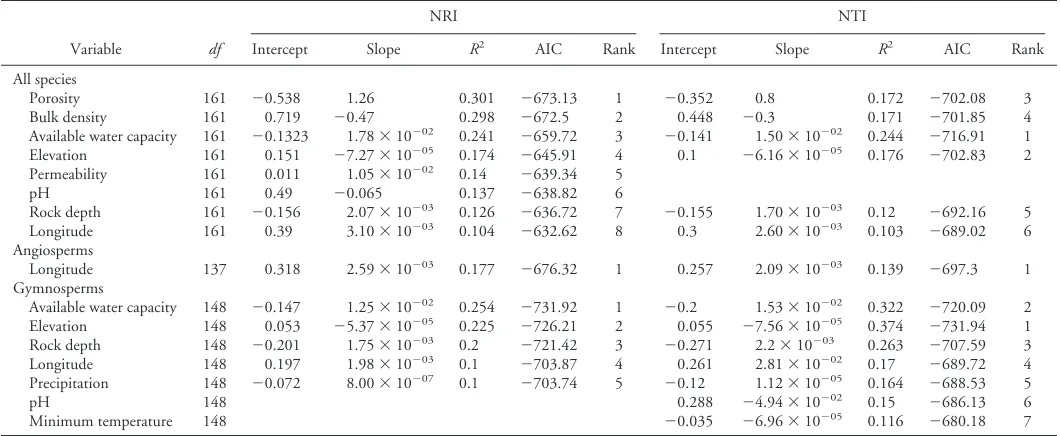
Using PROC REG in SAS version 9.2, we generated single-vari-able linear regression models to determine which environmental variables were the best predictors of mean plot-level NRI and NTI across ecoregion sections, the smallest scale of analysis, with the species pool defined at the same scale. The models were ranked using Akaike’s information criterion (Akaike 1974), and only models sig-nificant atP⬍0.05 and withR2⬎0.1 were included. The climate
variables for each plot were derived from the parameter elevation regression on independent slopes (PRISM) climate mapping system (PRISM Climate Group 2008), which had a spatial resolution of 4 km2 and encompassed mean 30-year annual precipitation and
monthly maximum and minimum temperatures across the years 1971–2000. Seven soil variables were included: available water ca-pacity, bulk density, depth to bedrock, pH, permeability, plasticity, and porosity, all from CONUS-Soil (Miller and White 1998), a multilayer soil characteristics data set, at a resolution of 1 km2, based
on the USDA State Soil Geographic Database (STATSGO). Mean elevation was derived from a digital elevation model with a resolu-tion of approximately 800 m2(US Geological Survey 1996), and
plot latitude and longitude were provided in the FIA database. Mean
values for each variable were calculated across plots within each ecoregion section.
Results
Our analyses identified statistically significant scale-associated differences in phylogenetic clustering metrics across 102,304 plots when we used the species present within hierarchically nested ecore-gion sections, provinces, and divisions as the species pools (Figure 3). Across all scales, NRI and NTI were significantly positive (phy-logenetically clustered) for the two sets of analyses that encompassed all tree species and angiosperms only. For the analyses encompassing gymnosperm species only, NRI and NTI were negative (phyloge-netically even) across scales, with the exception of the NRI province-level scale analysis, which was neither significantly clustered nor even. The results further suggest a trend toward higher mean posi-tive values at larger scales for both the all-species and angiosperm analyses and toward lower negative values for gymnosperms in the NTI analysis (Figure 3). Wilcoxon matched-pair tests comparing section, province, and division NRI and NTI (not shown) demon-strated that all were significantly different from each other for the analyses of all species and of angiosperms. The mean NRI and NTI values increased in magnitude with increasing scale, indicating an increasing degree of clustering (Figure 3). For gymnosperms, the section and division NRI values were not significantly different, but the NTI values for all three scales were significantly different from each other and were increasingly negative (evenly dispersed) with increasing scale of analysis.
evenly dispersed. In several cases, division-scale NRI and NTI for angiosperm species were neither clustered nor evenly dispersed. Only the Marine (240) division on the Pacific Coast was signifi-cantly evenly dispersed. Division-level NRI and NTI for gymno-sperms, meanwhile, were more likely to be significantly evenly dispersed.
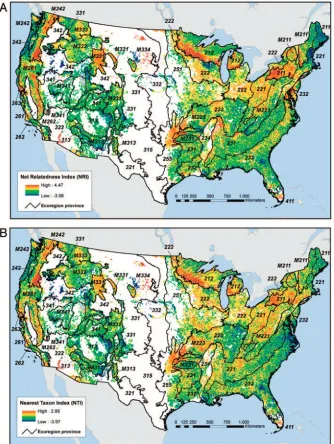
The geographic pattern of the clustering indices was further ap-parent when NRI and NTI values were calculated with province-level species pools, the scale immediately smaller than divisions. When all tree species were considered, ecoregion provinces with a
preponderance of phylogenetically even plots tended to be most common in the Interior West, particularly in the Southwest (e.g., 313, M313, and 321), the Great Basin (M341 and 342), and the Northern Rockies (M332) for NRI (treewide structure), whereas phylogenetically even plots for NTI (branch-tip) were also common in the Southeast (M231 and 232) (Figure 4A and D; Supplemental Table S1). Phylogenetic clustering was more widespread in the Mid-Atlantic region (e.g., 211 and 221), the Upper Midwest (212 and 222), and the Sierra and Cascade mountain ranges (M242 and M261). For angiosperms, phylogenetic evenness was significant
Supplementary data are available with this article at http://dx.doi.org/10.5849/forsci.13-115.
Table 1. Standardized measures of forest tree community phylogenetic structure, calculated as means across plots in ecoregion divisions and provinces, with null community species pools determined by the species present in each ecoregion.
Ecoregion name (Code)
All species Angiosperms Gymnosperms
Plots NRI NTI Plots NRI NTI Plots NRI NTI
Warm Continental (210) 24,688 0.321a
0.259a
22,883 0.178a
0.196a
17,623 ⫺0.042a ⫺
0.041 Hot Continental (220) 24,710 0.076a
0.188a
24,467 0.195a
0.194a
9,480 0.149a
0.139a
Subtropical (230) 28,736 0.078a ⫺0.059a 26,416 0.087 0.057 22,091 ⫺0.004a ⫺0.01a
Marine (240) 2,586 0.166a
0.147a
1,016 ⫺0.048a ⫺
0.042a
2,534 0.03a
0.03a
Prairie (250) 2,846 0.068a
0.088a
2,818 0.178a
0.121a
547 0.182a
0.176a
Mediterranean (260) 3,733 0.335a
0.121a
2,201 ⫺0.048 ⫺0.036 3,213 ⫺0.087a ⫺
0.135a
Tropical/Subtropical Steppe (310) 3,175 ⫺0.117a ⫺0.146a 1,343 0.076a 0.062a 2,935 ⫺0.258a ⫺0.313a
Tropical/Subtropical Desert (320) 99 0.031 ⫺0.024 59 ⫺0.009 0.024 48 ⫺0.147a ⫺
0.183a
Temperate Steppe (330) 1,030 0.602a
0.294a
515 0.067 0.031 705 ⫺0.125a ⫺
0.21a
Temperate Desert (340) 10,645 0.032a ⫺
0.053a
3,210 0.001a
0.001a
10,045 ⫺0.045a ⫺
0.148a
Savannah (410) 56 0.369 0.142 40 ⫺0.014 ⫺0.02 46 0.102 0.102
NRI is a tree-wide measurement of clustering, whereas NTI quantifies clustering at the tips of the branches on the phylogenetic tree. Positive values indicate phylogenetic clustering, and negative values evenness.
a
Values significantly different from 0, based on a Wilcoxon single-sample signed rank test.
across the plots of only four provinces for NRI and for NTI, all but one in the West (Figure 4B and E; Supplemental Table 1). For gymnosperms, on the other hand, phylogenetic evenness was the prevailing pattern across the country both for NRI and NTI (Figure 4C and F; Supplemental Table 1). Results at the section scale, the smallest scale of analysis, were largely consistent with those at the province scale (Supplemental Table S2).
The interpolation of plot-level NRI (Figure 5A) and NTI (Figure 5B) revealed areas that exhibited strong spatial gradients in plot-level measures of phylogenetic clustering, including those in the Warm Continental (210) ecoregion division, where forests demon-strate decreasing clustering from south to north, and in the Marine (240) and Mediterranean (260) divisions, which are increasingly clustered at higher elevations. These patterns suggest a relationship between clustering and environmental variables such as elevation and precipitation. This relationship was further underscored by the
The environmental associations were generally stronger for the gymnosperm branch-tip metrics (NTI) than for the gymnosperm treewide metrics (NRI).
Discussion
Our results demonstrate that the relative degree of phylogenetic clustering or evenness in the phylogenetic community structure of North American forests is strongly influenced both by the spatial scale of the species pool from which the community is drawn and by the taxonomic delineation of the species within the communities (Figure 3). The increasing phylogenetic clustering at larger scales, for all tree species and for angiosperms, is consistent with a study of forested areas in Central America (Swenson et al. 2006) and with expectations that clustering might be more common in communi-ties with large regional species pools (Vamosi et al. 2009) as a result of biogeographic processes, such as limited dispersal, and evolution-ary processes, such as local radiation, that result in close relatives co-occurring within large regions (Pennington et al. 2006, Swenson et al. 2007). Niche conservatism and therefore phylogenetic cluster-ing are expected to emerge as the dominant patterns with increascluster-ing spatial scale, as the decreasing strength of competition and other density-dependent mechanisms, which prevent close relatives from co-occurring, give way to the increasing influence of biogeographi-cal history, including the tendency of species within a clade to be concentrated in the clade’s region of origin (Cavender-Bares et al. 2009).
The opposite pattern among gymnosperms (Figure 3), however, is perhaps not unexpected, given that studies encompassing differ-ing taxonomic groups have detected dissimilar phylogenetic pat-terns within communities (Swenson et al. 2007). Cavender-Bares et al. (2006), for example, found that communities that are more broadly defined phylogenetically are more likely to exhibit phyloge-netic clustering as a result of trait conservatism and environmental filtering, whereas narrowly defined communities are more likely to exhibit phylogenetic evenness as a result of trait convergence, trait evenness, or both. In the current study, the plot-level phylogenetic
distance per species is higher for gymnosperms than for angiosperms (220.1 million years per species versus 135.9 million years), suggest-ing that gymnosperms, at the plot level, generally represent more widely divergent lineages and are therefore more likely to tend to-ward a pattern of phylogenetic evenness across multiple scales. Given that the Pinales underwent major radiation during the Trias-sic period (⬃245–208 million years ago [mya]) (Willis and Mc-Elwain 2002) and that all the extant conifer families were in exis-tence by 184 mya (Cheng et al. 2000, Eckert and Hall 2006), there may have been adequate time for conifers to evolve convergent traits that adapted distantly related taxa to similar environments and therefore allowed them to coexist at smaller spatial scales. The shorter time since the explosive diversification and radiation of an-giosperms during the late Cretaceous (⬃100 – 65 mya) (Willis and McElwain 2002) may have hindered convergent evolution between distant lineages, which remain more closely associated with con-served niches and thus generated the pattern of phylogenetic clus-tering at the plot scale.
Regional Patterns of Phylogenetic Structure
Evolutionary and geographic histories are components of ecolog-ical systems that can be revealed in part through phylogenetic anal-yses, providing insight into the development of diversity patterns and unique aspects of biological communities in different regions (Ricklefs 2006). Our analyses demonstrated that the plot-level phy-logenetic structure was generally clustered across ecoregion divi-sions, the largest scale of analysis (Table 1), suggesting a tendency toward niche conservatism in most areas. Kraft et al. (2007) sug-gested that such phylogenetic clustering generally arises only from filtering processes acting on conserved traits, so clustering provides provisional evidence of niche conservatism. In the analysis of com-munity composition at large scales, this pattern could also result from biogeographic processes of local radiation and limited dispersal that cause close relatives to co-occur at a regional scale (Pennington et al. 2006). Our study, however, analyzed plot-level tree commu-nity composition, so such local radiation and limited dispersal Table 2. Univariate models regressing mean plot-level phylogenetic clustering metrics within ecoregion sections against a suite of mean plot-level environmental variables.
Variable df
NRI NTI
Intercept Slope R2 AIC Rank Intercept Slope R2 AIC Rank
All species
Porosity 161 ⫺0.538 1.26 0.301 ⫺673.13 1 ⫺0.352 0.8 0.172 ⫺702.08 3 Bulk density 161 0.719 ⫺0.47 0.298 ⫺672.5 2 0.448 ⫺0.3 0.171 ⫺701.85 4 Available water capacity 161 ⫺0.1323 1.78⫻10⫺02
0.241 ⫺659.72 3 ⫺0.141 1.50⫻10⫺02
0.244 ⫺716.91 1 Elevation 161 0.151 ⫺7.27⫻10⫺05
0.174 ⫺645.91 4 0.1 ⫺6.16⫻10⫺05
0.176 ⫺702.83 2 Permeability 161 0.011 1.05⫻10⫺02
0.14 ⫺639.34 5
pH 161 0.49 ⫺0.065 0.137 ⫺638.82 6
Rock depth 161 ⫺0.156 2.07⫻10⫺03
0.126 ⫺636.72 7 ⫺0.155 1.70⫻10⫺03
0.12 ⫺692.16 5 Longitude 161 0.39 3.10⫻10⫺03
0.104 ⫺632.62 8 0.3 2.60⫻10⫺03
0.103 ⫺689.02 6 Angiosperms
Longitude 137 0.318 2.59⫻10⫺03 0.177 ⫺676.32 1 0.257 2.09⫻10⫺03 0.139 ⫺697.3 1
Gymnosperms
Available water capacity 148 ⫺0.147 1.25⫻10⫺02
0.254 ⫺731.92 1 ⫺0.2 1.53⫻10⫺02
0.322 ⫺720.09 2 Elevation 148 0.053 ⫺5.37⫻10⫺05
0.225 ⫺726.21 2 0.055 ⫺7.56⫻10⫺05
0.374 ⫺731.94 1 Rock depth 148 ⫺0.201 1.75⫻10⫺03 0.2 ⫺721.42 3 ⫺0.271 2.2⫻10⫺03 0.263 ⫺707.59 3
Longitude 148 0.197 1.98⫻10⫺03
0.1 ⫺703.87 4 0.261 2.81⫻10⫺02
0.17 ⫺689.72 4 Precipitation 148 ⫺0.072 8.00⫻10⫺07
0.1 ⫺703.74 5 ⫺0.12 1.12⫻10⫺05
0.164 ⫺688.53 5
pH 148 0.288 ⫺4.94⫻10⫺02
0.15 ⫺686.13 6 Minimum temperature 148 ⫺0.035 ⫺6.96⫻10⫺05 0.116 ⫺680.18 7
NRI is a tree-wide measurement of clustering, whereas NTI quantifies clustering at the tips of the branches on the phylogenetic tree. Models withR2⬍
might result in an unstructured or evenly dispersed community structure at the plot level relative to that at the clustered regional pool. This may in fact be the case for plots within two ecoregion divisions, the Subtropical (230) in the Southeast and the Temperate Desert (340) in the West, where plot-level structure for all species was clustered for the treewide or basal index (NRI) and evenly dispersed according to the branch-tip metric (NTI). These regions may have been occupied in the distant past by a relatively phyloge-netically constrained set of tree species, which radiated into many forms via allopatric speciation, diversifying the regional species pool but reducing the likelihood that closely related species with similar traits would coexist at the plot level (Johnson and Stinchcombe 2007).
Interpreting phylogenetic evenness at the plot level is generally more complicated than understanding the forces that result in clus-tering, because evenly dispersed communities can arise from two quite different processes: competitive exclusion and filtering com-bined with convergent traits (Kraft et al. 2007). In the former, closely related species exclude each other as a result of competition for limiting resources, whereas in the latter, distantly related species have become similarly adapted to a given set of environmental con-ditions as a result of convergent evolution. In our analysis encom-passing all tree species on FIA plots, only one ecoregion division was evenly dispersed by both structure metrics, the Tropical/Subtropical Steppe division (310) in the Southwestern United States (Table 1). In the analysis limited to angiosperms, only the Marine division (240) of the Pacific Northwest was evenly dispersed for both met-rics. This pattern, as well as those at the smaller ecoregion province and section scales, is consistent with the findings of Qian et al. (2013), who observed that angiosperm tree species were phyloge-netically clustered in the large majority of 12,100-km2 quadrats across North America, a finding they attributed to phylogenetic niche conservatism. Meanwhile, our analyses of gymnosperms found phylogenetic evenness in four western ecoregion divisions and in a large proportion of the ecoregion provinces and sections, particularly in the West. These results suggest an important linkage between broad geographical region and phylogenetic structure, with the tendency toward evenness being generally limited to the western half of the conterminous United States.
Environmental Associations with Phylogenetic Structure
The results of our univariate regression analyses across ecoregion sections (Table 2) suggest that phylogenetic clustering and therefore niche conservatism may be more common in lower-elevation areas with moister and less compact soils. This finding is consistent with the expectation that biotic interactions shift from competition at more favorable, lower-elevation sites, to interspecies facilitation at harsher, higher-elevation sites (Bryant et al. 2008, Valiente-Banuet and Verdu 2008). Our results are also consistent with the finding that phylogenetic evenness and phylogenetic diversity were more highly correlated with live aboveground tree biomass accumulation on poorer sites, suggesting that the coexistence of functionally dif-ferent tree species is associated with higher forest productivity in less productive and more stressful environments (Potter and Woodall 2014).
In addition, phylogenetic evenness in more extreme environ-ments, such as the deserts and mountains of the Interior West of the United States, could result from the convergent evolution of neces-sary complex adaptations occurring in only a few lineages, which are then able to colonize and diversify in a relatively competition-free
environment (Prinzing et al. 2001). The fact that branch-tip clus-tering (NTI) has a stronger relationship than treewide clusclus-tering (NRI) with higher available water capacity and with lower elevation suggests that such dynamics may have historically occurred in the forests of the United States, particularly among gymnosperms. Among woody plants, in fact, drier and higher-elevation sites across the globe have been found to contain proportionally greater num-bers of genera and families at a given level of species diversity than low-elevation mesic sites (Enquist et al. 2002).
Possible Implications for Forest Health
Phylogenetic community structure measures, such as those de-scribed here, may serve as useful community-level indicators of po-tential resilience and susceptibility to forest health stressors. For example, phylogenetic community structure is expected to be asso-ciated with resistance to invasion (Strauss et al. 2006, Diez et al. 2008, Carboni et al. 2013), ecological impacts of disease (Gilbert and Webb 2007, Liu et al. 2012, Schweizer et al. 2013), and re-sponses to climatic changes (Willis et al. 2008, Cavender-Bares and Reich 2012, Senior et al. 2013). Communities of species with even phylogenetic distributions possess greater-than-expected evolution-ary diversity and may therefore encompass a higher proportion of species unaffected by a given stressor or able to adapt to it and may possess a greater diversity of functional traits. Given that commu-nity ecology theory predicts that an invasive species will be unlikely to become established when a species already exists with similar traits (Funk et al. 2008), a community containing a wider variety of traits, such as one in which species are phylogenetically evenly dis-tributed, may be less susceptible to invasion. In contrast, species that are more closely related tend to be more ecologically similar (Burns and Strauss 2011). Phylogenetically clustered communities, there-fore, are likely to contain less evolutionary and ecological diversity and may therefore be more vulnerable to stressors.
[220], Mediterranean [260], and Temperate Steppe [330] ecore-gion divisions, as well as several ecoreecore-gion provinces).
The results of our continental-scale phylogenetic community structure analyses demonstrate that phylogenetic clustering pre-dominates in forests across most regions of the country, indicating the widespread significance of evolutionary niche conservatism, ex-cept in areas of the West where competitive exclusion, convergent evolution, or facilitation may be more common processes. The de-gree of clustering is associated with environmental gradients in a manner suggesting the niche conservatism predominates in more favorable locations, whereas competitive exclusion, convergent evo-lution, or interspecies facilitation predominate in areas with harsher environments. It therefore appears that forest communities in areas possessing more favorable environments for forest trees may be most susceptible to the ecological affects associated with threats such as climate change, nonnative plant invasion, and insect and disease infestation. More research is clearly needed to assess the degree to which the phylogenetic structure of ecological communities, includ-ing forests across broad scales in the United States, is associated with susceptibility and resistance to such threats (Cavender-Bares et al. 2009).
Literature Cited
AKAIKE, H. 1974. A new look at the statistical model identification.IEEE Trans. Autom. Control19(6):716 –723.
ANGIOSPERMPHYLOGENYGROUP. 2003. An update of the Angiosperm Phylogeny Group classification for the orders and families of flowering plants: APG II.Bot. J. Linnean Soc. 141(4):399 – 436.
BECHTOLD, W.A.,ANDP.L. PATTERSON. 2005.The Enhanced Forest In-ventory and Analysis Program: National sampling design and estimation procedures. USDA For. Serv., Gen. Tech. Rep. SRS-80, Southern Re-search Station, Asheville, NC. 85 p.
BECHTOLD, W.A., ANDC.T. SCOTT. 2005. The Forest Inventory and Analysis plot design. P. 27– 42 inThe Enhanced Forest Inventory and Analysis program—National sampling design and estimation procedures, Bechtold, W.A., and P.L. Patterson (eds.). USDA For. Serv., Southern Research Station, Asheville, NC.
BRYANT, J.A., C. LAMANNA, H. MORLON, A.J. KERKHOFF, B.J. ENQUIST,
ANDJ.L. GREEN. 2008. Microbes on mountainsides: Contrasting eleva-tional patterns of bacterial and plant diversity.Proc. Natl. Acad. Sci. USA
105:11505–11511.
BURNS, J.H.,ANDS.Y. STRAUSS. 2011. More closely related species are more ecologically similar in an experimental test.Proc. Natl. Acad. Sci. USA108(13):5302–5307.
CARBONI, M., T. MUNKEMULLER, L. GALLIEN, S. LAVERGNE, A. ACOSTA,
ANDW. THUILLER. 2013. Darwin’s naturalization hypothesis: Scale matters in coastal plant communities.Ecography36(5):560 –568. CAVENDER-BARES, J., D.D. ACKERLY, D.A. BAUM, ANDF.A. BAZZAZ.
2004. Phylogenetic overdispersion in Floridian oak communities.Am. Naturalist163(6):823– 843.
CAVENDER-BARES, J., A. KEEN,ANDB. MILES. 2006. Phylogenetic struc-ture of Floridian plant communities depends on taxonomic and spatial scale.Ecology87(7):S109 –S122.
CAVENDER-BARES, J., K.H. KOZAK, P.V.A. FINE, AND S.W. KEMBEL. 2009. The merging of community ecology and phylogenetic biology.
Ecol. Lett.12(7):693–715.
CAVENDER-BARES, J.,ANDP.B. REICH. 2012. Shocks to the system: Com-munity assembly of the oak savanna in a 40-year fire frequency experi-ment.Ecology93(8):S52–S69.
CHENG, Y.C., R.G. NICOLSON, K. TRIPP,ANDS.M. CHAW. 2000. Phy-logeny of Taxaceae and Cephalotaxaceae tenera inferred from chloro-plastmatKgene and nuclear rDNA ITS region.Mol. Phylogenet. Evol.
14(3):353–365.
CLELAND, D.T., P.E. AVERS, W.H. MCNAB, M.E. JENSEN, R.G. BAILEY, T. KING,ANDW.E. RUSSELL. 1997. National hierarchical framework of
ecological units. P. 181–200 inEcosystem management: Applications for sustainable forest and wildlife resources, Boyce, M.S., and A. Haney (eds.). Yale University Press, New Haven, CT.
CLELAND, D.T., J.A. FREEOUF, J.E. KEYS, G.J. NOWACKI, C.A. CARPEN
-TER,ANDW.H. MCNAB. 2007.Ecological subregions: Sections and
sub-sections of the conterminous United States [1:3,500,000], Sloan, A.M. (cartog). CD-ROM. USDA For. Serv., Gen. Tech. Rep. WO-76, Washington, DC.
CONOVER, W.J. 1971. Practical nonparametric statistics. John Wiley & Sons, New York. 462 p.
DIEZ, J.M., J.J. SULLIVAN, P.E. HULME, G. EDWARDS,ANDR.P. DUNCAN. 2008. Darwin’s naturalization conundrum: Dissecting taxonomic pat-terns of species invasions.Ecol. Lett.11(7):674 – 681.
DONOGHUE, M.J. 2008. A phylogenetic perspective on the distribution of plant diversity.Proc. Natl. Acad. Sci. USA105:11549 –11555. ECKERT, A.J.,ANDB.D. HALL. 2006. Phylogeny, historical biogeography,
and patterns of diversification forPinus(Pinaceae): Phylogenetic tests of fossil-based hypotheses.Mol. Phylogenet. Evol.40(1):166 –182. EMERSON, B.C.,ANDR.G. GILLESPIE. 2008. Phylogenetic analysis of
com-munity assembly and structure over space and time.Trends Ecol. Evol.
23(11):619 – 630.
ENQUIST, B.J., J.P. HASKELL,ANDB.H. TIFFNEY. 2002. General patterns of taxonomic and biomass partitioning in extant and fossil plant com-munities.Nature419(6907):610 – 613.
FAITH, D.P. 1992. Conservation evaluation and phylogenetic diversity.
Biol. Conserv.61:1–10.
FAITH, D.P. 2002. Quantifying biodiversity: A phylogenetic perspective.
Conserv. Biol.16(1):248 –252.
FUNK, J.L., E.E. CLELAND, K.N. SUDING, AND E.S. ZAVALETA. 2008. Restoration through reassembly: Plant traits and invasion resistance.
Trends Ecol. Evol.23(12):695–703.
GIEHL, E.L.H.,ANDJ.A. JARENKOW. 2012. Niche conservatism and the differences in species richness at the transition of tropical and subtrop-ical climates in South America.Ecography35(10):933–943.
GILBERT, G.S.,ANDC.O. WEBB. 2007. Phylogenetic signal in plant
patho-gen-host range.Proc. Natl. Acad. Sci. USA104(12):4979 – 4983. GOTELLI, N.J.,ANDG.L. ENTSMINGER. 2003. Swap algorithms in null
model analysis.Ecology84(2):532–535.
JOHNSON, M.T.J.,ANDJ.R. STINCHCOMBE. 2007. An emerging synthesis between community ecology and evolutionary biology. Trends Ecol. Evol.22(5):250 –257.
KEMBEL, S.W.,ANDS.P. HUBBELL. 2006. The phylogenetic structure of a neotropical forest tree community.Ecology87(7):S86 –S99.
KOOYMAN, R., M. ROSSETTO, W. CORNWELL,ANDM. WESTOBY. 2011. Phylogenetic tests of community assembly across regional to continental scales in tropical and subtropical rain forests. Global Ecol. Biogeogr.
20(5):707–716.
KRAFT, N.J.B., W.K. CORNWELL, C.O. WEBB,ANDD.D. ACKERLY. 2007. Trait evolution, community assembly, and the phylogenetic structure of ecological communities.Am. Naturalist170(2):271–283.
LIU, X.B., M.X. LIANG, R.S. ETIENNE, Y.F. WANG, C. STAEHELIN,AND
S.X. YU. 2012. Experimental evidence for a phylogenetic Janzen-Connell effect in a subtropical forest.Ecol. Lett.15(2):111–118. MILLER, D.A.,AND R.A. WHITE. 1998. A conterminous United States
multilayer soil characteristics data set for regional climate and hydrology modeling.Earth Interact.2(2):1–26.
PAQUETTE, A.,ANDC. MESSIER. 2011. The effect of biodiversity on tree productivity: From temperate to boreal forests.Global Ecol. Biogeogr.
20(1):170 –180.
the historical construction of species-rich biomes from dated plant phy-logenies, neutral ecological theory and phylogenetic community struc-ture.New Phytol.172(4):605– 616.
POTTER, K.M. 2009. From genes to ecosystems: Measuring evolutionary diversity and community structure with Forest Inventory and Analysis (FIA) data. In2008 Forest Inventory and Analysis (FIA) symposium,
2008 October 21–23, Park City, UT. USDA For. Serv., Proc. RMRS-P-56CD, Rocky Mountain Research Station, Fort Collins, CO. 16 p.
POTTER, K.M.,ANDC.W. WOODALL. 2012. Trends over time in tree and seedling phylogenetic diversity indicate regional differences in forest biodiversity change.Ecol. Appl.22(2):517–531.
POTTER, K.M.,ANDC.W. WOODALL. 2014. Does biodiversity make a difference? Relationships between species richness, evolutionary diver-sity, and aboveground live tree biomass across US forests.For. Ecol Manage.doi: http://dx.doi.org/10.1016/j.foreco.2013.06.026. PRINZING, A., W. DURKA, S. KLOTZ,ANDR. BRANDL. 2001. The niche of
higher plants: Evidence for phylogenetic conservatism.Proc. R. Soc. Lond. Ser. B Biol. Sci.268(1483):2383–2389.
PRISM CLIMATEGROUP. 2008.30-Arcsec (800 m) gridded 30-year normal climate data (1971–2000). Oregon State University, Corvallis, OR. QIAN, H., Y. ZHANG, J. ZHANG,ANDX. WANG. 2013. Latitudinal
gradi-ents in phylogenetic relatedness of angiosperm trees in North America.
Global Ecol. Biogeogr.22:1183–1191.
RICKLEFS, R.E. 2006. Evolutionary diversification and the origin of the diversity-environment relationship.Ecology87(7):S3–S13.
SCHWEIZER, D., G.S. GILBERT,ANDK.D. HOLL. 2013. Phylogenetic ecol-ogy applied to enrichment planting of tropical native tree species.For. Ecol Manage.297:57– 66.
SENIOR, J.K., J.A. SCHWEITZER, J. O’REILLY-WAPSTRA, S.K. CHAPMAN, D. STEANE, A. LANGLEY, AND J.K. BAILEY. 2013. Phylogenetic re-sponses of forest trees to global change.PLoS One8(4):1–9.
SILVERTOWN, J., K. MCCONWAY, D. GOWING, M. DODD, M.F. FAY, J.A. JOSEPH,ANDK. DOLPHIN. 2006. Absence of phylogenetic signal in the niche structure of meadow plant communities.Proc. R. Soc. Lond. Ser. B Biol. Sci.273(1582):39 – 44.
SLINGSBY, J.A.,ANDG.A. VERBOOM. 2006. Phylogenetic relatedness limits co-occurrence at fine spatial scales: Evidence from the schoenoid sedges (Cyperaceae: Schoeneae) of the Cape Floristic region, South Africa. Am. Naturalist168(1):14 –27.
SMITH, W.B. 2002. Forest inventory and analysis: A national inventory and monitoring program.Environ. Pollut.116:S233–S242.
STRAUSS, S.Y., C.O. WEBB,ANDN. SALAMIN. 2006. Exotic taxa less related to native species are more invasive. Proc. Natl. Acad. Sci. USA
103(15):5841–5845.
SWENSON, N.G., B.J. ENQUIST, J. PITHER, J. THOMPSON,ANDJ.K. ZIM
-MERMAN. 2006. The problem and promise of scale dependency in com-munity phylogenetics.Ecology87(10):2418 –2424.
SWENSON, N.G., B.J. ENQUIST, J. THOMPSON,ANDJ.K. ZIMMERMAN. 2007. The influence of spatial and size scale on phylogenetic relatedness in tropical forest communities.Ecology88(7):1770 –1780.
TOFTS, R.,ANDJ. SILVERTOWN. 2000. A phylogenetic approach to com-munity assembly from a local species pool.Proc. R. Soc. Lond. Ser. B. Biol. Sci.267(1441):363–369.
US GEOLOGICALSURVEY. 1996. GTOPO30 —Global topographic data. EROS Data Center Distributed Active Archive Center, Sioux Falls, SD. VALIENTE-BANUET, A.,ANDM. VERDU. 2007. Facilitation can increase the phylogenetic diversity of plant communities. Ecol. Lett. 10(11): 1029 –1036.
VALIENTE-BANUET, A.,ANDM. VERDU. 2008. Temporal shifts from facil-itation to competition occur between closely related taxa. J. Ecol.
96(3):489 – 494.
VAMOSI, S.M., S.B. HEARD, J.C. VAMOSI,ANDC.O. WEBB. 2009. Emerg-ing patterns in the comparative analysis of phylogenetic community structure.Mol. Ecol.18(4):572–592.
VANDERMEER, J. 1989.The ecology of intercropping. Cambridge University Press, Cambridge, MA. 237 p.
VANE-WRIGHT, R.I., C.J. HUMPHRIES,ANDP.H. WILLIAMS. 1991. What to protect?: Systematics and the agony of choice. Biol. Conserv.
55:235–254.
VERDU, M.,ANDJ.G. PAUSAS. 2007. Fire drives phylogenetic clustering in Mediterranean Basin woody plant communities. J. Ecol. 95(6): 1316 –1323.
WEBB, C.O. 2000. Exploring the phylogenetic structure of ecological communities: An example for rain forest trees. Am. Naturalist
156(2):145–155.
WEBB, C.O., D.D. ACKERLY,ANDS.W. KEMBEL. 2008. Phylocom: Soft-ware for the analysis of phylogenetic community structure and trait evolution.Bioinformatics24(18):2098 –2100.
WEBB, C.O., D.D. ACKERLY, M.A. MCPEEK, AND M.J. DONOGHUE. 2002. Phylogenies and community ecology. Annu. Rev. Ecol. Syst.
33:475–505.
WEBB, C.O.,ANDM.J. DONOGHUE. 2005. Phylomatic: Tree assembly for applied phylogenetics.Mol. Ecol. Notes5(1):181–183.
WEBB, C.O., G.S. GILBERT,ANDM.J. DONOGHUE. 2006. Phylodiversity-dependent seedling mortality, size structure, and disease in a Bornean rain forest.Ecology87(7):S123–S131.
WIKSTROM¨ , N., V. SAVOLAINEN,ANDM.W. CHASE. 2001. Evolution of the angiosperms: Calibrating the family tree.Proc. R. Soc. Lond. Ser. B. Biol. Sci.268(1482):2211–2220.
WILLIS, C.G., B. RUHFEL, R.B. PRIMACK, A.J. MILLER-RUSHING, AND
C.C. DAVIS. 2008. Phylogenetic patterns of species loss in Thoreau’s
woods are driven by climate change. Proc. Natl. Acad. Sci. USA
105(44):17029 –17033.
WILLIS, K.J.,ANDJ.C. MCELWAIN. 2002.The evolution of plants.Oxford University Press, Oxford, UK. 377 p.
WOUDENBERG, S.W., B.L. CONKLING, B.M. O’CONNELL, E.B. LAPOINT,