PERFORMANCE BASED SEISMIC RESPONSE USING RANDOM PHASE
ACCELERATION TIME HISTORIES
Michael Costantino1, Thomas Houston2 and Andrew Maham3
1 Senior Structural Engineer, Carl J. Costantino and Associates, New York, NY ([email protected]) 2 Principal Engineer, Carl J. Costantino and Associates, New York, NY
3 Senior Structural Engineer, Carl J. Costantino and Associates, New York, NY
ABSTRACT
Current provisions of the American Society of Civil Engineers Standard 4 (DRAFT ASCE, 2013) have been balloted. These provision require the use of a suite of a minimum of five input acceleration time histories for development of seismic responses for linear elastic, time domain analyses, with the purpose of mitigating the potential for unconservative results that can occur due to a mismatch in phasing between a single input time history, and the phase of a complex-valued structural amplification (transfer) function. The criterion specifies that the mean response from five sets of input time histories from real, modified records shall be used unless the use of a single time history can be justified to produce responses consistent with the mean response computed from the suite of time history records.
As an alternative to using a suite of time histories and computing the mean response, the use of a single, random phase, time history record fit to the input design response spectrum is considered in this paper.
Structural responses in terms of In-Structure Response Spectra (ISRS) due to a single random phase record are compared to mean responses from multiple input time histories that are developed from real seed time histories. These comparisons are generated for a suite of 99 different structural amplification functions developed using various structure configurations..
The comparisons developed herein show that for the 99 different structural amplification functions of varying frequency content, amplitude and phasing considered, the use of a single random phase input time history produces ISRS consistent with the mean of five input time histories, thus producing ISRS consistent with the performance goal of ASCE 4. The use of random phase time histories is demonstrated to produce seismic demands consistent with the requirements of ASCE 4 for linear elastic systems that respond within the acceleration response region of the spectral frequency band. Analysis of structures incorporating non-linear behavior or structures sensitive to long period motions are not considered,
INTRODUCTION
Current draft provisions of the American Society of Civil Engineers Standard 4 (ASCE, 2013) require the use of five input acceleration time histories for development of seismic responses for linear elastic, time domain analyses. The purpose of this criterion is to mitigate the potential for unconservative results due to a mismatch in phasing between a single input time history and that of a phased structural amplification function, which has been shown to produce significant varied response relative to the target performance (Houston et al., 2010). The goal of ASCE 4 is to produce 80th percentile non-exceedance
seismic demands given a mean input motion. The standard specifies that the mean response due to five sets of input time histories shall be used unless the use of a single time history can be justified to produce responses consistent with the mean.
Structural responses are compared in terms of ISRS. These comparisons are generated for a suite of 99 structural amplification functions from various structures, and for all three orthogonal directions of response.
The goal of the response comparisons is to determine if the use of a single random phase time history produces responses consistent with the performance goal of ASCE 4 for linear, time domain dynamic analyses.
INPUT MOTIONS
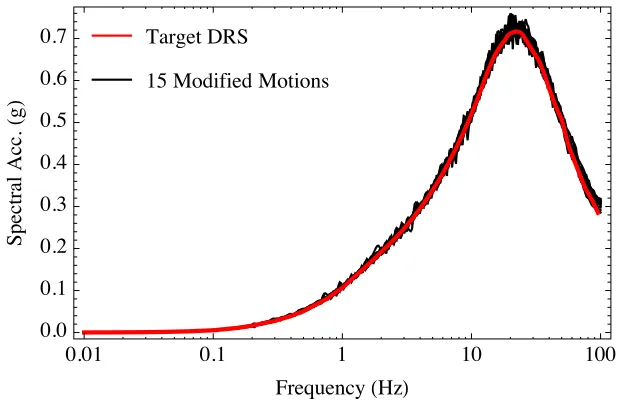
One target DRS is used as the input into this study. The DRS is representative of a Central Eastern United States spectral shape. Figure 1 shows the 5% damped DRS overlain on 15 response spectra that are developed by modifying real seed time histories to match the DRS. The seed time histories are selected following the procedures defined in ASCE 4 (ASCE, 2013), and modified to match the DRS by scaling of the Fourier components of the signal consistent with procedures defined in ASCE 43 (ASCE, 2005). The modified records maintain the phase content of the original seed motions.
The vertical DRS used in this study is equal to the horizontal DRS. Therefore, the input motions for all orthogonal directions of motion have the same DRS.
Figure 1. Input 5% Damped DRS and 15 Modified Motions from Real Records
Figure 2 shows the 5% damped acceleration response spectrum of the fitted motion that is developed using random phasing, whereby every frequency component of the Fourier transform has a phase angle selected at random between -180° and 180°.
7DUJHW '56
0RGLILHG 0RWLRQV
)UHTXHQF\�+]�
6SHFWUDO
$FF
�
J
Figure 2. Input 5% Damped DRS and Fitted Motion Using Random Phasing
STRUCTURAL RESPONSE
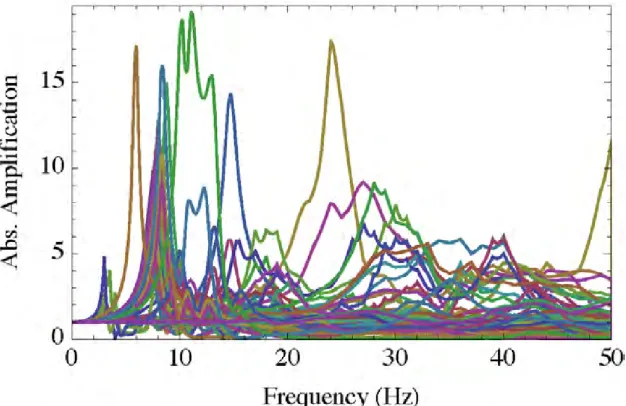
In order to assess the impact of the characteristics of input motions on structural response, complex response transfer functions from a Soil-Structure Interaction (SSI) analysis using the DRS shown in Figure 1, and the associated soil profiles, are used to develop time domain structural responses from the different input motions. Figure 3 shows 99 acceleration transfer functions from various structures, multiple locations and elevations within those structures, and for all three orthogonal directions of response. The transfer functions represent each orthogonal direction of response due to the coincident input direction (e.g., X response due to X input motion), for 33 different nodes in the SSI system.
Figure 3. Absolute Amplification of 99 SSI Acceleration Transfer Functions
Time domain structural response is obtained by multiplying the complex transfer function with the Fourier transform of the input motion on a component by component basis, performing an inverse
7DUJHW '56 5DQGRP 3KDVH )LW
)UHTXHQF\�+]�
6SHFWUDO
$FF
�
J
Fourier transform of the signal to obtain the response acceleration time history, and computing a 5% damped acceleration response spectrum.
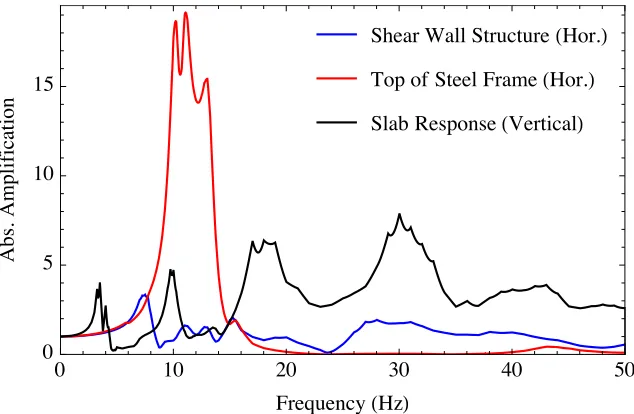
The study summarized herein uses all 99 transfer function shown in Figure 3. Results, representative of all transfer functions, are shown for three SSI transfer functions shown in Figure 4. The three transfer functions represent horizontal response at the roof level of a large shear wall structure, horizontal response at the top of a lightweight steel structure, and vertical response of a concrete slab.
Figure 4. Subset of SSI Transfer Functions
COMPARISON OF RESPONSE USING RANDOM PHASE AND MODIFIED SEED RECORDS
In this study, the mean ISRS computed from multiple time histories is considered the benchmark solution given that it follows current ASCE 4 procedures. A mean ISRS is computed for a single SSI transfer function from the mean response of 15 input motions developed from real, modified seed records fit to the DRS. Five source time histories were developed for the DRS for each orthogonal direction of input motion (2 horizontal and 1 vertical). Given that vertical and horizontal DRS are equal, using all 15 modified records for a single directional response provides a tighter confidence band on the mean estimate of response than using five time histories as per criteria of ASCE 4. It has been shown by Houston et al. (2010) that the characteristics of the source event associated with the seed record (e.g. magnitude, distance, direction), given a specified DRS, do not affect linear response. Therefore, no bias is introduced by using the 15 records to develop a mean response.
Figure 5 shows a comparison of ISRS due to a single random phase input motion and ISRS computed using real, modified input motions. The plots on the left side show the ISRS computed by 15 real, modified input motions with the mean response in red. The plots on the right side compare the mean of the modified records to the response of a single input time history developed with random phasing.
As observed in Figure 5, response from a single random phase input time history compares very well to that of the mean response from 15 real, modified input time histories. The process of modification of real recorded motions to fit the DRS maintains the phasing of the original seed record. Variability of in-structure response between the different real, modified input time histories reflects the relation of phasing of the input motion to the phase of the transfer function for the structure. For instance, if a response transfer function is in-phase with the input motion at a given frequency, then the in-structure response will be higher than if it is out-of-phase. This is the primary cause of response variability in linear time history analyses.
Shear Wall Structure�Hor.�
Top of Steel Frame�Hor.�
Slab Response�Vertical�
0 10 20 30 40 50
0 5 10 15
Frequency�Hz�
A
bs
.
A
mplif
The phase of a time history is generally considered a random parameter. In other words, the phase of a time history at any given frequency is not correlated to the phase of another record at that same frequency. Thus, given a specific phase of a transfer function, averaging the response from multiple time history inputs serves to minimize the effect of the phase of the input motion. As a surrogate for this effect, because convolution of the transfer function with the Fourier transform of an input motion acts as a smoothing filter, a single time history with random phasing can replicate the effect of averaging multiple time histories.
The reliability of the random phase input to reproduce the mean response is quantified through a statistical analysis of the ISRS. Based on the 15 responses produced by the real input motions, a 95% Confidence Interval (CI) is computed at every spectral frequency, for every transfer function. The CI is computed based on a normal distribution. The assumption of a normal distribution was shown to be appropriate for the range of ISRS computed from the 15 modified records.
Figure 6 shows comparisons of random phase response to the 95% CI band on the mean estimate due to 15 input time histories, as well as the spectral ratio of random phase to mean ISRS. The three responses shown in Figures 5 and 6 are representative of what is observed for all 99 SSI transfer function responses.
Based on the statistical comparisons of Figure 6, representative of the full suite of ISRS not presented here, it is concluded that the ISRS produced from a single random phase input motion reliably tracks the 95% CI of the mean estimate. In other words, generally there is 97.5% probability that the random phase response is equal to or greater than the lower CI of the mean estimate.
The random phase ISRS does fall outside of the confidence band at some narrow banded frequency ranges associated with peaks and valleys of the ISRS. However, the benchmark mean ISRS is inherently smoothed by the averaging process, whereas the response due to a single motion is expected to produce more jagged ISRS. Also, the CI described in this paper is computed from 15 records. The criterion is that ISRS be produced from the mean of 5 record, thus, the CI shown in Figure 6 is narrower, and thus more conservative than what would be produced from the current procedures using only five records.
Figure 5. Comparison of Mean and Random Phase 5% Damped ISRS
15�5� Damped ISRS from Fitted Motions Random Phase Response vs. Mean Response
Shear Wall Roof � Hor . � Indiv. Modified
Mean of Modified
1 2 5 10 20 50
0.0 0.2 0.4 0.6 0.8 1.0 1.2 1.4
Frequency�Hz�
S pectr al A cc . � g � Random Phase
Mean of Modified
1 2 5 10 20 50
0.0 0.2 0.4 0.6 0.8 1.0 1.2
Frequency�Hz�
S pectr al A cc . � g � Steel Frame � Hor .
� Indiv. Modified
Mean of Modified
1 2 5 10 20 50
0 2 4 6 8
Frequency�Hz�
S pectr al A cc . � g � Random Phase
Mean of Modified
1 2 5 10 20 50
0 2 4 6 8
Frequency�Hz�
S pectr al A cc . � g � Concrete Slab � Vertical � Indiv. Modified
Mean of Modified
1 2 5 10 20 50
0 1 2 3 4
Frequency�Hz�
S pectr al A cc . � g � Random Phase
Mean of Modified
1 2 5 10 20 50
0 1 2 3 4
Frequency�Hz�
Figure 7. Comparison of Random Phase Response to Confidence Interval on Mean Response
CONCLUSION
This paper describes the results of a study on the impact of using a single input motion produced with random phasing on computing responses consistent with performance goals of ASCE 4. Current draft provisions of ASCE 4 require the use of five input acceleration time histories for development of seismic responses for linear elastic, time domain analyses, with the purpose of mitigating the potential for unconservative results due to a mismatch in phasing between a single input time history and that of a phased structural amplification function. The criterion specifies that the mean response due to five sets of
Out[90]//TableForm=
Random Phase ISRS vs. 95� CI Spectral Ratio of Random Phase To Mean ISRS
Shear Wall Roof � Hor . � Random Phase
Mean���95�CI
1 2 5 10 20 50
0.0 0.2 0.4 0.6 0.8 1.0 1.2
Frequency�Hz�
S pectr al A cc . � g �
Spectral Ratio of Random Phase:Mean
90�Spectral Ratio
1 2 5 10 20 50
0.0 0.2 0.4 0.6 0.8 1.0 1.2
Frequency�Hz�
S pectr al A cc . � g � Steel Frame � Hor .
� Random Phase
Mean���95�CI
1 2 5 10 20 50
0 2 4 6 8
Frequency�Hz�
S pectr al A cc . � g �
Spectral Ratio of Random Phase:Mean
90�Spectral Ratio
1 2 5 10 20 50
0.0 0.2 0.4 0.6 0.8 1.0 1.2
Frequency�Hz�
S pectr al A cc . � g � Concrete Slab � Vertical � Random Phase
Mean���95�CI
1 2 5 10 20 50
0 1 2 3 4
Frequency�Hz�
S pectr al A cc . � g �
Spectral Ratio of Random Phase:Mean
90�Spectral Ratio
1 2 5 10 20 50
0.0 0.2 0.4 0.6 0.8 1.0 1.2
Frequency�Hz�
input time histories from real, modified records shall be used unless the use of a single time history can be justified to produce responses consistent with the mean.
Structural responses in terms of In-Structure Response Spectra (ISRS) due to a single random phase record are compared to mean ISRS computed from multiple input time histories that are developed from real seed time histories. These comparisons are generated for a suite of 99 structural amplification functions from various structures, and for all three orthogonal directions of response.
The comparisons developed herein show that for the wide range (99) of different structural amplification functions of varying frequency content, amplitude and phasing, the use of a single random phase input time history produces ISRS consistent with the mean of five input time histories, thus producing ISRS consistent with the performance goal of ASCE 4. The comparisons were presented relative to statistical estimates of mean response, as well as procedures implemented within the ASCE Standard.
The use of random phase time histories, as implemented, is not intended for use in nonlinear seismic analysis without further justification, or for systems that respond outside of the acceleration dominated response region of the spectral frequency band (ie., structures sensitive to long period motions such as liquid storage tanks).
REFERENCES
American Society of Civil Engineers. (2005). ASCE Standard 43: Seismic Design Criteria for Structures, Systems, and Components in Nuclear Facilities. Reston, Virginia, USA.
American Society of Civil Engineers. (2013). DRAFT ASCE Standard 4: Seismic Analysis of Safety-Related Nuclear Structures and Commentary. Reston, Virginia, USA.