Numerical Simulation of Cantilever Beam
with Multiple Cracks Using Neural Networks
and Multiple Regression Analysis Tool
Chappa. Santosh Kumar1, M.Y.Prasada Rao2, L.V.V.Gopala Rao3, Dilleswararao.Chintala4
P.G Student, Department of Mechanical Engineering, MVGR College of Engineering, Vizianagaram, India1 Assistant Professor, Department of Mechanical Engineering, MVGR College of Engineering, Vizianagaram, India2 Associate Professor, Department of Mechanical Engineering, MVGR College of Engineering, Vizianagaram, India,3
Lecturer, Department of Mechanical Engineering, MRAGR Government Polytechnic, Vizianagaram, India4 ABSTRACT: In recent years, intense research on the detection of crack using the vibration based techniques has been done and various approaches have been developed by researchers. The work reported in this paper is part of an ongoing research on the experimental investigations of the effects of cracks and damages on the integrity of structures, with a view to detect, quantify, and determine their extents and locations .In the present study, vibration analysis is carried out on a cantilever beam with two open transverse cracks, to study the response characteristics Suitable boundary condition are used to find out natural frequency and mode shapes. The simulations have done with the help of ANSYS14.0 software. A neural network for the cracked structure is trained to approximate the response of the structure by the data set prepared for various crack sizes and locations. Feed-forward multi-layer neural networks trained by back-propagation are used to learn the input (the location and depth of a crack)-output (the structural natural frequencies) relation of the structural system. With this trained neural network minimizing the difference from the measured frequencies and also carried out Multiple Regression Analysis to learn input-output relation in similar fashion. A comparative study is performed to check the crack depth and location effects on natural frequencies for beams of rectangular and I cross section. It is verified from the present analysis that the presence of crack decreases the natural frequency of vibration. The mode shapes also changes considerably due to the presence of crack. The frequency of the cracked cantilever beam decreases with increase in the crack depth for the all modes of vibrations.
KEYWORDS:Crack Detection, Natural frequency, Neural Networks, Multiple Regression Analysis.
I. INTRODUCTION
the dynamic behaviour of the whole structure as a result the reduction occurs in natural frequency and mode shape. By considering the changes in those parameters crack can be identified in terms of crack depth and crack location.
II. RELATEDWORK
Crack damage leads to reduction in stiffness also with an inherent reduction in natural frequency. Kaushar H. Barad et. al. [1] presented a method for detection of crack in cantilever beam which is based on frequency measurement. Experimental method and finite element method is used to analyse modal parameters of the cracked cantilever beam by D.K.Agarwal and D.R.Parhi [3].Irshad A Khan and Dayal R Parhi [4] studied the vibration characteristics of cantilever beam with two cracks. Two types of beams are considered for study i.e. cantilevers beam and fixed-fixed beam. Dong Wei et. al. [5] proposed analytical method for solving the free vibration of cracked functionally graded material (FGM) beams with axial loading, rotary inertia and shear deformation. Yoona Han-Ik et al.[6] have investigated the influence of two open cracks on the dynamic behaviour of a double cracked simply supported beam both analytically and experimentally. In all previous studies, the effects of both the crack and the load on the natural frequency of rectangular beams were studied, in the present study, vibration analysis is carried out on beam of I cross section and made comparison with rectangle beam. It has been reported that ANN approach can be applied to damage detection [7], because neural networks can be trained to recognise given patterns and to classify other untrained patterns [9]. ANN technique based on vibration characteristics have been used for damage identification in different structures, such as beam structure [8].
III. METHODOLOGY
In the present work, vibration analysis is carried out on a cantilever Aluminium beam with two open transverse cracks. The study is aimed at detecting the size and location of crack in cantilever beam. Free vibration finite element analysis of crack free beam and a series of cracked beams are performed. Suitable boundary conditions are used to find out natural frequencies and mode shapes. The simulations have done with the help of ANSYS 14.0 software. Comparison studies are performed on natural frequencies and mode shapes of cracked and cracked free beam. Identification of crack depth and its location is determined by two different methods, namely, ANN analysis and Multiple Regression analysis.
IV. FINITE ELEMENT ANALYSIS
Finite element model of a cantilevers beam with two open transverse cracks are developed in ANSYS environment. The dimensions of the beam are shown in Fig.1 Material properties of the beam are shown in Table. In order to perform modal and structural analysis of the beam is performed following the steps outlines below.
V. MODALANALSIS
Following steps show the guidelines for carrying out Modal analysis Define Materials:
1.Set preferences. (Structural) 2.Define constant material properties. Model the Geometry:
3. Create the geometry Generate Mesh:
4.Define element type. Mesh the area. Apply Boundary Conditions:
5.Apply constraints to the model. Obtain Solution:
6.Specify analysis types and options. 7. Solve.
Table Beam Characteristics
BEAM
Density (Kg/m3)
Poisson Ratio
Elastic Modulus
(N/m2)
Length (m)
Depth (m)
Thickness (m)
inner face height
(m)
Width (m)
Flange thickness
(m)
Web thickness
(m) RECTANGULUR 2713 0.334 0.724x10^11 0.8 0.05 0.006 ‾ ‾ ‾ ‾
I-SECTION 2713 0.334 0.724x10^11 0.8 ‾ ‾ 0.02 0.02 0.005 0.005
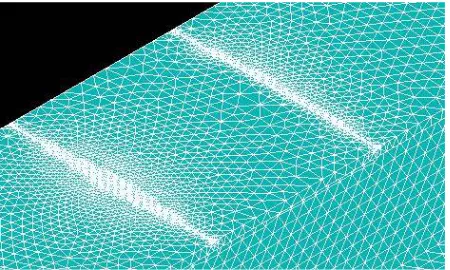
Finite element software, ANSYS version 14 is used for free vibration analysis of the crack free and cracked beams. Beam length, thickness and depth are along X axis, Y axis and Z axis respectively in ANSYS coordinate system. A 20-node three dimension structural solid element under SOLID 186 was selected to model the beam because it is suitable for all structural analysis and it is mid node element which gives the more accurate result. Fig shows finite element model of a cracked beam. The modal analysis of cracked and crack free beams are performed. The Block Lanczons mode extraction method is used to calculate the natural frequencies of the beam. The corresponding mode shapes for both cracked and cracked free beam are also captured. The displacement values are used as a numerical data of ANN and Multiple Regression Analysis tool for subsequent identification of crack length and location of the beam.
Fig.3 Fig.4 Fig.5
Fig.3 First mode of vibration,a1/w=0.5, a2/w=0.5, L1/L=0.35, L2/L=0.4
Fig.4 Second mode of vibration,a1/w=0.5, a2/w=0.5, , L1/L=0.35, L2/L=0.4
Fig.5 Third mode of vibration,a1/w=0.5, a2/w=0.5, , L1/L=0.35, L2/L=0.4
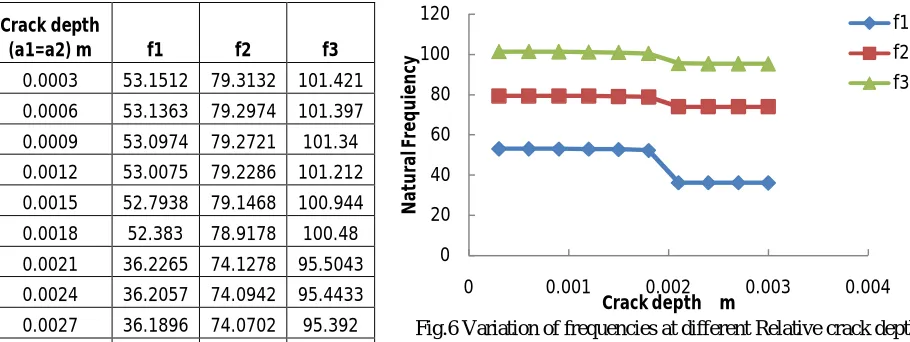
Table. Variation of frequencies at different Relative crack depths when Relative Crack location at L1/L=0.28,
L2/L=0.32.
Fig.6 Variation of frequencies at different Relative crack depths
VI. ARTIFICIAL NEURAL NETWORKS APPROACH
The Artificial Neural Network (ANN) technique is a different approach. It is inspired in the brain information processing through a much interconnected parallel structure. It does not involve governing equations but it needs a training set of data. The knowledge of the ANN is then acquired through a learning process in which both input and output (desired) data is supplied to the network. The so-called Multi-layer Perceptron architecture consists of a first layer with the input vector, a final layer with the output vector and intermediate layers (known as hidden layers) that link to the other layers through weighted connections. A simple representation of an ANN with a single hidden layer is depicted in Fig.7 In this work, a single hidden layer and the back-propagation training algorithm are used. The results of the frequency values for all the studied cases, as described in previous Section .As is usual, a portion of the data is chosen randomly to train the ANN (training set to fit the weights), and the other portion (15%) to validate the data. The clamped-free beam of Figure 1 has a length of L=0.8 m, Inner face height of the beam =0.02 m, Flange width of the beam = 0.02 m, Flange thickness of the beam = 0.005 m, Web thickness of the beam = 0.005 m the material properties are E = 0.724x10¹¹ N/m2, Poisson’s ratio = 0.334, ρ= 2713 kg/m3. For the preparation of the learning data, 10 sets of a crack depths a1=a2=0.0003to 0.003m (step size=0.0003m) are introduced at the 17 different crack locations
0 20 40 60 80 100 120
0 0.001 0.002 0.003 0.004
N
a
tu
ra
l F
re
q
u
ie
n
cy
Crack depth m
f1 f2 f3
Crack depth
(a1=a2) m f1 f2 f3
0.0003 53.1512 79.3132 101.421
0.0006 53.1363 79.2974 101.397
0.0009 53.0974 79.2721 101.34
0.0012 53.0075 79.2286 101.212
0.0015 52.7938 79.1468 100.944
0.0018 52.383 78.9178 100.48
0.0021 36.2265 74.1278 95.5043
0.0024 36.2057 74.0942 95.4433
0.0027 36.1896 74.0702 95.392
L1=0.04 to 0.68m (step size=0.04m) and L2=0.08 to 0.72m (step size=0.04m). Totally 170 cases or patterns (10 different crack depths and 17different crack locations) are solved for the first three frequencies. The patterns which consist of 170 sets of data are used to train the neural network of Figure .Because of the nature of the sigmoid activation function, i.e., saturation function, the output variables should be scaled by the user, to be within the most active range of the sigmoid function. Scaling rule that minimum and maximum values are set to 0.1 and 0.9 is usually suggested. Through some trials, a network with neuron arrangement (input-hidden-output) of 4-13-3 trained with 8 iterations for the 170 patterns are concluded to be the best for our application.
Mean-square error (MSE) is employed as a measurement of modelling performance. The mathematical expression can be described as follows:
MSE =
∑
N i=1 (ei)2N
Where ei denotes an error at pattern i and N is the total number of patterns.
Fig.7 Three-layer neural network with neuron arrangement of 4-13-3.
VII. MULTIPLE REGRESSION
A statistical tool that allows you to examine how multiple independent variables are related to a dependent variable. Once you have identified how these multiple variables relate to your dependent variable, you can take information about all of the independent variables and use it to make much more powerful and accurate predictions about why things are the way they are. This latter process is called “Multiple Regression”.
The Formula for Multiple Regression: Y=a+b1X1+b2X2
Y = A predicted value of Y (which is dependent variable) a =The”Y intercept”
b1=The change in Y for each 1 increment change in X1
b2=The change in Y for each 1 increment change in X2
X 1= Independent Variable 1
VIII. RESULTS ANDDISCUSSIONS
Table: Variation in Natural frequency in cantilever beam of I-cross section Without crack and crack at depth a1=a2=0.0021,Location at L1=0.04,L2=0.08.
The first, second and third natural frequencies corresponding to various crack locations and depths are obtained from the modal analysis of the beam in ANSYS environment, the frequency of the cracked cantilever beam decreases when compared with cantilever beam without crack.
Table.Variation of frequencies at different Relative crack lengths when Relative Crack depth at a1=a2=0.0012
S.NO
CRACK
DEPTH L1 L2
ANSYS ANN MRA
F1 F2 F3 F1 F2 F3 F1 F2 F3 1 0.0012 0.04 0.08 52.6796 78.895 100.74 53.667 79.3176 101.428 44.88111 76.6115 96.6506 2 0.0012 0.08 0.12 52.7478 78.895 100.83 53.717 79.3193 101.439 45.6098 76.8389 97.105 3 0.0012 0.12 0.16 52.8165 79.065 100.93 53.752 79.3203 101.454 46.3385 77.0664 97.5593 4 0.0012 0.16 0.2 52.8639 79.117 101 52.941 78.888 100.182 47.06719 77.2938 98.0136 5 0.0012 0.2 0.24 52.9225 79.165 101.08 52.985 79.1369 100.747 47.79588 77.5213 98.4679 6 0.0012 0.24 0.28 52.9675 79.203 101.15 53.073 79.1584 100.895 48.52458 77.7487 98.9222 7 0.0012 0.28 0.32 53.0075 79.229 101.21 53.178 79.1189 100.959 49.25327 77.9761 99.3765 8 0.0012 0.32 0.36 53.0438 79.255 101.27 53.285 79.0914 101.013 49.98196 78.2036 99.8308 9 0.0012 0.36 0.4 53.0741 79.266 101.3 53.382 79.1087 101.074 50.71065 78.431 100.285 10 0.0012 0.4 0.44 53.1022 79.28 101.35 53.463 79.1561 101.136 51.43935 78.6585 100.739 11 0.0012 0.44 0.48 53.1209 79.286 101.38 53.514 79.2088 101.193 52.16804 78.8859 101.194 12 0.0012 0.48 0.52 53.1382 79.295 101.41 53.575 79.2528 101.244 52.89673 79.1133 101.648 13 0.0012 0.52 0.56 53.1505 79.3 101.43 53.621 79.2829 101.288 53.62543 79.3408 102.102 14 0.0012 0.56 0.6 53.1608 79.304 101.44 53.616 79.3007 101.325 54.35412 79.5682 102.557 15 0.0012 0.6 0.64 53.1681 79.311 101.45 53.655 79.3107 101.353 55.08281 79.7957 103.011 16 0.0012 0.64 0.68 53.1743 79.326 101.47 53.704 79.3167 101.377 55.81151 80.0231 103.465 17 0.0012 0.68 0.72 53.1794 79.333 101.48 53.743 79.3211 101.402 56.5402 80.2506 103.92
Totally 170 cases or patterns (10 different crack depths and 17different crack locations) are solved for the first three frequencies. The patterns which consist of 170 sets of data are used to train the neural network and for Multiple regression analysis.
Natural
Frequency Without crack With crack
Fig.8: Comparision of the first estimated natural frequencies from the neural network to target values
Fig.9: Comparison of the Second estimated natural frequencies from the neural network to target values
Fig.10: Comparision of the Third estimated natural frequencies from the neural network to target value
0 0.2 0.4 0.6 0.8 1 1.2
0 50 100 150 200
N
o
rm
a
lis
e
d
f1
Pattern Number
Target Value Estimated Value
0.88 0.9 0.92 0.94 0.96 0.98 1 1.02
0 50 100 150 200
N
o
rm
al
is
e
d
f2
Pattern Number
Target Value Estimated Value
0.8 0.85 0.9 0.95 1 1.05
0 50 100 150 200
N
o
rm
al
is
e
d
f3
Pattern Number
Fig.11: Comparision of the First estimated natural frequencies from the MRA to target values
Fig.12: Comparision of the Second estimated natural frequencies from the MRA to target values
Fig.13: Comparison of the Third estimated natural frequencies from the MRA to target values
The estimated natural frequencies from the network are compared to the target values as shown in Fig.8-10. The estimated natural frequencies from the multiple regression analysis are compared to the target values as shown in
0 0.2 0.4 0.6 0.8 1 1.2
0 50 100 150 200
N
o
rm
al
is
e
d
f1
Pattern Number
Target Value Estimated Value
0.88 0.9 0.92 0.94 0.96 0.98 1 1.02
0 50 100 150 200
N
o
rm
al
is
e
d
f2
Pattern Number
Target Value Estimated Value
0.8 0.85 0.9 0.95 1 1.05
0 50 100 150 200
N
o
rm
al
is
e
d
f3
Pattern Number
Fig.11-13. The target values are f1*, f2* and f3* in Fig.7 which are the reference data or training data to have trained the neural network. One hundred and seventy patterns are arranged in 10 separate curves base on the value of a as shown in the Fig.8 shows the first natural frequency f1 is monotonously increasing as the crack location moves from the clamped end to the free end when the crack depth a1=a2 is kept constant. On the other hand, the second and the third natural frequencies oscillate under the same situation as shown in Fig.9 and Fig.10.
Fig.14: Neural network output
IX. CONCLUSION
The frequency of the cracked cantilever beam decreases with increase in the crack depth for the all modes of vibration. For same amount of material cantilever beam of I cross-section has more dynamic stability than beam of rectangular cross section. Feed-forward multi-layer neural networks trained by back-propagation are used to learn the input (the location and depth of a crack)-output (natural frequencies) relation of the structural system. From neural network training, the first natural frequency f1 is monotonously increasing as the crack location moves from the clamped end to the free end when the crack depth a1=a2 is kept constant. On the other hand, the second and the third natural frequency oscillate under the same situation. The first MSE is 0.12728, second MSE is 0.0022062 and third MSE is 0.001769. A neural network for the cracked structure is trained to approximate the response of the structure by the data set prepared for various crack sizes and locations. Training data to train the neural network are properly prepared. Multiple Regression Analysis is also carried for the data obtained from the Modal analysis to learn the relation between natural frequencies and crack location and crack depth. ANN is the more powerful tool than MRA and it predict the cack location and depth to natural frequencies and vice-versa.
REFERENCES
[1] Barad, Kaushar, Sharma.D.S, Vyas, Vishal,” Crack Detection in Cantilever Beam by Frequency based Method”, Procedia Engineering,vol.51, 2013, pp. 770-775.
[2] H. Tada, P.C. Paris, G.R. Irwin, “The Stress Analysis of Cracks Handbook”, third edition, ASME Press, Professional Engineering Publishing, New York, 2000
[3] D.K. Agarwalla, D.R. Parhi, “Effect of Crack on Modal Parameters of a Cantilever Beam Subjected to Vibration”, Procedia Engineering, vol. 51,2013, pp.665 – 669.
[4] Irshad A Khan, Dayal R Parhi, “Finite Element Analysis of Double Cracked Beam and its Experimental Validation”, Procedia Engineering, vol. 51, 2013, pp. 703 – 708.
[5] Dong Wei, YinghuaLiu, Zhihai Xiang, “An analytical method for free vibration analysis of functionally graded beams with edge cracks”,Journal of Sound and Vibration, vol. 331, 2012, pp.1686–1700.
0.001 0.01 0.1 1 10 100
1 11 21 31 41 51
M
e
an
S
q
u
ar
e
E
rr
o
r
Cycles
[6] Han-Ik Yoona, In-Soo Sona, Sung-Jin Ahn, “Free Vibration Analysis of Euler-Bernoulli beam with double Cracks”, Journal of Mechanical Science and Technology, 21, 2007, pp. 476-485.
[7] Liu SW, Huang JH, Sung JC, Lee CC (2002) Detection of cracks using neural networks and computational mechanics. Computational Methods Applied Mechanical Engineering,vol.191(25):2831–2845.
[8] Marwala.T,Hunt.H, “Fault identification using finite element models and neural networks”.Mechanical Systems and Signal Processing,vol.13(3), 1999 ,pp.475–490.
[9] Yun.C.B, Bahng. E.Y, “Substructural identification using neural networks”,Computers & Structures ,vol.77(1), 2000,pp.41–52.
[10] T.G. Chondros, A.D. Dimarogonas, J. Yao,” A continuous cracked beam theory”, Journal of Sound and Vibration,vol. 215 (1),1998,pp. 17– 34.
[11] Haykin S. “Neural Networks: A comprehensive Foundation”, Pearson Edition Asia, 2002. [12] Singiresu S. Rao, “Mechanical vibrations”, Pearson education ,2007.
[13] Rosales, M. B., Filipich, C.P. and Buezas, F.S ,” Crack detection in beam-like structures”, Engineering Structures,vol. 31, 2009, pp.2257-2264.