DOI: 10.1534/genetics.108.087023
Adaptive Evolution of the Insulin Two-Gene System in Mouse
Meng-Shin Shiao,*
,†,1Ben-Yang Liao,*
,3Manyuan Long
†,2and Hon-Tsen Yu*
,2,4*Institute of Zoology and Department of Life Science, National Taiwan University, Taipei 106, Taiwan, Republic of China and†Department of Ecology and Evolution, University of Chicago, Chicago, Illinois 60637
Manuscript received January 13, 2008 Accepted for publication January 14, 2008
ABSTRACT
Insulin genes in mouse and rat compose a two-gene system in which Ins1was retroposed from the partially processed mRNA ofIns2. WhenIns1originated and how it was retained in genomes still remain interesting problems. In this study, we used genomic approaches to detect insulin gene copy number variation in rodent species and investigated evolutionary forces acting on both Ins1 and Ins2. We characterized the phylogenetic distribution of the new insulin gene (Ins1) by Southern analyses and confirmed by sequencing insulin genes in the rodent genomes. The results demonstrate that Ins1
originated right before the mouse–rat split (20 MYA), and both Ins1 and Ins2 are under strong functional constraints in these murine species. Interestingly, by examining a range of nucleotide polymorphisms, we detected positive selection acting on both Ins2and Ins1 gene regions in the Mus musculus domesticus populations. Furthermore, three amino acid sites were also identified as having evolved under positive selection in two insulin peptides: two are in the signal peptide and one is in the C-peptide. Our data suggest an adaptive divergence in the mouse insulin two-gene system, which may result from the response to environmental change caused by the rise of agricultural civilization, as proposed by the thrifty-genotype hypothesis.
S
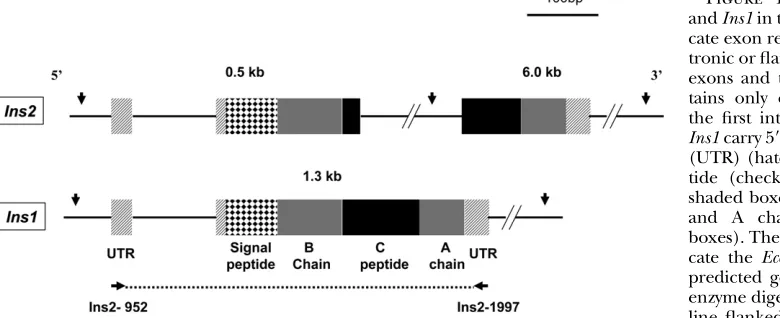
EVERAL mechanisms have been proposed to be involved in the retention of duplicate genes in genomes (Forceet al.1999; Lynchand Conery2000; Longet al.2003; Shiuet al.2006). Yet, how retrogenes evolve with their parental genes remains an interesting question. Preproinsulins (insulin genes), with critical functions relating to the pathogenesis of diabetes, pro-vide a valuable system to investigate this issue. In con-trast to other mammals studied to date,i.e., human and guinea pig (Chanet al.1984), in which one copy of the insulin gene (Ins) was found, insulin genes in mouse and rat form a two-gene system (Soares et al. 1985; Wentworthet al.1986). The two-gene system is com-posed of preproinsulin 2 (Ins2), an ortholog to the insulin genes in the other mammals, and preproinsulin 1 (Ins1), a rodent-specific retrogene.Ins2andIns1are expressed in the pancreas and both encode proinsulin peptides composed of four parts: signal peptide, B chain, C-peptide, and A chain. Ins1 was identified as originating from a reverse-transcribed partiallypro-cessed mRNA of Ins2and thus retains only one of the two introns, which is homologous to the first intron of Ins2 (Figure 1) (Soareset al.1985; Wentworthet al. 1986). Contrary to the origins of most retrogenes,Ins1 carries homologous regulatory regions with Ins2 from aberrant transcription;i.e., the mRNA was transcribed from the upstream region ofIns2and thus the transcript includes the gene itself and the regulatory regions. In the mouse genome, these two insulin genes are located on different chromosomes, chromosome (ch)7 (Ins1) and ch19 (Ins2) (Wentworthet al.1986; Davieset al. 1994), while in rat they are on the same chromosome (ch1) but are.100 Mb apart (Soareset al.1985).
Recent knockout experiments with nonobese diabetic (NOD) mice revealed that these two insulin genes have different null phenotypes related to the etiology of dia-betes (Chentoufiand Polychronakos2002; Moriyama
et al.2003; Thebault-Baumontet al.2003; Jaeckelet al. 2004; Nakayama et al. 2005; Babaya et al. 2006). The differing phenotypes between Ins2 and Ins1 knockout NOD mice imply a functional divergence between these two genes. First, without the presence ofIns2alleles,Ins1 -carrying mice (Ins11/1
,Ins2/andIns11/,Ins2/) were inflicted with insulin deficiency that accelerated the onset of type 1 diabetes, particularly in the male NOD mice. In contrast, no decrease in insulin content was detected in mice carrying Ins2 alleles (Ins1/
, Ins21/
or Ins1/ , Ins21/1) (Babaya
et al.2006). These observations suggest that the retrogene,Ins1, might exert some negative effects that worsen the diabetic syndrome. Moreover, Ins2 and
Sequence data from this article have been deposited with the EMBL/ GenBank Data Libraries under accession nos. DQ448046–DQ448123 and DQ250563–DQ250572.
1Present address:The Jackson Laboratory, Bar Harbor, ME 04609. 2These authors contributed equally to this work.
3Present address: Department of Ecology and Evolutionary Biology,
University of Michigan, Ann Arbor, MI 48109.
4Corresponding author: Institute of Zoology and Department of Life
Science, National Taiwan University, Taipei 106, Taiwan, Republic of China. E-mail: [email protected]
Ins1were observed to behave differently under hormone stimulation in rats (Kakitaet al.1982). The nature of the null phenotypes of the insulin two-gene system provides a valuable system for investigating the origin of new genes in association with the common disease, diabetes. However, the evolution ofIns1remains unknown. Two questions are of immediate interest: (i) When didIns1originate and diverge in function from the parental gene,Ins2?, and (ii) Given the seemingly deleterious nature of theIns1gene, what selection mechanisms were involved in the origins and evolution?
Despite early sporadic data from insulin genes (Beintema and Campagne 1987), the lack of experi-mental testing of the actual copy number of insulin genes in rodents has made it difficult to understand the dis-tribution ofIns1in rodents. To elucidate the above ques-tions, we first conducted a phylogenetic survey of the distribution ofIns1andIns2in the rodent family Muridae by genomic Southern analyses. Muridae, to which mice and rats belong, is a large family with.1300 species and has been divided into12 subfamilies (e.g., Michaux
et al.2001). We examine insulin genes by selecting taxa progressively moving away from mouse and rat, including taxa from subfamilies Murinae, Gerbillinae, Cricetinae, and Arvicolinae. Second, to vary theIns1signals detected by the genomic Southern analysis, we sequenced insulin genes in several rodent species by PCR cloning and se-quencing. We further investigated the functional con-straint on bothIns2andIns1by examiningKa/Ksratios
among species. Finally, we identified selection mecha-nisms acting on this insulin two-gene system by analyz-ing distributions of polymorphism in the house mouse populations.
MATERIALS AND METHODS
DNA samples:Genomic DNA was extracted from a total of nine murid species in this study. All were wild caught in Taiwan, except as noted. Their taxonomic affiliations are as follows. Five species are in the murid subfamily Murinae:Mus
musculus(C57BL/6),M. caroli,Rattus losea,Apodemus semotus, andNiviventer coxingi. One species,Meriones unguiculatus(from a pet shop), is in the subfamily Gerbillinae. One species,
Mesocricetus auratus (from a pet shop), is in the subfamily Cricetinae. Two species,Eothenomys melanogasterandMicrotus kikuchii, are in the subfamily Arvicolinae.
Samples of house mouse natural populations,M. musculus domesticus, were collected from France and Germany (Ihle et al.2006). Nineteen individuals are used in this study. The final sample sizes for various gene regions shown in Table 2 vary because of the failures of the PCR amplification or sequencing for certain samples due to the likely mutations in the primer regions. However, even the small sample sizes in these gene regions ($12) are adequate for estimating pop-ulation genetic parameters, according to the sampling theory of Tajima(1989). In addition, we pooled two populations for analyses because there is no evidence of significant divergence in the two particular insulin loci and the flanking regions½Hst values (Hudsonet al.1992) are 0.06 (not significant) and 0.00 (not significant) for the gene regions of Ins1 and Ins2, respectively, and 0.00 (not significant) and 0.09 (not signifi-cant, with the Bonferroni correction of multiple tests) for the flanking regions ofIns1andIns2, respectively.
Southern-blot analysis and PCR sequencing: We prepared genomic DNA with a phenol/chloroform extraction of tissues that had been treated with proteinase K and RNase A. Genomic DNA was digested withEcoRI andBamHI, respectively, and the representative images from one of the enzyme digestions in each species are shown in Figure 2B. Digested DNA was sep-arated on a 0.8% agarose gel with 0.53TBE buffer and trans-ferred to nylon membranes. Probes labeled with½a-32PdCTP were hybridized to the nylon membranes to confirm copy numbers in different species. The probes were amplified from
M. musculus Ins1using primersIns2-952 (59-ACC ACC AGC CCT AAG TGA TCC GCT A-39) andIns2-1997 (59-AAG GTT TTA TTC ATT GCA GAG GGG T-39) (the probe region is shown in Figure 1). Primers were designed specific toIns2, which differs fromIns1by two nucleotides withinIns2-952 and one nucleo-tide withinIns2-1997.
To obtain sequences of insulin genes,i.e., insulin genes in the rodent species and the mouse populations, we cloned the PCR product followed by sequencing at least three clones. Only identical nucleotides between these clones were selected for the evolutionary analysis. Although the genes are on the autosomes (chromosomes 7 and 19) and may have heterozygote sites, we chose only one allele from each diploid individual.
Evolutionary analysis:PCR products corresponding toIns2
andIns1were amplified by theIns2-952andIns2-1997primers Figure 1.—Gene structure of Ins2 andIns1in the house mouse. Boxes indi-cate exon regions; solid lines indiindi-cate in-tronic or flanking regions.Ins2has three exons and two introns, while Ins1 con-tains only one intron homologous to the first intron of Ins2. Both Ins2 and
fromM. caroli,R. losea,A. semotus, andN. coxingi, as well as a single product,Ins, fromMer. unguiculatusand Mi. kikuchii. TheIns2-952andIns2-1997primers were designed from the transcripts in the conserved regions and are able to amplify homologous genes in other rodent species. The PCR products of these insulin genes were then cloned from six rodent species followed by sequencing. For the insulin genes of each species, we sequenced at least three clones to eliminate PCR or sequencing errors. Sequences were analyzed only when they appeared identically in at least two clones.Ins2andIns1genes in the house mouse (M. musculus) and the rat (R. norvegicus) were retrieved from GenBank (accession nos. X04724, X04725, J00748, and J00747). The outgroup, human (Homo sapiens) insulin gene,INS, was also retrieved from GenBank (accession no. X70508).
Coding regions of preproinsulin genes from human and various rodent species and sequence data sets obtained from
Ins2andIns1in the house mouse population were aligned by
Clustal W version 1.83 (Thompsonet al.1994). To analyze the phylogenetic relationship of the two insulin genes andIns2
homologous ancestral genes,Ins, in other rodents, we used coding-region sequences to reconstruct a neighbor-joining tree implemented in MEGA3 (Kumaret al.2004) with 1000 bootstrap repeats. The functional constraints were estimated byKa/Ksratios implemented in PAML (Yang1997). The es-timated pairwise Ka/Ks ratios were calculated between the eight rodent species, including six species carrying bothIns2
andIns1and two species carryingIns. Twice the log-likelihood difference between the estimated Ka/Ksratio and the fixed Ka/Ksratio (¼1) was compared with a x2-distribution with d.f.¼1 to test whether the estimatedKa/Ksratio was signifi-cantly,1. We eliminated those ratios with extremely smallKs values to reduce stochastic bias.
The spectra of distribution of allele frequencies at segre-gating sites½i.e., Tajima’sD(Tajima1989) and Fu and Li’sD (Fuand Li1993)were calculated for indications regarding Figure2.—Southern-blot analyses of insulin two-gene systems. (A) Species tree (Michauxet al.2001; Steppanet al. 2004) of 11 rodent species and human. Shaded branches represent species carrying bothIns2andIns1genes in their genomes. Solid branches represent those with only theIns2ortholog gene,InsorINS, in their genomes. Estimated divergence time of selected species is shown along thex-axis. The scale bar for divergence time is independent of the tree’s branch lengths. Southern blot places the origin ofIns1before the mouse–rat split,20 MYA, but later than the divergence of the Murinae from the Gerbillinae. (B) South-ern-blot results from nine species of rodents, including the house mouse as reference. The entire genomic DNA was digested separately byEcoRI andBamHI to confirm insulin gene copy numbers, but only one digestion per species is presented. The se-lected sizes of DNA ladders are shown on the left of each image; arrowheads on the right indicate positive signals. The darkest signal band in theMmblot is fromIns1(1.3 kb) and the two lighter bands are fromIns2(0.5 and 6.0 kb), as predicted from their genomic sequences (Figure 1).Mm,Mus musculus;Mc,M. caroli;Rl,Rattus losea;As,Apodemus semotus;Nc,Niviventer coxingi;Mu,
strength and type of selection implemented by DnaSP 4.0 (Rozas et al. 2003). The significance (P-values) of each of Tajima’sDvalues as well as Fu and Li’sDvalues was estimated by coalescent simulations with 10,000 replicates. To investigate the evolutionary forces acting onIns1andIns2, we examined their gene regions and flanking regions. The four flanking regions for each insulin gene were chosen randomly with an 8-kb to 100-Mb distance from the gene region and the re-peated sequences were avoided (Table 2 and Figure 4).
To further understand the selective force on residues, we conducted analyses by performing model M3 (three ratios) and model M8 (bandv), respectively, in PAML to test whether there was an acceleration of evolutionary rates (Yang and Nielsen 2002; Yang 2006). In addition, M3 and M8 were compared with M0 (one ratio) and M7 (b), respectively, by performing log-likelihood-ratio tests. The input phylogenetic tree was based on Figure 3 while running different models.
RESULTS AND DISCUSSION
Origin of the duplicate retrogene, Ins1: The copy numbers of certain insulin-coding genes have been confirmed in certain mammalian species: two copies of insulin genes,Ins2andIns1, have been identified in the genomes of house mouse (M. musculus) and rat (R. norvegicus) and a single copy in the genomes of human (H. sapiens, INS) and guinea pig (Cavia porcellus, Ins), which are orthologs ofIns2(Chanet al. 1984; Soares
et al.1985; Wentworthet al.1986). We selected eight rodent species to date the origin ofIns1 precisely. We chose eight species from subfamilies Murinae (R. losea, N. coxingi, A. semotus, and M. caroli), Gerbillinae (Mer. unguiculatus), Cricetinae (Mes. auratus), and Arvicolinae (Mi. kikuchii,E. melanogaster). The phylogenetic relation-ships between the four species with known insulin gene sequences and our eight selected rodent species with unknown copy numbers are illustrated in Figure 2A.
We then carried out Southern blot analyses in the eight rodent species, together with the genomic DNA of house mouse as a positive control. The results revealed thatIns1 exists only in the subfamily Murinae (Figure 2B). As predicted by the distribution of restriction sites (Figure 1), we detected three signals in the house mouse genome (Figure 2B), 0.5 and 6.0 kb fromIns2and 1.4 kb fromIns1. Three signals were also detected for species that are closely related to the house mouse: M. caroli, R. losea, andA. semotus. Two large bands were detected forN. coxingi. PCR cloning and sequencing revealed that the restriction patterns in these four species were derived from the restriction sites in the two copies of insulin genes, Ins1 and Ins2. One restriction site is missing inIns2inN. coxingi, explaining the two signals in this species.
Only one genomic Southern signal was detected in Mes. auratus,E. melanogasterandMi. kikuchii, which sug-gests that there is a single copy of the insulin-coding gene in these genomes. However, the copy number in theMer. unguiculatusgenome was unclear because the two signals were detected in the genomic Southern anal-ysis (Figure 2B). We conducted PCR sequencing and observed that only a single copy of the insulin gene, which is the orthologous copy of theIns2 gene in the house mouse, is present in that genome. OneEcoRI re-striction site was identified in theMer. unguiculatusinsulin gene, which results in two signal bands in this species. In summary, we conclude that only murine rodents, i.e., species in the subfamily Murinae, possess two copies of the insulin genes.
PCR cloning and sequencing experiments. We observe that the gene structures of bothIns2 andIns1 remain identical in all the Murinae species we analyzed: two in-trons appear inIns2and only one intron inIns1. With humanINSas an outgroup, we constructed a neighbor-joining tree using the protein-coding sequences (330 bp) (Figure 3). As expected,Ins2andIns1in the murine rodents formed a distinct clade (the bootstrap support of theIns1–Ins2 cluster is.95% when subtracting the sequence of Mi. kikuchii from the data set, data not shown). This indicates that the evolution of a two-gene system in murine species is unique and differs from that in other murid species (i.e., nonmurine rodents) carry-ing only a scarry-ingle copy of Ins (orthologous to human INS). These results further confirm the single origin of Ins1, which occurred in the most recent common an-cestor of the Murinae. By mapping these results onto existing phylogenies, we estimate that the retroposition event took place before the mouse–rat split and after
the divergence of the Murinae from the Gerbillinae,
20 million years ago (O’Huiginand Li1992; Michaux
et al. 2001). Thus, Ins1 is a relatively young gene and presumably a Murinae-specific retrogene with newly evolved functions in the glucose metabolic pathways.
Functionality of Ins2 and Ins1 in rodents: To de-termine the functional constraint on the insulin-coding genes in these rodent species, we used a well-developed comparative analysis of synonymous (Ks) and
nonsynon-ymous substitutions (Ka) (Li 1993; Nekrutenko et al.
2002). In general, aKa/Ksratio that is significantly lower
than unity is considered to indicate functional constraint. We performed pairwise orthologous comparisons ofIns2 andInsof eight murid species and ofIns1in six murine species. Also, we performed Ka/Ks ratio tests for the
entire coding regions as well as for the B1A chain and C-peptides of both genes, respectively, because insulin peptides are composed of four subfunctional parts. All comparisons revealed unexpectedly small Ka/Ks ratios
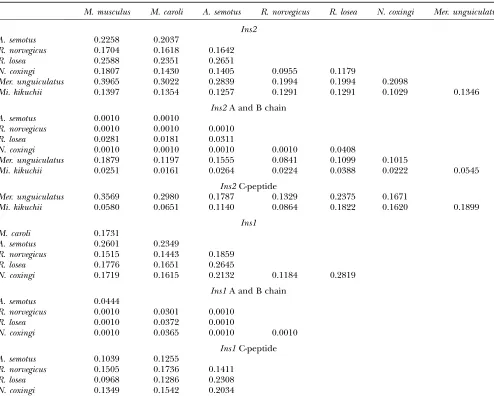
TABLE 1
TheKa/Ksratios ofIns2andIns1and their subfunctional parts
M. musculus M. caroli A. semotus R. norvegicus R. losea N. coxingi Mer. unguiculatus
Ins2 A. semotus 0.2258 0.2037
R. norvegicus 0.1704 0.1618 0.1642
R. losea 0.2588 0.2351 0.2651
N. coxingi 0.1807 0.1430 0.1405 0.0955 0.1179
Mer. unguiculatus 0.3965 0.3022 0.2839 0.1994 0.1994 0.2098
Mi. kikuchii 0.1397 0.1354 0.1257 0.1291 0.1291 0.1029 0.1346
Ins2A and B chain
A. semotus 0.0010 0.0010
R. norvegicus 0.0010 0.0010 0.0010
R. losea 0.0281 0.0181 0.0311
N. coxingi 0.0010 0.0010 0.0010 0.0010 0.0408
Mer. unguiculatus 0.1879 0.1197 0.1555 0.0841 0.1099 0.1015
Mi. kikuchii 0.0251 0.0161 0.0264 0.0224 0.0388 0.0222 0.0545
Ins2C-peptide
Mer. unguiculatus 0.3569 0.2980 0.1787 0.1329 0.2375 0.1671
Mi. kikuchii 0.0580 0.0651 0.1140 0.0864 0.1822 0.1620 0.1899
Ins1 M. caroli 0.1731
A. semotus 0.2601 0.2349
R. norvegicus 0.1515 0.1443 0.1859
R. losea 0.1776 0.1651 0.2645
N. coxingi 0.1719 0.1615 0.2132 0.1184 0.2819
Ins1A and B chain
A. semotus 0.0444
R. norvegicus 0.0010 0.0301 0.0010
R. losea 0.0010 0.0372 0.0010
N. coxingi 0.0010 0.0365 0.0010 0.0010
Ins1C-peptide
A. semotus 0.1039 0.1255
R. norvegicus 0.1505 0.1736 0.1411
R. losea 0.0968 0.1286 0.2308
(significantly,1) (Table 1). Note that not only the in-sulin functional peptides, B and A chains, but also the C-peptide of bothIns1andIns2appear to be highly con-strained in all species examined. Our data are consistent with the evidence from the previous literature: in addi-tion to the critical role in the protein structure assembly, C-peptides serve important functions in the endocrine systems (reviewed in Steiner2004). Overall, the above analyses demonstrate the selective constraints in all in-sulin subfunctional regions, implying the functional im-portance of the insulin two-gene system in murine species. Adaptive evolution of the insulin two-gene system: Our analyses indicate that insulin retrogenes had a single recent origin and that both Ins2 and Ins1 maintain important functions in murine rodents. Although homo-logous regulatory sequences have been found in the two-gene system of rodents, recent studies propose that possible new functions have evolved in the two insulin-coding genes; i.e., NOD mice with eitherIns1 or Ins2 resulted in different phenotypes in the onset of diabetes (Chentoufiand Polychronakos2002; Moriyamaet al. 2003; Thebault-Baumontet al.2003; Jaeckelet al.2004; Nakayamaet al.2005; Babayaet al.2006). It is interest-ing to know whether the two-gene system is subject to selection for new functions, as was shown for many other types of new genes in various organisms (Longet al.2003). The conventional whole-gene-based method ofKa/Ks
-ratio analysis, which is usually used with a large number of substitutions suggesting strong selection, may lack adequate power to detect the varied selection effects among the differing residues because of the small num-ber of substitutions that have occurred in the short divergence time betweenIns1 andIns2. Therefore, we used two approaches to test evolutionary forces in both genes in mouse populations: (i) molecular population genetics to detect the signature left by any recent selection sweep and (ii) a site-specific test of positive selection using site-specificKa/Ksratios.
Genetic variation of DNA sequences in natural pop-ulations can be estimated by two different parameters:
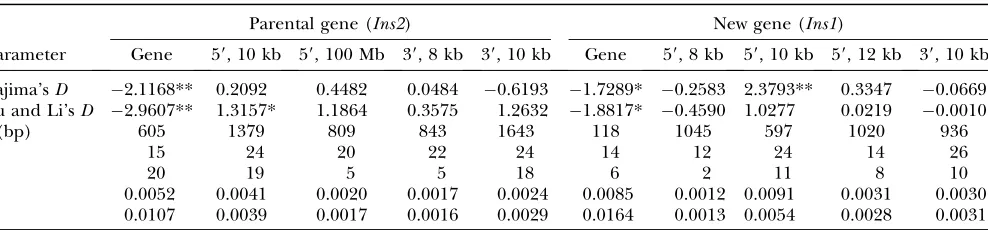
the number of segregating sites (S) and the average number of nucleotide differences using a pairwise com-parison (p). Tajima’sDtests were performed by estimat-ing the difference between these two parameters (Tajima 1989). If strong positive selection is acting on a given gene sequence, there will be an excess of rare alleles (e.g., singletons) (Kimura1983). We thus sequenced theIns2 and Ins1 introns, which are assumed to be evolving neutrally, from the population of a subspecies of house mice (M. musculus domesticus). Remarkably, the poly-morphic spectrum was significantly biased toward rare variants in both genes (Tajima’sD¼ 2.1168,P¼0.0030 and Tajima’sD¼ 2.2454,P¼0.000 for the intron and exon regions ofIns2, respectively, andD¼ 1.7289,P¼
0.040 for the intron region ofIns1.For the exon region of Ins1, although Tajima’sDis negative but not significant (Tajima’s D ¼ 0.6348, P ¼ 0.300), the bias in the spectrum measured by Fu and Li’s method is significant: Fu and Li’sD¼ 1.9301,P¼0.045) (Table 2 and Figure 4). Polymorphic distributions are shown in Figure 5. The data indicate that the insulin two-gene system is subject to positive selection in the mouse populations.
Although the significant D values we observed may result from positive selection acting on these gene re-gions, alternative interpretations should be also consid-ered,e.g., a recent bottleneck effect or the hitchhiking effect of linkage to adjacent regions subject to positive selection. These alternatives could also create a skewed spectrum of polymorphisms imitating positive selection (Bravermanet al.1995; Nurminskyet al.1998). We thus investigated sequence variation in four regions in 59- and 39-flanking sequences that are 8 kb–100 Mb away from the gene region ofIns2andIns1. Tajima’sDvalues are 0.2092 (not significant, NS) and 0.4482 (NS) for the two 59-upstream regions and are 0.0484 (NS) and0.6193 (NS) for the two 39downstream regions ofIns2(Figure 4A and Table 2). These different flanking regions show no bias in the frequency spectra, suggesting a different evolutionary history and thus precluding the alternative hypotheses. We also investigated the polymorphisms in
TABLE 2
Summary statistics of Tajima’sDand Fu and Li’sDestimations
Parental gene (Ins2) New gene (Ins1)
Parameter Gene 59, 10 kb 59, 100 Mb 39, 8 kb 39, 10 kb Gene 59, 8 kb 59, 10 kb 59, 12 kb 39, 10 kb
Tajima’sD 2.1168** 0.2092 0.4482 0.0484 0.6193 1.7289* 0.2583 2.3793** 0.3347 0.0669 Fu and Li’sD 2.9607** 1.3157* 1.1864 0.3575 1.2632 1.8817* 0.4590 1.0277 0.0219 0.0010
l(bp) 605 1379 809 843 1643 118 1045 597 1020 936
n 15 24 20 22 24 14 12 24 14 26
S 20 19 5 5 18 6 2 11 8 10
p 0.0052 0.0041 0.0020 0.0017 0.0024 0.0085 0.0012 0.0091 0.0031 0.0030
u 0.0107 0.0039 0.0017 0.0016 0.0029 0.0164 0.0013 0.0054 0.0028 0.0031
the flanking sequences ofIns1. Tajima’sD’s are 2.3793 (P¼0.004), 0.3347 (NS), and0.2583 (NS) for the three 59-upstream regions and 0.0669 (NS) for the 39 -downstream regions (Figure 4B and Table 2). Once again, these four flanking regions clearly do not follow the same evolutionary history as the coding region of Ins1. These results rule out a genomewide bottleneck or hitchhiking effects inIns2andIns1. Furthermore, Fu and
Li’s D test statistic is consistent with the conclusions drawn by Tajima’s Dvalues (Table 2). All of the above evidence reveals that Darwinian positive selection is the predominant selection mechanism contributing to the retention ofIns1and the evolution of the two-gene insulin system in the mouse populations. Did the positive selec-tion act on the regulatory region or on the protein-coding regions? The spectrum-based population genetic tests do not provide direct discrimination for the two possibilities. However, on the basis of the elevated Tajima’sD’s in the closest flanking regions, the selection would be more likely to occur in the protein-coding regions. This con-jecture is supported by the following substitution analyses of the gene sequences.
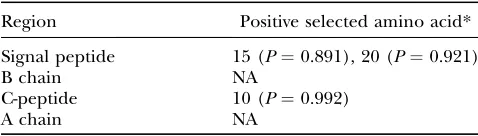
To determine whether or not the amino acids evolve nonuniformly inIns2andIns1peptides, we analyzed the two-gene system in six murine species by using the hu-man insulin gene as an outgroup, including 13 coding sequences (see Figure 3 for their phylogenetic relation-ships). The statistical results showed that model 3 (M3, three ratios) and model 8 (M8, b andv) fit the data significantly better than model 0 (M0, one ratio) and model 7 (M7,b) (P,0.01), respectively. In both M3 and M8, positive selection was detected in three amino acid residues (Table 3): two are located in the signal peptide and the third one in the C-peptide. This reinforces our hypothesis that the coding regions of insulin two-gene systems are subjected to positive selection. Thus, in con-Figure5.—Nucleotide variations ofIns2andIns1gene
sur-rounding regions in wild house mouse populations. Only in-trons were extracted from genes examined. The numbers for the positions,e.g., 23 and 59, indicate the positions of poly-morphic sites. Dots indicate the identical nucleotide as in in-dividuals MC81 and MC55 forIns2andIns1, respectively.
junction with the recent functional analyses in the literature, our data reveal an adaptively evolved insulin two-gene system with diverged functions in the mouse genome. Interestingly, our recent study also demon-strated that positive selection on young retrogene pairs evolves novel functions (Shiaoet al.2007). This suggests that the advantage of retrogenes carrying novel functions may be a universal phenomenon of genomes.
Scenario of evolution of the insulin two-gene system: In conclusion, the retroposed preproinsulin gene,Ins1, was generated in the most recent common ancestor leading to murine species. In general, the gene has been subject to strong selective constraints on all functional parts of the insulin peptides. Interestingly, we detected unexpected significant recent positive selection on both Ins2 and Ins1 in the mouse populations. This, then, raises a particular question of whyIns1, which may be responsible for the development of type 1 diabetes in mice (Moriyama et al. 2003; Babaya et al. 2006), is subject to positive selection in the mouse population. We hypothesize that the evolution ofIns1in the mouse populations may be explained by an ancestral-suscepti-bility model (DiRienzoand Hudson2005) and that the protective property ofIns2could result from the risk of being exposed to diabetes due to a defect ofIns1.
On the basis of recent studies,Ins1may be responsible for the development of type 1 diabetes in mice (M or-iyamaet al.2003; Babayaet al.2006). However,Ins1not only is fixed in the wild populations but also is subject to positive selection. This seems to be contradictory to the conventional concept that only genes/alleles that pro-vide an advantageous effect would be adaptive in natural populations. To explain this unexpected observation in Ins1in mice, we hypothesize that the preservation and adaptation ofIns1may follow an extended form of the thrifty-genotype hypothesis that accounts for the evolu-tion of diabetes-related genes in some human popula-tions (Neel1962). According to this hypothesis, some alleles that increase the risk to common diseases may likely be ancestral alleles in the populations. The derived alleles protect individuals against common diseases and became advantageous recently (Fullertonet al. 2002; VanderMolenet al.2005). It was proposed that a shift in environment and lifestyle increases the risk of individuals
carrying the ancestral alleles in modern populations. In addition to type 2 diabetes, the susceptibility to certain common diseases,e.g., Alzheimer’s disease (Corderet al. 1993; Strittmatteret al.1993), has been determined to result from carrying ancestral alleles at one genetic locus that, under a shift in lifestyle, confer an unfavorable increased risk of disease. In contrast, the derived alleles confer protective functions and are subject to positive selection in the same populations.
AlthoughIns2andIns1are two independent genetic loci, we may apply this model to explain the adaptive evolution of these two genes. We propose that, on the basis of the above model derived from the thrifty-genotype hypothesis, the fixation and preservation of the retrogene, Ins1, likely resulted from the advanta-geous effect under an ancient lifestyle (e.g., an efficient utilization of the intake of energy from the scant food resources in ancient environments). As environments changed, those individuals carryingIns1 were exposed to an increasing risk of developing type 1 diabetes, because of more abundant foods available when the agricultural civilization arose. However, as a newly evolved retrogene, Ins1in the existing mouse popula-tions is subject to positive selection for improving its functions. Meanwhile, as an evolutionary response to the recently emerging disadvantageous effect of Ins1, theIns2copy might have been positively selected for the protection of individuals from developing diabetes and evolved adaptively in these populations as well.
Y.-C. Chan and C.-H. Yu in H.-T. Yu’s laboratory offered technical support and discussion; members of M. Long’s lab offered valuable discussion. B. Harr sent us mouse DNA samples from her collection. We thank R. Arguello, J. Spofford, T. M. Martin, K. Bullaughey, and B. R. Stein for reading of the manuscript and providing valuable comments. Grant support was provided by the National Science Council (Taiwan) to H.-T.Y. and by the National Science Foundation (USA) and the National Institutes of Health (USA) to M.L. The Goodwill Foundation (Taiwan) granted a fellowship to M.-S.S.
LITERATURE CITED
Babaya, N., M. Nakayama, H. Moriyama, R. Gianani, T. Stillet al.,
2006 A new model of insulin-deficient diabetes: male NOD mice with a single copy of Ins1 and no Ins2. Diabetologia49:
1222–1228.
Beintema, J. J., and R. N. Campagne, 1987 Molecular evolution of
rodent insulins. Mol. Biol. Evol.4:10–18.
Braverman, J. M., R. R. Hudson, N. L. Kaplan, C. H. Langleyand
W. Stephan, 1995 The hitchhiking effect on the site frequency
spectrum of DNA polymorphisms. Genetics140:783–796. Chan, S. J., V. Episkopou, S. Zeitlin, S. K. Karathanasis, A. Mackrell
et al., 1984 Guinea pig preproinsulin gene: An evolutionary compromise? Proc. Natl. Acad. Sci. USA81:5046–5050. Chentoufi, A. A., and C. Polychronakos, 2002 Insulin expression
levels in the thymus modulate insulin-specific autoreactive T-cell tolerance: the mechanism by which the IDDM2 locus may predis-pose to diabetes. Diabetes15:1383–1390.
Corder, E., A. M. Saunders, W. J. Strittmatter, D. E. Schmechel,
P. C. Gaskellet al., 1993 Gene dose of apolipoprotein E type 4
allele and the risk of Alzheimer’s disease in late onset families. Science261:828–829.
Davies, P., C. Poirier, L. Deltour and X. Montagutelli,
1994 Genetic reassignment of the Insulin-1 (Ins1) gene to dis-tal mouse chromosome 19. Genomics21:665–667.
TABLE 3
Positively selected amino acid residues shared byIns2
andIns1in murid species
Region Positive selected amino acid*
Signal peptide 15 (P¼0.891), 20 (P¼0.921)
B chain NA
C-peptide 10 (P¼0.992)
A chain NA
DiRienzo, A., and R. R. Hudson, 2005 An evolutionary framework
for common diseases: the ancestral-susceptibility model. Trends Genet.21:596–601.
Force, A., M. Lynch, F. Pickett, A. Amores, Y. Yan et al.,
1999 Preservation of duplicate genes by complementary, de-generative mutations. Genetics151:1531–1545.
Fu, Y., and W. Li, 1993 Statistical tests of neutrality of mutations.
Genetics133:693–709.
Fullerton, S., A. Bartoszewicz, G. Ybazeta, Y. Horikawa, G. I.
Bellet al., 2002 Geographic and haplotype structure of
candi-date type 2 diabetes susceptibility variants at the calpain-10 locus. Am. J. Hum. Genet.70:1096–1106.
Hudson, R. R., D. D. Boosand N. L. Kaplan, 1992 A statistical test
for detecting geographic subdivision. Mol. Biol. Evol.9:138–151. Ihle, A˜ . Aˆ., S. Ravaoarimanana, M. Thomas and D. Tautz,
2006 An analysis of signatures of selective sweeps in natural populations of the house mouse. Mol. Biol. Evol.23:790–797. Jaeckel, E., M. A. Lipesand H.vonBoehmer, 2004 Recessive
toler-ance to preproinsulin 2 reduces but does not abolish type 1 diabetes. Nat. Immunol.5:1028–1190.
Kakita, K., S. Giddingsand M. A. Permutt, 1982 Biosynthesis of
rat insulins I and II: evidence for differential expression of the two genes. Proc. Natl. Acad. Sci. USA79:2803–2807.
Kimura, M., 1983 The Neutral Theory of Molecular Evolution.
Cam-bridge University Press, CamCam-bridge, UK.
Kumar, S., K. Tamuraand M. Nei, 2004 MEGA3: integrated
soft-ware for molecular evolutionary genetics analysis and sequence alignment. Brief. Bioinform.5:150–163.
Li, W. H., 1993 Unbiased estimation of the rates of synonymous and
nonsynonymous substitution. J. Mol. Evol.36:96–99.
Long, M., E. Betran, K. Thorntonand W. Wang, 2003 The origin
of new genes: glimpses from the young and old. Nat. Rev. Genet.
4:865–875.
Lynch, M., and J. S. Conery, 2000 The evolutionary fate and
con-sequences of duplicate genes. Science290:1151–1155. Michaux, J., A. Reyesand F. Catzeflis, 2001 Evolutionary history
of the most speciose mammals: molecular phylogeny of muroid rodents. Mol. Biol. Evol.18:2017–2031.
Moriyama, H., N. Abiru, J. Paronen, K. Sikora, E. Liu et al.,
2003 Evidence for a primary islet autoantigen (preproinsulin 1) for insulitis and diabetes in the nonobese diabetic mouse. Proc. Natl. Acad. Sci. USA100:10376–10381.
Nakayama, M., N. Abiru, H. Moriyama, N. Babaya, E. Liu et al.,
2005 Prime role for an insulin epitope in the development of type 1 diabetes in NOD mice. Nature435:220–223.
Neel, J., 1962 Diabetes mellitus: a ‘‘thrifty’’ genotype rendered
det-rimental by ‘‘progress’’? Am. J. Hum. Genet.14:353–362. Nekrutenko, A., K. Makovaand W. Li, 2002 The K(A)/K(S) ratio
test for assessing the protein-coding potential of genomic regions: an empirical and simulation study. Genome Res.12:198–202. Nurminsky, D. I., M. V. Nurminskaya, D. D. Aguilarand D. L.
Hartl, 1998 Selective sweep of a newly evolved sperm-specific
gene in Drosophila. Nature396:572–575.
O’Huigin, C., and W. H. Li, 1992 The molecular clock ticks
regu-larly in muroid rodents and hamsters. J. Mol. Evol.35:377–384. Rozas, J., J. C. Sa´nchez-Delbarrio, X. Messeguerand R. Rozas,
2003 DnaSP, DNA polymorphism analyses by the coalescent and other methods. Bioinformatics19:2496–2497.
Shiao, M.-S., P. Khil, R. D. Camerini-Otero, T. Shiroishi, K.
Moriwakiet al., 2007 Origins of new male germ-line functions
from X-derived autosomal retrogenes in the mouse. Mol. Biol. Evol.24:2242–2253.
Shiu, S. H., J. K. Byrnes, R. Pan, P. Zhangand W. H. Li, 2006 Role
of positive selection in the retention of duplicate genes in mam-malian genomes. Proc. Natl. Acad. Sci. USA103:2232–2236. Soares, M. B., E. Schon, A. Henderson, S. K. Karathanasis,
R. Cateet al., 1985 RNA-mediated gene duplication: the rat
pre-proinsulin I gene is a functional retroposon. Mol. Cell. Biol.5:
2090–2103.
Steiner, D. F., 2004 The proinsulin C-peptide—a multirole model.
Exp. Diabesity Res.5:7–14.
Steppan, S. J., M. R. Akhverdyan, E. A. Lyapunova, D. G. Fraser,
N. N. Vorontsovet al., 2004 Molecular phylogeny of the marmots
(Rodentia: Sciuridae): tests of evolutionary and biogeographic hypotheses. Syst. Biol.48:715–734.
Strittmatter, W., A. M. Saunders, D. Schmechel, M. Pericak
-Vance, J. Enghildet al., 1993 Apolipoprotein E: high-avidity
binding to beta-amyloid and increased frequency of type 4 allele in late-onset familial Alzheimer disease. Proc. Natl. Acad. Sci. USA90:1977–1981.
Tajima, F., 1989 Statistical method for testing the neutral mutation
hypothesis by DNA polymorphism. Genetics123:585–595. Thebault-Baumont, K., P. Krief, J. P. Briand, P. Halbout, K. Vallon
-Geoffroyet al., 2003 Acceleration of type 1 diabetes mellitus in
proinsulin 2-deficient NOD mice. J. Clin. Invest.111:851–857. Thompson, J. D., D. G. Higginsand T. J. Gibson, 1994 CLUSTAL W:
improving the sensitivity of progressive multiple sequence align-ment through sequence weighting, positions-specific gap penal-ties and weight matrix choice. Nucleic Acids Res.22:4673–4680. VanderMolen, J., L. M. Frisse, S. M. Fullerton, Y. Qian, L. Del
Bosque-Plata et al., 2005 Population genetics of CAPN10
and GPR35: implications for the evolution of type 2 diabetes var-iants. Am. J. Hum. Genet.76:548–560.
Wentworth, B. M., I. M. Schaefer, L. Villa-Komaroffand J. M.
Chirgwin, 1986 Characterization of the two nonallelic genes
encoding mouse preproinsulin. J. Mol. Evol.23:305–312. Yang, Z., 1997 PAML: a program package for phylogenetic analysis
by maximum likelihood. Comput. Appl. Biosci.13:555–556. Yang, Z., 2006 On the varied pattern of evolution of two fungal
ge-nomes: a critique of Hughes and Friedman. Mol. Biol. Evol.23:
2279–2282.
Yang, Z., and R. Nielsen, 2002 Codon-substitution models for
de-tecting molecular adaptation at individual sites along specific lin-eages. Mol. Biol. Evol.19:908–917.